Table of contents
1. NPM install ECharts
You can use the following command to install ECharts via npm
npm install echarts --save
2. Introduce ECharts
import * as echarts from 'echarts';

// 基于准备好的dom,初始化echarts实例
var myChart = echarts.init(document.getElementById('main'));
// 绘制图表
myChart.setOption({


  title: {


    text: 'ECharts 入门示例'
  },
  tooltip: {

    },
  xAxis: {


    data: ['衬衫', '羊毛衫', '雪纺衫', '裤子', '高跟鞋', '袜子']
  },
  yAxis: {

    },
  series: [
    {


      name: '销量',
      type: 'bar',
      data: [5, 20, 36, 10, 10, 20]
    }
  ]
});
3. Import ECharts charts and components as needed
The above code will import all charts and components in ECharts. If you don't want to import all components, you can also use the on-demand import interface provided by ECharts to package the necessary components.
// 引入 echarts 核心模块,核心模块提供了 echarts 使用必须要的接口。
import * as echarts from 'echarts/core';
// 引入柱状图图表,图表后缀都为 Chart
import {

     BarChart } from 'echarts/charts';
// 引入提示框,标题,直角坐标系,数据集,内置数据转换器组件,组件后缀都为 Component
import {


  TitleComponent,
  TooltipComponent,
  GridComponent,
  DatasetComponent,
  TransformComponent
} from 'echarts/components';
// 标签自动布局、全局过渡动画等特性
import {

     LabelLayout, UniversalTransition } from 'echarts/features';
// 引入 Canvas 渲染器,注意引入 CanvasRenderer 或者 SVGRenderer 是必须的一步
import {

     CanvasRenderer } from 'echarts/renderers';

// 注册必须的组件
echarts.use([
  TitleComponent,
  TooltipComponent,
  GridComponent,
  DatasetComponent,
  TransformComponent,
  BarChart,
  LabelLayout,
  UniversalTransition,
  CanvasRenderer
]);

// 接下来的使用就跟之前一样,初始化图表,设置配置项
var myChart = echarts.init(document.getElementById('main'));
myChart.setOption({


  // ...
});
It should be noted that in order to ensure the smallest package size, ECharts does not provide any renderer when imported on demand, so you need to choose to import CanvasRenderer or SVGRenderer as the renderer. The advantage of this is that if you only need to use the svg rendering mode, the unused CanvasRenderer module will not be included in the packaged result.
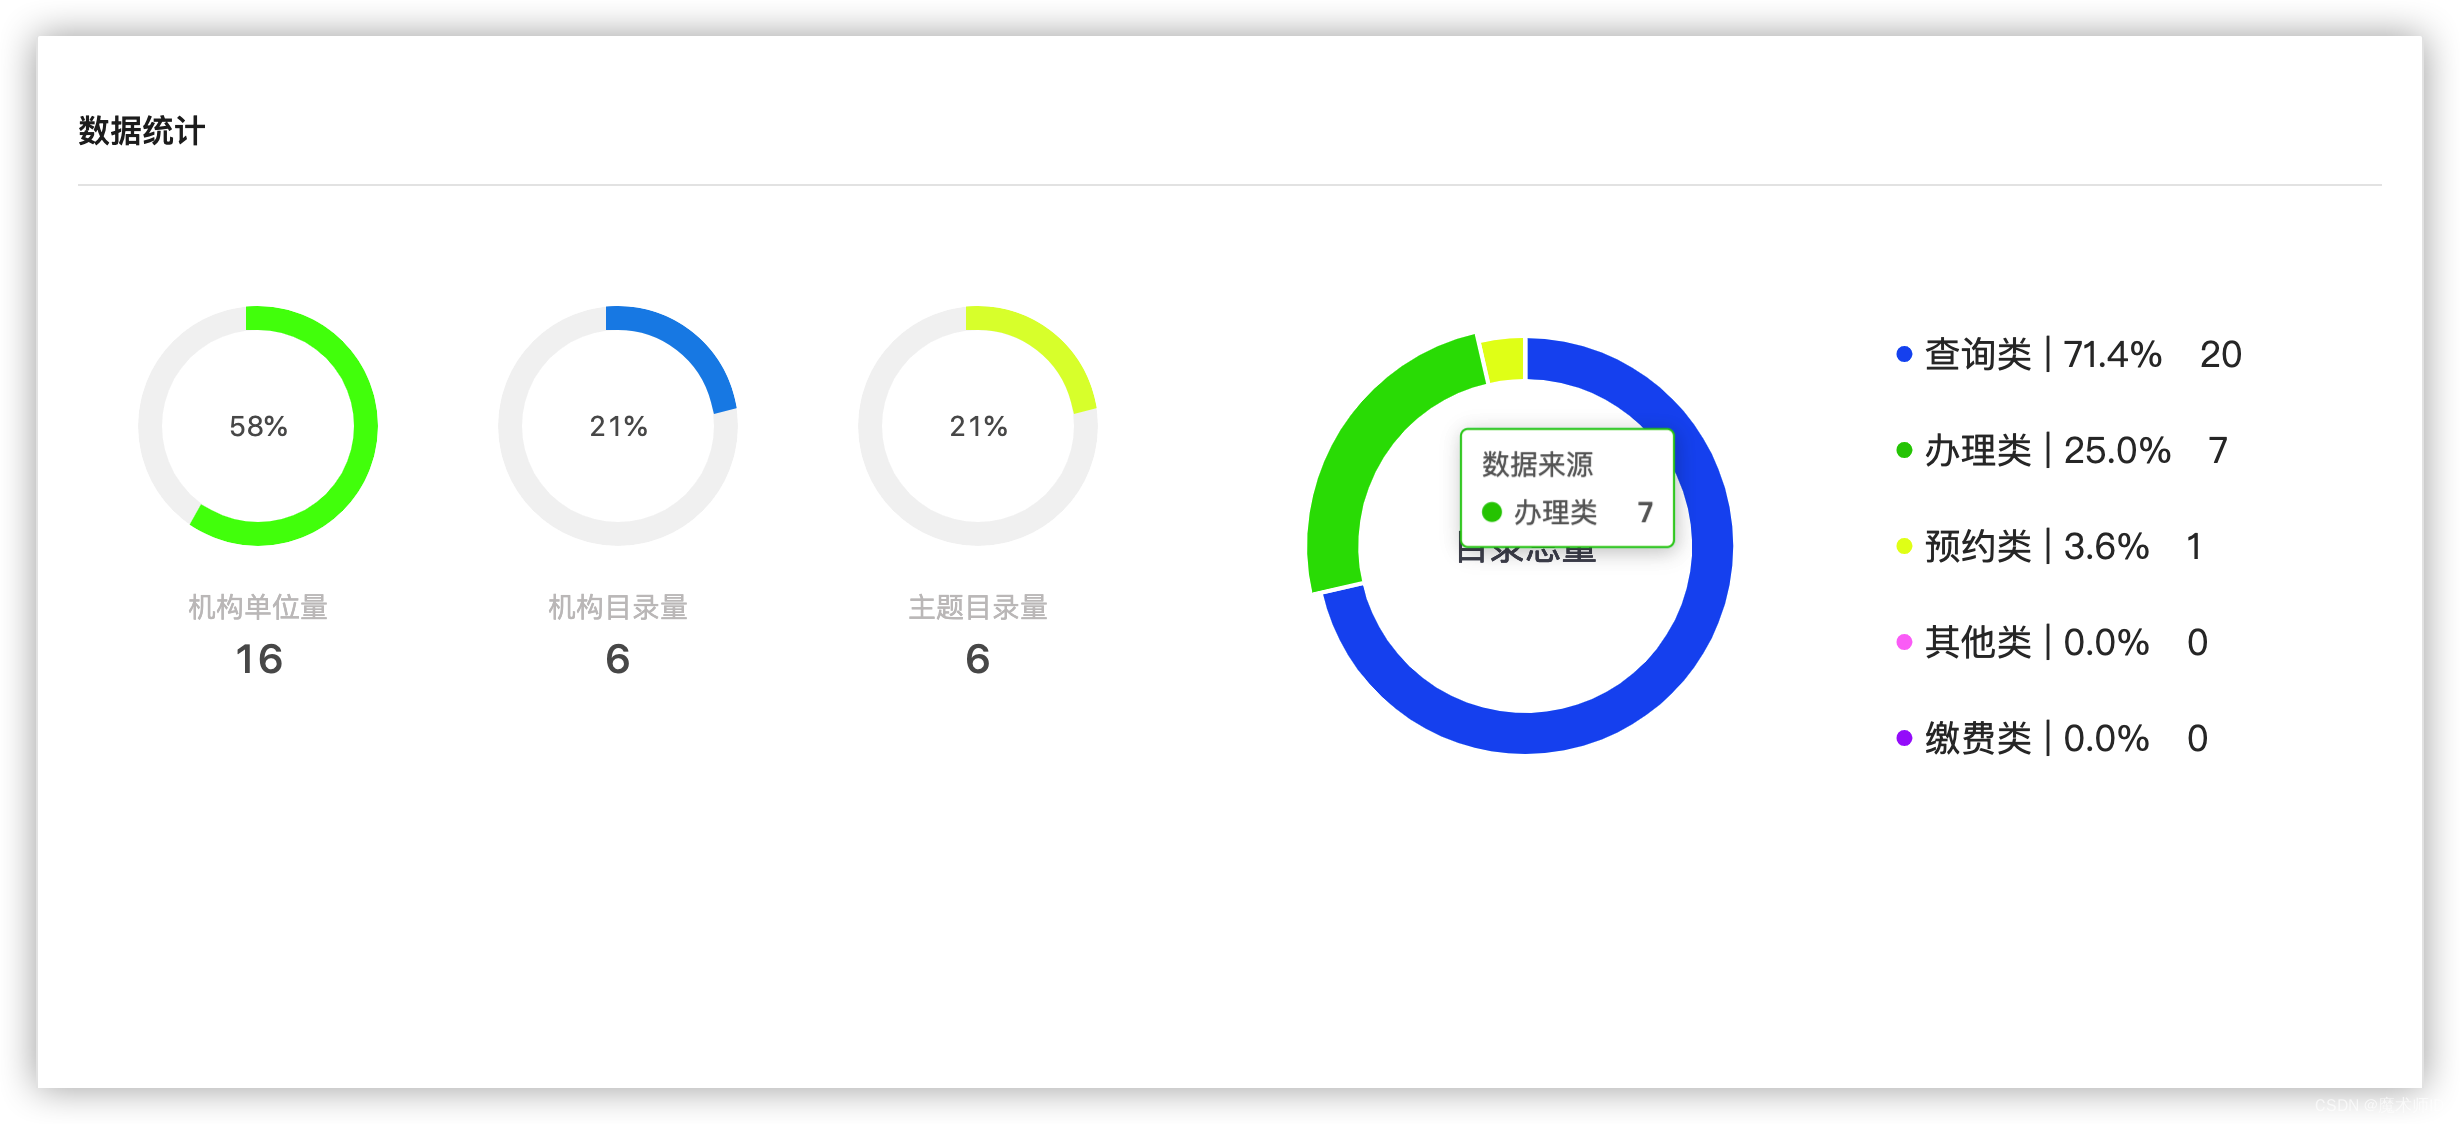
4. Use echarts rounded ring chart
  getEchartData() {


      const chart = this.$refs.mycharts
      if (chart) {


        var myChart = echarts.init(chart)
        var option
        const that = this
        const list = that.subjectList
        option = {


          tooltip: {


            trigger: 'item'
          },
          legend: {


            itemWidth: 10,
            itemHeight: 10,
            icon: 'circle',
            x: 'right',
            y: 'center',
            orient: 'vertical', // 设置图例排列纵向显示
            align: 'left', // 设置图例中文字位置在icon标识符的右侧
            left: '60%',
            textStyle: {


              fontSize: 18
            },
            top: '15%',
            itemGap: 30, // 设置图例之间的间距
            padding: [0, 0, 0, 0], // 设置图例与圆环图之间的间距
            formatter: function (name) {


              // 该函数用于设置图例显示后的百分比
              var total = 0
              var value
              list.forEach(item => {


                total += item.value
                if (item.name === name) {


                  value = item.value
                }
              })
              var p = ((value / total) * 100).toFixed(1) // 求出百分比,保留2位小数
              return `${

      name} | ${

      p}%   ${

      value}`
            }
          },
          series: [
            {


              name: '数据来源',
              type: 'pie',
              radius: ['55%', '70%'],
              avoidLabelOverlap: false,
              itemStyle: {


                borderRadius: 0,
                borderColor: '#fff',
                borderWidth: 2
              },
              label: {


                normal: {


                  show: true,
                  position: 'center',
                  formatter: '目录总量',
                  fontSize: 18,
                  color: '#4d4f5c'
                }
              },

              labelLine: {


                show: true
              },
              center: ['30%', '50%'],
              color: ['#195df2', '#22c900', '#e4ff18', '#ff7bf8', '#a73afb'],
              data: list
            }
          ]
        }
      }
      option && myChart.setOption(option)
    }