Typical black-box test case design methods include equivalence class partitioning, boundary value analysis, decision table, and cause-and-effect diagrams .
If the input conditions of the program are related to each other, it will make the situation more complicated, because it is not an easy task to check the combination of input conditions, even if all the input conditions are divided into equivalence classes, the relationship between them There are quite a lot of combinations and it is difficult to analyze. Therefore, we must consider the use of causal diagrams, which can design test cases for the combination of multiple conditions and multiple actions.
01. How to draw a causal diagram
The cause-and-effect diagram is a black-box testing method, which can help people efficiently select test cases according to certain steps, and can also point out the incompleteness and ambiguity in the requirement specification.
1. The causal relationship between input conditions and output results
Figure 1 describes the relationship between input conditions and output results, that is, "cause and effect relationship". There are four kinds of this relationship: identity, not, or, and.
Identity: If the cause occurs, the effect occurs; if the cause does not occur, the effect does not occur. For example, if a=1, b=1; if a=0, then b=0.
Not: If the cause occurs, the effect does not occur; if the cause does not occur, the effect occurs. For example, if a=1, then b=0; if a=0, then b=1.
Or: if one of several causes occurs, the effect occurs; if none of the several causes occurs, the effect does not occur. For example, if a=1 or b=1 or c=1, then d=1; if a=b=c=0, then d=0.
AND: If several causes occur, the effect will occur; if one of the causes does not occur, the effect will not occur. For example, if a=b=c=1, then d=1; if a=0 or b=0 or c=0, then d=0.
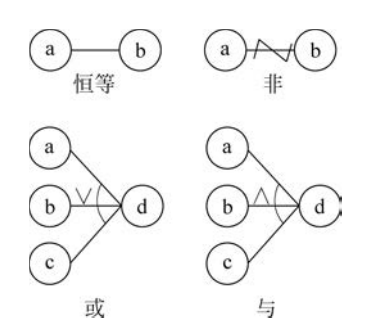
■ Figure 1 Logic symbols of cause and effect diagram
2. Input or output constraints
As shown in Figure 2, there may also be some dependencies between input states, or mutual constraints between output results, which are called constraints. The constraint relationship described by it can generally be divided into five categories: mutual exclusion, inclusion, uniqueness, requirement and shielding. Among them, the constraints of the input conditions have the following four types.
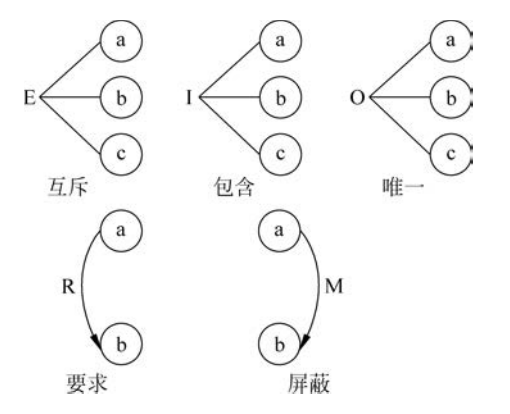
■ Figure 2 Constraint symbol of causal diagram
Mutual exclusion (E): It means that the three reasons a, b, and c cannot be established at the same time, and at most one of them may be established.
Inclusion (I): Indicates that at least one of the three reasons a, b, and c must be established.
Unique (O): Indicates that one of a, b, and c must be established, and only one of them is established.
Requirement (R): Indicates that when a appears, b must also appear. For example, if a=1, then b must be 1.
And there is only one type of output condition constraints, that is, masking (M): if a=1, then b must be 0; and when a=0, the value of b is uncertain.
3. Steps of designing test cases by causal graph method
(1) Analyze which are causes and which are effects in the description of the program specification, and assign an identifier to each cause and effect. Causes are often input conditions or equivalence classes of input conditions, and effects are output conditions.
(2) Analyze the semantic content in the description of the program specification and represent it as a "causal diagram" connecting each cause with each effect.
(3) Indicate the constraints. Some combinations of cause and effect are impossible due to grammatical or environmental constraints. To indicate these specific situations, several standard symbols can be used on the cause-and-effect diagram to designate constraints or restrictions.
(4) Convert the causal diagram into a decision table.
(5) Take out each column in the decision table as a basis to design test cases.
The test cases (partial, combined) generated by the causality diagram include the cases of taking True and False of all input data, and the number of test cases formed by it reaches the minimum, and the number of test cases increases with the increase of the number of input data. In more complex problems, this method is often very effective, and it can effectively help testers to determine test cases. Of course, if the development project adopts the decision table in the design stage, then there is no need to draw the cause-and-effect diagram. At this time, the test case can be designed directly using the decision table.
02. Test cases of causality diagram method
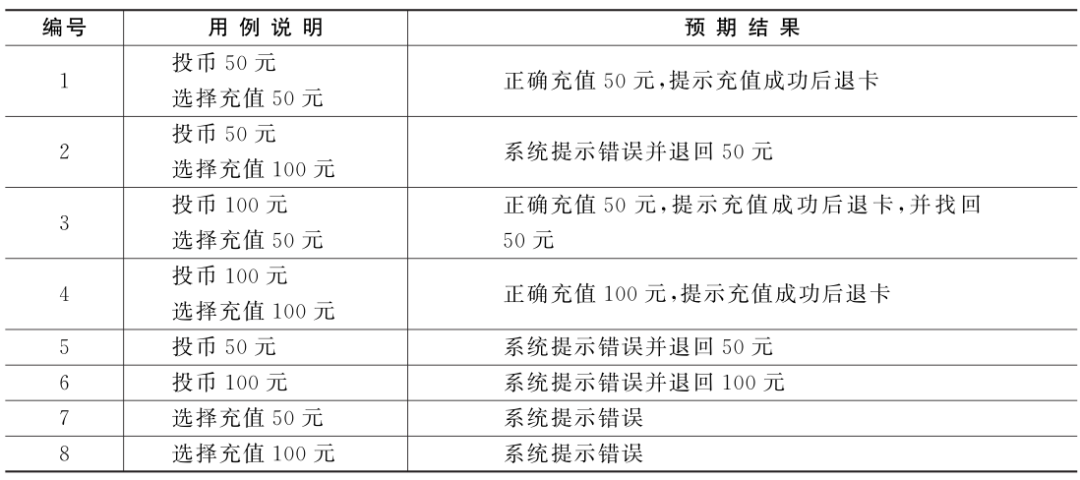
Figure 3 shows the traffic card automatic recharge simulation system, and its requirements are described as follows.
(1) The system only accepts 50 yuan or 100 yuan banknotes, and only one banknote can be used for one recharge, and the recharge amount can only be 50 yuan or 100 yuan.
(2) If you enter 50 yuan banknotes and choose to recharge 50 yuan, the card will be returned after the recharge is completed, and the recharge will be successful.
(3) If you enter 50 yuan banknotes and choose to recharge 100 yuan, it will prompt that the amount entered is insufficient, and 50 yuan will be refunded.
(4) If you enter 100 yuan banknotes and choose to recharge 50 yuan, the card will be returned after the recharge is completed, and it will prompt that the recharge is successful, and you will get 50 yuan in change.
(5) If you enter 100 yuan banknotes and choose to recharge 100 yuan, the card will be returned after the recharge is completed, and the recharge will be successful.
(6) If you do not select the recharge button within the specified time after inputting banknotes, the input banknotes will be returned and an error will be prompted.
(7) If you do not enter banknotes after selecting the recharge button, an error message will be displayed.
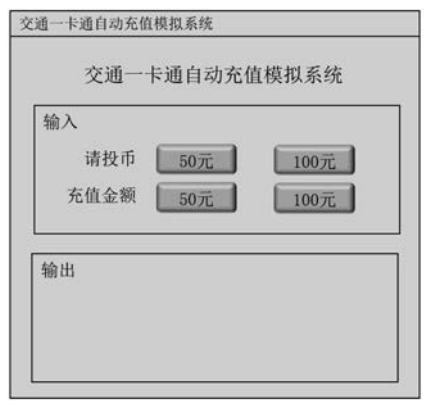
■ Figure 3 Traffic card automatic recharge simulation system
The test case design process of the traffic card automatic recharge system is given below.
1) Restriction and combination relationship between conditions
According to the above description, the input conditions (causes) are as follows.
(1) Coin 50 yuan (1).
(2) Coin 100 yuan (2).
(3) Choose to recharge 50 yuan (3).
(4) Choose to recharge 100 yuan (4).
The output (result) is as follows.
(1) Complete recharge and refund (a).
(2) Prompt that the recharge is successful (b).
(3) Change (c).
(4) Prompt error (d).
2) Clarify the constraint relationship and combination relationship between all conditions
The constraints and combinations of conditions are shown in Figure 4.
■ Figure 4 Constraint relationship between conditions
3) Draw a causal diagram
In order to describe more clearly, a cause-and-effect diagram is drawn separately for each situation.
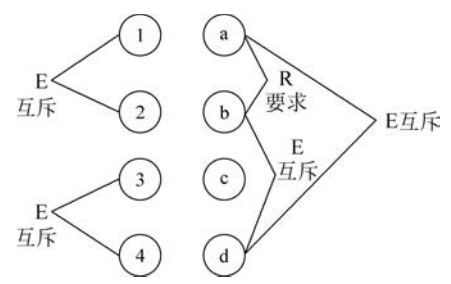
(1) Condition 1 and condition 3 can be combined, output the combination of a and b, that is, coin 50 yuan, recharge 50 yuan, it will output the result of recharge completed, card refunded, prompting successful recharge. Its causal diagram is shown in Figure 5.
■ Figure 5 Combination of condition 1 and condition 3
(2) Condition 1 and condition 4 can be combined, and the combination of c and d is output, that is, the coin is 50 yuan, and the recharge is 100 yuan, and the result of changing and prompting an error will be output. The causal relationship is shown in Figure 6.
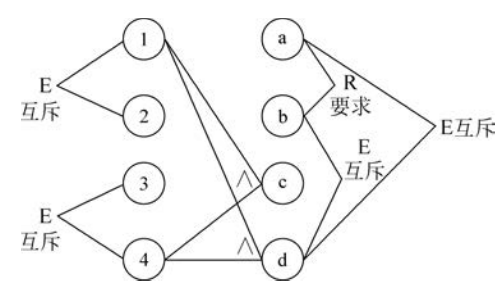
■ Figure 6 Combination of condition 1 and condition 4
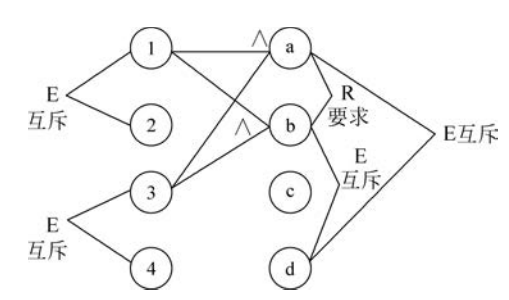
(3) Condition 2 and condition 3 can be combined, and the combination of a, b, and c is output, that is, the coin is 100 yuan, and the recharge is 50 yuan. It will output the results of change, recharge completed, and recharge successful. Its causal diagram is shown in Figure 7.
■ Figure 7 Combination of condition 2 and condition 3
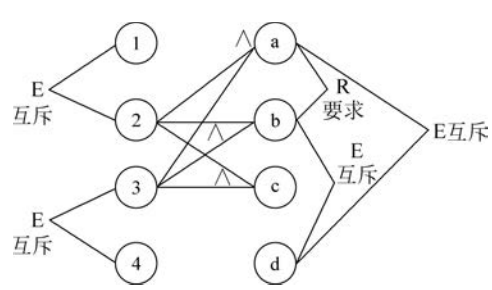
(4) Condition 2 and condition 4 can be combined, output the combination of a and b, that is, insert 100 yuan of coins, recharge 100 yuan, and output the result of completing the recharge, refunding the card, and prompting that the recharge is successful. Its causal diagram is shown in Figure 8.
■ Figure 8 Combination of condition 2 and condition 4
(5) Conditions 1, 2, 3, and 4 can all appear independently, and their causal diagrams are shown in Figure 9.
■ Figure 9 Each condition appears independently
4) Write a decision table based on the causal diagram
According to the causal diagram above, write out the corresponding decision table, as shown in Table 1.
■ Table 1 decision table
5) Write test cases according to the decision table
According to the above decision table, write the corresponding test cases, as shown in Table 2.
■ Table 2 Test cases of automatic recharge simulation system for transportation card