Article directory
1. Several situations of OOM exist.
In addition to the program counter, several other runtime areas of the virtual machine memory may be OOM. However, heap memory overflow is the most common.
1. Heap memory overflow
General exception information: java.lang.OutOfMemoryError: Java heap space
The java heap is used to store object instances. As long as we continue to create objects and ensure that there is a reachable path between GC Roots and objects to avoid the garbage collection mechanism from clearing these objects, memory overflow will occur after the number of objects reaches the maximum heap capacity limit. abnormal.
2. Virtual machine stack and local method stack overflow
If the stack depth requested by the thread is greater than the maximum depth allowed by the virtual machine, a StackOverflowError exception will be thrown.
If the virtual machine cannot apply for enough memory space when expanding the stack, an OutOfMemoryError exception will be thrown
It should be noted here that when the size of the stack is larger, the number of threads that can be allocated is less.
3. Runtime constant pool overflow
Exception information: java.lang.OutOfMemoryError: PermGen space
If you want to add content to the runtime constant pool, the easiest way is to use the Native method String.intern(). The function of this method is: if the pool already contains a string equal to this String, return the String object representing this string in the pool; otherwise, add the string contained in this String object to the constant pool, and return this A reference to a String object. Since the constant pool is allocated in the method area, we can limit the size of the method area through
-XX:PermSize and -XX:MaxPermSize , thereby indirectly limiting the capacity of the constant pool.
4. Method area overflow
Exception information: java.lang.OutOfMemoryError: PermGen space
The method area is used to store relevant information of Class, such as class name, access modifier, constant pool, field description, method description, etc.
Method area overflow is also a common memory overflow exception. If a class is to be reclaimed by the garbage collector, the judgment conditions are very strict. Pay special attention to this point in applications that often dynamically generate a large number of Classes.
2. Common troubleshooting ideas for several problems
1. Heap memory overflow check.
(1). When the program starts, we can set the following parameters to generate a dump file when the memory overflows:
-XX:Xms20m;
-XX:Xms20m:
-XX:+HeapDumpOnOutOfMemoryError
-XX:HeapDumpPath=D:/(note that there is no Number)
The above command is configured to output overflow information when the memory overflow has occurred. In actual work, it is impossible to wait for the real overflow to process, and the data will be monitored in real time.
(2). Use jmap to view the memory status in real time/export dump files.
Generally, there are the following steps:
(1).jps -l: find the current process id.
(2).jmap -heap pid: view the data of the current process. (Usage of the old generation and the new generation)
(3).jmap -dump:format=b,file=app.hprof pid (export the hprof file of the process, the mapping of the memory situation)
Note: the file is followed by the file The name and file path are automatically generated and displayed in cmd, just go to the corresponding path to find the file.
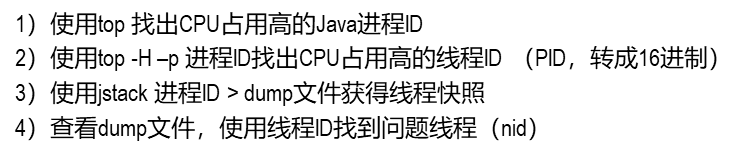
2. Java process CPU usage is too high check.
3. Java process memory leak.
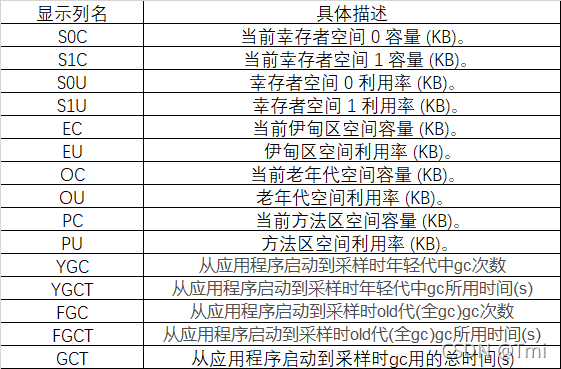
Mainly use the jstat command to check the GC situation.
jstat -gc pid [interval]
The meaning of each parameter is as follows:
3. JVM tuning
Portal: Interviewer: How to perform JVM tuning (with real cases)
jvm tuning, the tuning is stable, and it will not bring you a significant improvement in performance. Needless to say, the importance of service stability, to ensure service stability, gc will always be one of the unstable factors that Java programmers need to consider. For complex and high-concurrency services, it is necessary to ensure that there will be no performance degradation in each gc, and that various performance indicators will not fluctuate. The gc recovery is regular and clean, and the appropriate jvm settings must be found. Full gc will affect performance the most. According to code problems, avoid full gc frequency. You can appropriately increase the capacity of the young generation, so that large objects can trigger yong gc in the young generation, adjust the recycling frequency of large objects in the young generation, ensure that large objects are recycled in the young generation as much as possible, and shorten the recovery time of the old generation.
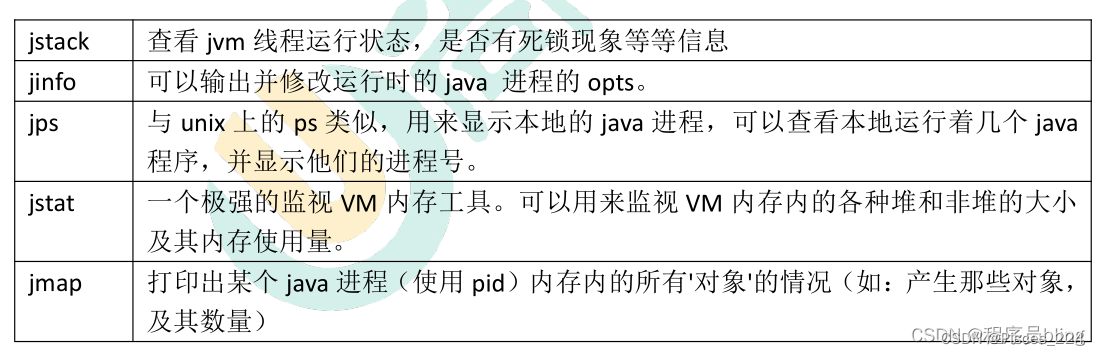
1. Several common tools.
2. Command example.
3. Tuning - set the memory ratio of the new generation and the old generation.
1. This parameter has a great impact on system performance and GC behavior,
The new generation generally sets 1/3-1/4 of the entire heap space.
-Xmn10m: Set the initial size of the new generation to 10m.
2. -XX:SurvivorRatio: Used to set the ratio of eden space and from/to space in the new generation.
That is, -XX:SurvivorRatio=eden/from=eden/to
Example: -Xmn10m -XX:SurvivorRatio=2 Then eden5m, from and t are 2.5m each
3.-XX:NewRatio=Old Generation/New Generation
Set the ratio of the old generation to the new generation.
Basic strategy:
Reserve objects in the new generation as much as possible to reduce the number of GCs in the old generation.
Supplement:
Oracle does not form a document for all heap parameters. If we want to check a certain parameter, we can view it through the command.
java -XX:+PrintFlagsFinal -version
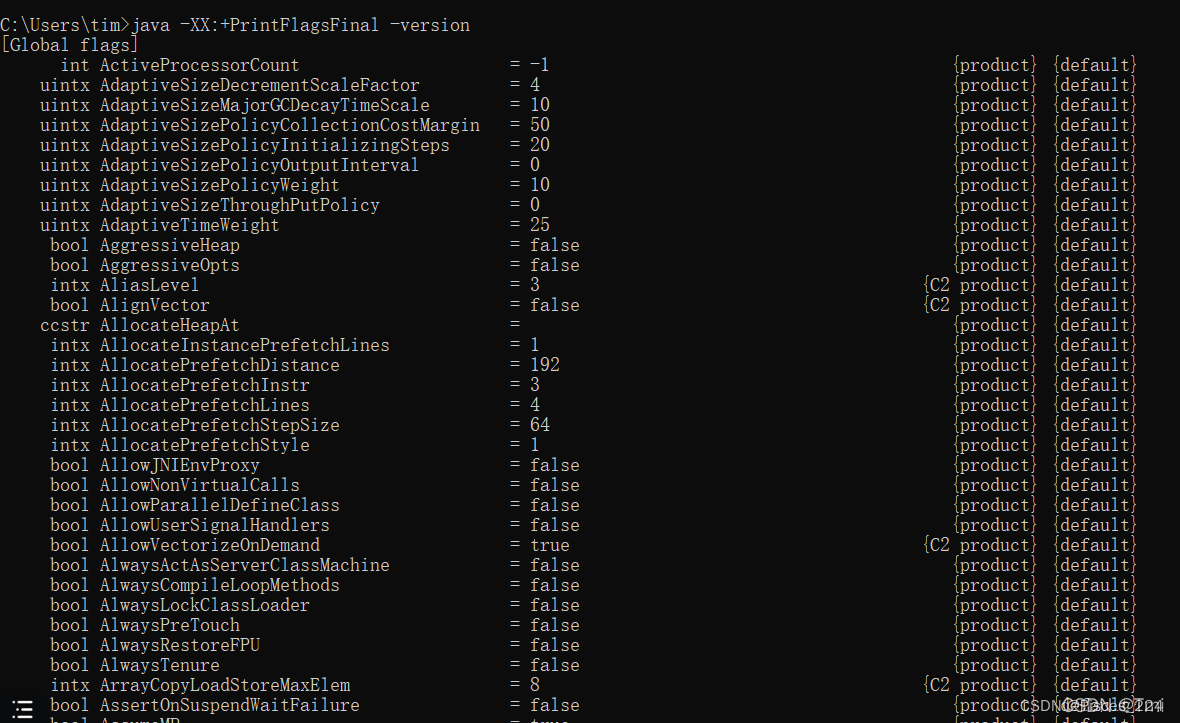
If you need to check any parameters, you can directly grep later.
This article is reproduced from: Analysis and solution OOM and JVM parameter tuning