Here I will share with you some of the knowledge I have summarized on the Internet, I hope it will be helpful to everyone
background
When I was listening to music recently, I saw various dynamic effects, and suddenly became curious about how these audio data are acquired and displayed, so I spent a few days researching related content. Here are just some code examples for you. You need to understand the details , To understand, it is recommended that you read this article in conjunction with relevant API documents.
Reference address: Web Audio API - Web API Interface Reference | MDN (mozilla.org)

Implementation ideas
First of all, drawing must be done with canvas. How to obtain audio-related data (such as frequency, waveform), you need to obtain the DOM of the relevant audio or obtain the relevant audio data through request processing, and then provide relevant information through the Web Audio API. method to achieve. (Of course, the issue of cross-domain audio requests should also be considered, which is left at the end.)
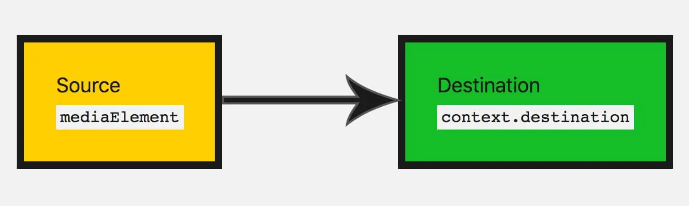
A simple and typical web audio process is as follows (taken from MDN):
- Create an audio context
- Create sources in an audio context — eg
<audio>, oscillators, streams - Create effect nodes such as reverb, biquad, pan, compressor
- Choose a destination for the audio, such as your system speakers
- Connect the source to the effect unit, and the effect output to the destination

accomplish
1. Frequency diagram
To realize the first type, first we need to obtain an online audio data through fetch or xhr, here take fetch as an example;
 //创建一个音频上下文、考虑兼容性问题
 let audioCtx = new (window.AudioContext || window.webkitAudioContext)();
 //添加一个音频源节点
 let source = audioCtx.createBufferSource();
//res.arrayBuffer是将数据转换为arrayBuffer格式
 fetch(url).then((res) => res.arrayBuffer()).then((res) => {
        //decodeAudioData是将arrayBuffer格式数据转换为audioBuffer
        audioCtx.decodeAudioData(res).then((buffer) => {
          // decodeAudioData解码完成后,返回一个AudioBuffer对象
          // 绘制音频波形图
          draw(buffer);
          // 连接音频源
          source.buffer = buffer;
          source.connect(audioCtx.destination);
          // 音频数据处理完毕
        });
      });
What needs to be understood is that source.connect(audioCtx.destination) is to link the audio source node to the output device, otherwise there will be no sound. So now that we have the data, we just need to draw the data through the canvas.
function draw(buffer) {
  // buffer.numberOfChannels返回音频的通道数量,1即为单声道,2代表双声道。这里我们只取一条通道的数据
  let data = [];
  let originData = buffer.getChannelData(0);
  // 存储所有的正数据
  let positives = [];
  // 存储所有的负数据
  let negatives = [];
  // 先每隔50条数据取1条
  for (let i = 0; i < originData.length; i += 50) {
    data.push(originData[i]);
  }
  // 再从data中每10条取一个最大值一个最小值
  for (let j = 0, len = data.length / 10; j < len; j++) {
    let temp = data.slice(j * 10, (j + 1) * 10);
    positives.push(Math.max(...temp));
    negatives.push(Math.min(...temp));
  }
  if (canvas.getContext) {
    let ctx = canvas.getContext("2d");
    canvas.width = positives.length;
    let x = 0;
    let y = 75;
    let offset = 0;
    var grd = ctx.createLinearGradient(0, 0, canvas.width, 0);
    // 为渐变添加颜色,参数1表示渐变开始和结束之间的位置(用0至1的占比表示),参数2位颜色
    grd.addColorStop(0, "yellow");
    grd.addColorStop(0.5, "red");
    grd.addColorStop(1, "blue");
    ctx.fillStyle = grd;
    ctx.beginPath();
    ctx.moveTo(x, y);
    // 横坐标上方绘制正数据,下方绘制负数据
    // 先从左往右绘制正数据
    // x + 0.5是为了解决canvas 1像素线条模糊的问题
    for (let k = 0; k < positives.length; k++) {
      ctx.lineTo(x + k + 0.5, y - 50 * positives[k]);
    }

    // 再从右往左绘制负数据
    for (let l = negatives.length - 1; l >= 0; l--) {
      ctx.lineTo(x + l + 0.5, y + 50 * Math.abs(negatives[l]));
    }
    // 填充图形
    ctx.fill();
  }
}
[Reference Article]( Web Audio - Drawing Audio Maps - Nuggets (juejin.cn) )
2. Real-time frequency chart
To achieve the second type, to obtain the real-time frequency, the API used is different from the first one, but the process is always through an audio source node through the connection to achieve the effect. It's just that an analyzer analyzer is added in the middle of the connection, and the analyzer is connected to the output device.
    const audio =document.querySelector('audio')
    //解决音频跨域问题
    audio.crossOrigin ='anonymous'
    const  canvas =document.querySelector('canvas')
    const ctx=canvas.getContext("2d")
        function initCanvas(){
        //初始化canvas
            canvas.width=window.innerWidth*devicePixelRatio
            canvas.height=(window.innerHeight/2)*devicePixelRatio
        }
        initCanvas()
        //将数据提出来
        let dataArray,analyser;
        //播放事件
        audio.onplay=function(){
            //创建一个音频上下文实例
            const audioCtx=new (window.AudioContext || window.webkitAudioContext)();
            //添加一个音频源节点
            const source=audioCtx.createMediaElementSource(audio);
            //分析器节点
             analyser=audioCtx.createAnalyser();
            //fft分析器  越大 分析越细
            analyser.fftSize=512
            //创建一个无符号字节的数组
             dataArray=new Uint8Array( analyser.frequencyBinCount);
            //音频源节点 链接分析器
            source.connect(analyser)
            //分析器链接输出设备
            analyser.connect(audioCtx.destination,)
        }
            requestAnimationFrame(draw)
            //
            const {width ,height}=canvas;
            ctx.clearRect(0,0,width,height)
            //分析器节点分析出的数据到数组中
            ctx.fillStyle='#78C5F7'
           ctx.lineWidth = 2;
            ctx.beginPath();
            //getByteFrequencyData,分析当前音频源的数据 装到dataArray数组中去
            //获取实时数据
            analyser.getByteFrequencyData(dataArray)
            // console.log(dataArray);
            const len =dataArray.length;
            const barWidth=width/len;
            let x=0;
            for(let i=0;i<len;i++){
                const data=dataArray[i];
                const barHeight=data/255*height;

                // ctx.fillRect(x,y,barWidth,height)

        let v = dataArray[i] / 128.0;
        let y = v * height/2;

        if(i === 0) {
            ctx.moveTo(x, y);
        } else {
            ctx.lineTo(x, y);
        }

        x += barWidth;
            }
            // ctx.lineTo(canvas.width, canvas.height/2);
            ctx.stroke();
        }
        draw();
About requesting audio cross-domain problem solutions
Just add an attribute to the obtained audio DOM
audio.crossOrigin ='anonymous'
Or add crossorigin="anonymous" directly to the aduio tag
Summarize
Although there are already many open source audio-related libraries, if you really want to understand, learn audio-related things. It is necessary to study the relevant Web Audio API in depth. Of course, only two of the methods are used here to implement Web Audio to realize visualization. It is a basic introduction. For the createBufferSource , createMediaElementSource , createAnalyser , AudioContext , arrayBuffer , decodeAudioData , etc. Relevant APIs need to be understood. In terms of visualization, there are various ways to draw animations, such as WebGL. It's not just about visualization that's being done with audio either.
This article is reproduced in:
https://juejin.cn/post/7205381513339322427
If it is helpful to you, you are welcome to pay attention. I will update the technical documents regularly, and we will discuss and learn together and make progress together.
