Article directory
Environment deployment
Notes on the deployment of related environments are as follows:
-
Zookeeper and spark installation: small notes on building a Spark cluster on zookeeper
-
Kafka installation and use: kafka study notes
-
sbt download and installation: Linux no pit installation sbt
Main structure of the project
Data can generally be divided into static data and streaming data. The processing of static data and streaming data corresponds to two distinct computing modes: batch computing and real-time computing. Batch computing takes "static data" as the object, and can batch process massive data in ample time to obtain valuable information. Hadoop is a typical batch processing model. HDFS and HBase store a large amount of static data, and MapReduce is responsible for performing batch calculations on massive data. Streaming data must be calculated in real time. One of the most important requirements for real-time calculation is to be able to obtain calculation results in real time. Generally, the response time is required to be at the second level. When only a small amount of data needs to be processed, real-time computing is not a problem; however, in the era of big data, not only the data format is complex, there are many sources, but also the amount of data is huge, which poses a great challenge to real-time computing. Therefore, real-time computing for stream data - stream computing, came into being.
The stream computing process includes real-time data collection, real-time data calculation, and real-time query services.
- Real-time data collection: The real-time data collection stage usually collects massive data from multiple data sources, which needs to ensure real-time performance, low latency, and stability and reliability. At present, there are many open source distributed log collection systems released by Internet companies, such as Kafka and Flume, which can meet the data collection and transmission requirements of hundreds of MB per second.
- Real-time calculation of data: The stream computing processing system receives real-time data continuously sent by the data acquisition system, performs analysis and calculation in real time, and feeds back real-time results.
- Real-time query service: The third stage of stream computing is real-time query service. The results obtained through the stream computing framework can be used for real-time query, display or storage by users. (Generally, the calculation results are pushed to the user in real time)
-
real-time computing architecture
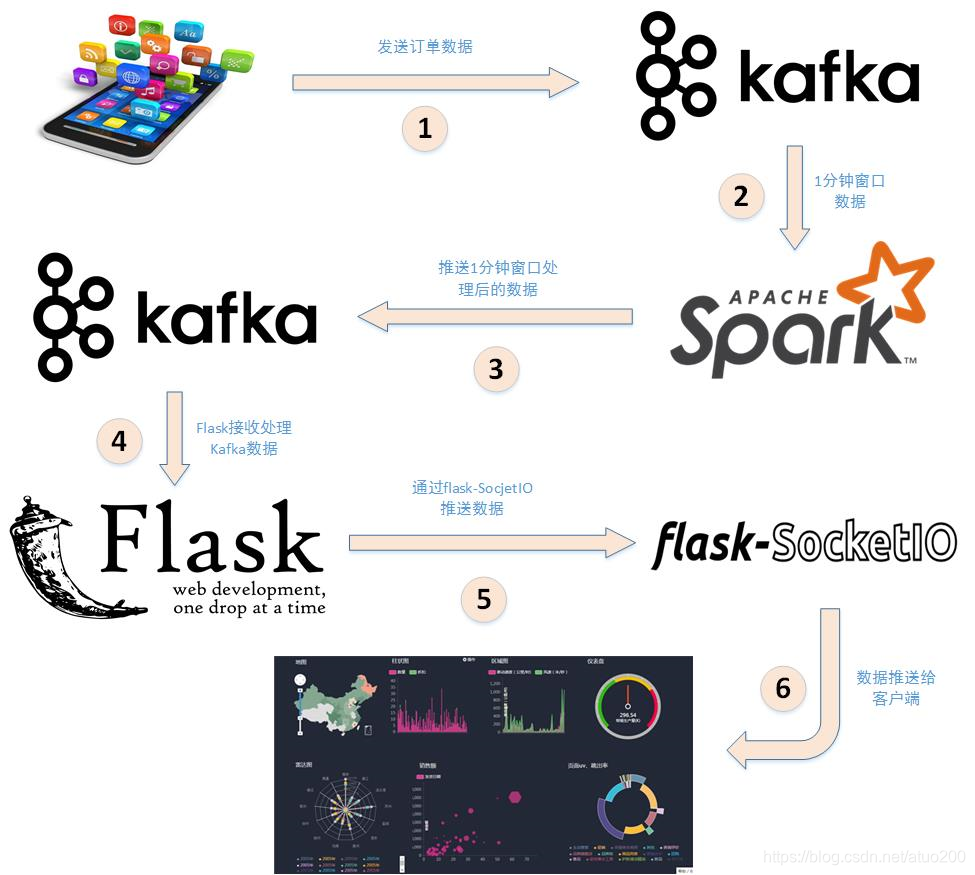
- Python reads the csv file and sends the data to kafka
- spark-streaming and kafka integration
- spark-streaming reads the data sent to kafka, performs real-time statistics, and pushes the statistical data to kafka
- Flask receives processed Kafka data in real time, pushes it to the client using flask-socketio for drawing display
-
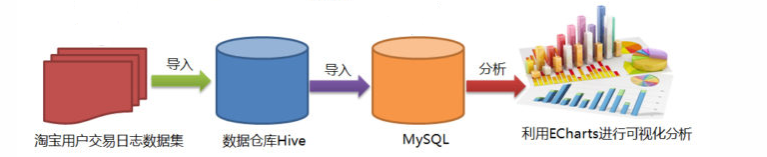
Batch Computing Architecture
- Import the data set to be analyzed into hive
- Hive writes HQL statements to analyze data in batches
- sqoop imports the analyzed results in hive into mysql
- Flask reads mysql data and uses echarts drawing for visual analysis
Specific steps
Flow calculation steps
The real-time sales volume of Taobao Double 11 in each province, the real-time age distribution of Taobao Double 11, the proportion of each shopping behavior of Taobao Double 11, and the daily activity of Taobao Double 11 are all calculated by streaming.
python connection kafka
In this step, python reads the csv file and connects to kafka to transfer the data
Third-party libraries such as pykafka and pandas need to be installed
pip install pykafka
python connection kafka code
# coding: utf-8
import pandas as pd
from pykafka import KafkaClient
import json


class DataHandle:
    def __init__(self):
        self.path = "data_format/user_log.csv"
        self.double11_path = "data_format/double11_user_log.csv"
        self.double11Buy_path = "data_format/double11Buy_user_log.csv"
    def select_double11AndBuy(self):
        data = pd.read_csv(self.path)
        data.drop_duplicates(inplace = True)
        # #筛选出双11那天的用户购买记录数据并保存
        buy_data = data.loc[data['action'] == 2]
        double11_buyData = buy_data[(buy_data["month"] == 11)&(buy_data["day"] == 11)]
        double11_buyData.to_csv(self.double11Buy_path,index=None)
        #筛选出双11的用户行为记录(点击、收藏、购买、关注)
        double11_data = data[(data["month"] == 11)&(data["day"] == 11)]
        double11_data.to_csv(self.double11_path,index = None)
        return 0
    def get_area_data(self):
        """获得双11那天的省份销量数据"""
        area_data = pd.read_csv(self.double11Buy_path)
        return area_data["province"]
    def get_transform_data(self):
        transform_data = pd.read_csv(self.double11_path)
        return transform_data["action"]
    def get_age_data(self):
        transform_data = pd.read_csv(self.double11Buy_path)
        return transform_data["age_range"]

class operateKafka:
    def __init__(self):
        self.myhosts = "Master:9092"
        self.client = KafkaClient(hosts=self.myhosts)

    def sendMessage(self, dataList,topic_name):
        topic = self.client.topics[topic_name]
        with topic.get_sync_producer() as producer:
            for data in dataList:
                mydict = str(data)
                python_to_json = json.dumps(mydict, ensure_ascii=False)
                producer.produce((str(python_to_json)).encode())

if __name__ == "__main__":
    dataHandle = DataHandle()
    myopKafka = operateKafka()
    dataHandle.select_double11AndBuy()
    #各个地区的销量
    myopKafka.sendMessage(dataHandle.get_area_data().values,"area_data2")
    myopKafka.sendMessage(dataHandle.get_transform_data().values,"action_class")
    myopKafka.sendMessage(dataHandle.get_age_data().values,"age_data")
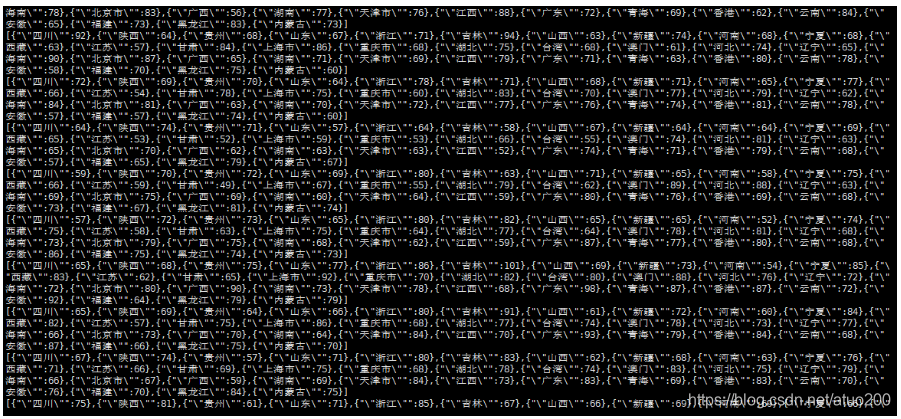
After executing the above code, you can test whether the data can be received on any node of the Kafka cluster, so as to judge whether the data is successfully transmitted to Kafka. (Take real-time provincial sales data as an example)
cd /usr/local/kafka/bin
./kafka-console-consumer.sh --bootstrap-server Master:9092 --topic area_data2 --from-beginning
spark-streaming assembly kafka
The basic principle of Spark Streaming is to split the real-time input data stream into time slices (second level), and then process each time slice data in a batch-like manner through the Spark engine, which can achieve second-level response, but cannot response in milliseconds. Spark Streaming is actually modeled on stream computing, not a real-time stream computing framework.
Kafka installation: kafka study notes , in order to adapt to the following spark-streaming-kafka integrated jar package, it is recommended to install kafka version 0.8 or 0.10 (depending on the situation, see the spark version).
Download the jar package of spark-streaming-kafka:
The integration of spark-streaming-kafka-0-8 can be downloaded for versions below spark2.3.0 (excluding 2.3.0): spark-streaming-kafka-0-8 , select the jar package corresponding to your scala and spark version to download
Spark2.3.0 and above (including 2.3.0) can download the integration of spark-streaming-kafka-0-10 and above: spark-streaming-kafka-0-10
Copy the downloaded jar package to /usr/local/spark/jars
In the /usr/local/spark/jars directory, create a new kafka directory, copy all the jar files in the libs directory of the kafka installation directory to the /usr/local/spark/jars/kafka directory,
cd /usr/local/kafka/libs
cp ./* /usr/local/spark/jars/kafka
Next, test whether the spark and kafka environments are connected
start spark-shell
cd /usr/local/spark/bin
 ./spark-shell --master spark://Master:7077
Introduce the following jar package in spark-shell
import org.apache.spark.streaming.kafka010._
If there is no error in importing the jar package, it means that the kafka and spark environments have been connected
Write and run spark-streaming program (real-time word frequency statistics)
The official API document of scala: https://www.scala-lang.org/api/2.11.12/#scala.package , the scala version corresponding to this document is 2.11.12, you can also go to: https://docs. scala-lang.org/api/all.html to find the API documentation corresponding to your own version of scala.
The official API documentation of spark: http://spark.apache.org/docs/2.4.5/api/scala/index.html#org.apache.spark.package , the scala version corresponding to this document is 2.11.12, also You can go to: http://spark.apache.org/docs/ to find the API documentation corresponding to your spark version.
Create project spark_connect_kafka
cd /usr/local/spark/mycode
mkdir spark_connect_kafka
cd spark_connect_kafka
mkdir -p src/main/scala
write scala code
vi kafkaCount.scala
package org.apache.spark.examples.streaming

import java.util.HashMap
import org.apache.kafka.clients.producer.{

    KafkaProducer, ProducerConfig, ProducerRecord}
import org.apache.kafka.clients.consumer.ConsumerConfig
import org.apache.kafka.common.serialization.StringDeserializer
import org.json4s._
import org.json4s.jackson.Serialization
import org.json4s.jackson.Serialization.write
import org.apache.spark.SparkConf
import org.apache.spark.streaming._
import org.apache.spark.streaming.Interval
import org.apache.spark.streaming.kafka010._

object KafkaWordCount {


  //数据格式化时需要
  implicit val formats = DefaultFormats
  def main(args: Array[String]): Unit={


    //判断参数输入是否齐全,当不齐全时退出程序
    if (args.length < 4) {


      System.err.println("Usage: KafkaWordCount <brokers> <groupId> <topics>")
      System.exit(1)
    }

    /* 输入的四个参数分别代表着
    * 1. brokers为要消费的topics所在的broker地址
    * 2. group为消费者所在的组
    * 3. topics该消费者所消费的topics
    * 4. topics2为要推送到kafka的数据分析结果的topics
    */
    //把输入的4个参数封装成数组
    val Array(brokers, groupId, topics,topics2) = args
    val sparkConf = new SparkConf().setAppName("KafkaWordCount")
    val ssc = new StreamingContext(sparkConf, Seconds(1))
    //把检查点写入本地磁盘文件,不写入hadoop不必启动hadoop
    ssc.checkpoint("file:///home/hadoop/data/checkpoint")

    //一个consumer-group可以消费多个topic,这里把topics按照“,”分割放进set里(虽然我们一般只是传进去一个topic)
    val topicsSet = topics.split(",").toSet

    val kafkaParams = Map[String, Object](
      ConsumerConfig.BOOTSTRAP_SERVERS_CONFIG -> brokers,
      ConsumerConfig.GROUP_ID_CONFIG -> groupId,
      "auto.offset.reset" -> "earliest",
      ConsumerConfig.KEY_DESERIALIZER_CLASS_CONFIG -> classOf[StringDeserializer],
      ConsumerConfig.VALUE_DESERIALIZER_CLASS_CONFIG -> classOf[StringDeserializer])
    //创建连接Kafka的消费者链接
    val messages = KafkaUtils.createDirectStream[String, String](
      ssc,
      LocationStrategies.PreferConsistent,
      ConsumerStrategies.Subscribe[String, String](topicsSet, kafkaParams))

	//获取输入的每行数据,将输入的每行用空格分割成一个个word(这里的代码逻辑是词频统计的逻辑)
    val lines = messages.map(_.value)
    val words = lines.flatMap(_.split(" "))

    // 对每一秒的输入数据进行reduce,然后将reduce后的数据发送给Kafka
    val wordCounts = words.map(x => (x, 1L))
        .reduceByKeyAndWindow(_+_,_-_, Seconds(3), Seconds(1), 3).foreachRDD(rdd => {


          if(rdd.count !=0 ){


               //创建kafka生产者配置文件(数据结构为HashMap,初始为空,不断添加配置)
               val props = new HashMap[String, Object]()
               props.put(ProducerConfig.BOOTSTRAP_SERVERS_CONFIG, "Master:9092")
               //key序列号方式
               props.put(ProducerConfig.VALUE_SERIALIZER_CLASS_CONFIG,
               "org.apache.kafka.common.serialization.StringSerializer")
               //value序列号方式
               props.put(ProducerConfig.KEY_SERIALIZER_CLASS_CONFIG,
               "org.apache.kafka.common.serialization.StringSerializer")
               //实例化一个Kafka生产者
               val producer = new KafkaProducer[String, String](props)
               //rdd.colect即将rdd中数据转化为数组,然后write函数将rdd内容转化为json格式
               val str = write(rdd.collect)
               //封装成Kafka消息,发送给相应的topics
               val message = new ProducerRecord[String, String](topics2, null, str)
               //给Kafka发送消息
               producer.send(message)
          }
      })
    //启动流式计算
    ssc.start()
    //等待直到计算终止
    ssc.awaitTermination()
  }
}
There is a sentence "reduceByKeyAndWindow( + , - , Seconds(1), Seconds(1), 1)", about the operations performed by the reduceByKeyAndWindow operator, you can click here: SparkStreaming sliding calculation window reduceByKeyAndWindow graphic description , to be more popular, you can put each The data within a window is regarded as fish in a pond. When the window slides with the specified sliding time, fish swim in and out every time the window slides. The number of fish, when a fish swims out, subtract the number of fish of this type swimming out, so as to count the number of each type of fish in each window.
This is done to reduce the amount of calculation, by only calculating how many fish swim out and how many fish swim in to get the number of fish in the current pond (window), without counting the entire pond (window), reducing the length of the window -( 2*sliding time) calculation amount.
Write sbt file
vi spark_connect_kafka.sbt
name := "spark_connect_kafka Project"
version := "1.0"
scalaVersion := "2.11.12"
libraryDependencies += "org.apache.spark" %% "spark-core" % "2.4.5"
libraryDependencies += "org.apache.spark"  % "spark-streaming_2.11" % "2.4.5"
libraryDependencies += "org.apache.spark" % "spark-streaming-kafka-0-10_2.11" % "2.4.5"
libraryDependencies += "org.json4s" %% "json4s-jackson" % "3.2.11"
Then compile and package the program
cd /usr/local/spark/mycode/spark_connect_kafka
sbt package
After the packaging is successful, you can write a running script, create a new startup.sh file in the /usr/local/spark/mycode/spark_connect_kafka directory, and enter the following content (take the parameters of real-time sales in each province as an example, and count other types of data , you need to change the topics consumed by spark-streaming and the topics produced)
/usr/local/spark/bin/spark-submit --driver-class-path /usr/local/spark/jars/*:/usr/local/spark/jars/kafka/* --class "org.apache.spark.examples.streaming/KafkaWordCount" /usr/local/spark/mycode/spark_connect_kafka/target/scala-2.11/spark_connect_kafka-project_2.11-1.0.jar Master:9092 2 area_data2 areaTopic2
Finally, in the /usr/local/spark/mycode/spark_connect_kafka directory, run the following command to execute the Spark Streaming program just written
sh startup.sh
Write and run spark-streaming program (cumulative word frequency statistics)
The cumulative word frequency statistics of spark-streaming are consistent with the real-time word frequency statistics of spark-streaming, except that the updateStateByKey operator is added to the scala code to accumulate the results of the last batch of calculations.
package org.apache.spark.examples.streaming

import java.util.HashMap
import org.apache.kafka.clients.producer.{

    KafkaProducer, ProducerConfig, ProducerRecord}
import org.apache.kafka.clients.consumer.ConsumerConfig
import org.apache.kafka.common.serialization.StringDeserializer
import org.json4s._
import org.json4s.jackson.Serialization
import org.json4s.jackson.Serialization.write
import org.apache.spark.SparkConf
import org.apache.spark.streaming._
import org.apache.spark.streaming.Interval
import org.apache.spark.streaming.kafka010._

object KafkaWordCount {


  implicit val formats = DefaultFormats//数据格式化时需要
  def main(args: Array[String]): Unit={


    if (args.length < 4) {


      System.err.println("Usage: KafkaWordCount <brokers> <groupId> <topics>")
      System.exit(1)
    }

    val Array(brokers, groupId, topics) = args
    val sparkConf = new SparkConf().setAppName("KafkaWordCount")
    val ssc = new StreamingContext(sparkConf, Seconds(1))
    ssc.checkpoint("file:///home/hadoop/data/checkpoint")

    val topicsSet = topics.split(",").toSet
    val kafkaParams = Map[String, Object](
      ConsumerConfig.BOOTSTRAP_SERVERS_CONFIG -> brokers,
      ConsumerConfig.GROUP_ID_CONFIG -> groupId,
      ConsumerConfig.KEY_DESERIALIZER_CLASS_CONFIG -> classOf[StringDeserializer],
      "auto.offset.reset"->"earliest",
      ConsumerConfig.VALUE_DESERIALIZER_CLASS_CONFIG -> classOf[StringDeserializer])

    val messages = KafkaUtils.createDirectStream[String, String](
      ssc,
      LocationStrategies.PreferConsistent,
      ConsumerStrategies.Subscribe[String, String](topicsSet, kafkaParams))

    val lines = messages.map(_.value)
    val words = lines.flatMap(_.split(" ")).map((_, 1))//将输入的每行用空格分割成一个个word
    //words.updateStateByKey为每个key维护一个state,并持续不断的更新该值
    val wordCounts = words.updateStateByKey(
      //每个单词每次batch计算的时候都会调用这个函数
      (values: Seq[Int], state: Option[Int]) => {


        //state.getOrElse(0)的含义是,如果该单词没有历史词频统计汇总结果,那么,就取值为0,如果有历史词频统计结果,就取历史结果
        var newValue = state.getOrElse(0)
        values.foreach(newValue += _)
        Option(newValue)
      }).foreachRDD(rdd => {


          if(rdd.count !=0 ){


               //创建kafka生产者配置文件(数据结构为HashMap,初始为空,不断添加配置)
               val props = new HashMap[String, Object]()
               props.put(ProducerConfig.BOOTSTRAP_SERVERS_CONFIG, "Master:9092")
               props.put(ProducerConfig.VALUE_SERIALIZER_CLASS_CONFIG,
               "org.apache.kafka.common.serialization.StringSerializer")
               props.put(ProducerConfig.KEY_SERIALIZER_CLASS_CONFIG,
               "org.apache.kafka.common.serialization.StringSerializer")

               val producer = new KafkaProducer[String, String](props)

               val str = write(rdd.collect)
               println("come rdd.collect")
               val message = new ProducerRecord[String, String](topics2, null, str)
               producer.send(message)
               println("haved send")
          }else{


               println("else")
          }
      })
	//启动流式计算
    ssc.start()
    //等待直到计算终止
    ssc.awaitTermination()
  }
}
View data statistics results on Kafka
Turn on consumption to see if you can consume the topics messages produced by the above spark-streaming program (take province statistics as an example)
./kafka-console-consumer.sh --bootstrap-server Master:9092 --topic areaTopic2 --from-beginning
Batch Calculation Steps
Product type ID used to count the top 20 Taobao Double 11 sales
Import data into hive
start hive
hive
Create corresponding tables based on dataset fields
create table double11Buy_table(
id int,
user_id int,
item_id int,
cat_id int,
merchant_id int,
brand_id int,
month int,
day int,
action int,
age_range int,
gender int,
province string
)
ROW FORMAT DELIMITED FIELDS TERMINATED BY ',';
Import Data
load data local inpath "root/Desktop/double11Buy_user_log.csv" into table double11Buy_table
Filter out the top 20 product type IDs
create table catCountAll as select cat_id,count(id) as count from double11Buy_table group by cat_id;
create table catCountTop20 as select * from catCountAll group by count desc limit 20;

sqoop export data to mysql
Create the corresponding database and data table on mysql
create database double11;
use double11;
create table catCount_table(
cat_id varchar(50),
count int
)
sqoop export data to mysql
sqoop export --connect jdbc:mysql://192.168.100.10:3306/double11 --username root --password root --table catCount_table --export-dir /user/hive/warehouse/catcounttop20 –fields-terminated-by "\001"
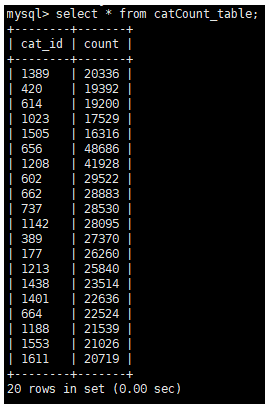
Check here in mysql, you can see that the data has been successfully imported
select * from catCount_table;
Taobao RFM user division
Select the user purchase record data before November to divide RFM users, and label each user. In this way, the effect of the marketing strategy of the double 11 event week in recalling users can be counted.
Here, since the data set does not contain the user's consumption amount, the user division is only divided from the two dimensions of R and F.
Only the user purchase records before November are selected for RFM user model modeling because: Double 11 is a special day, almost all users have consumption records on Double 11, and the data records in the data set are only recorded to 11. On November 12, if the data including November data is selected for RFM user model modeling, the R values of almost all users will tend to be consistent, and the differences between users in the R dimension will be smoothed out.
import pandas as pd
import datetime

data = pd.read_csv("data_format/double11Buy_user_log.csv")
data["time"] = data.apply(lambda item:"2015-"+str(item["month"])+"-"+str(item["day"]),axis=1)
data["time"] = pd.to_datetime(data["time"],format="%Y-%m-%d")
data["r_value_single"] = data["time"].apply(lambda x:(datetime.datetime.strptime('2015-11-1','%Y-%m-%d')-x).days)

r_value = data.groupby(['user_id']).r_value_single.min()
f_value = data.groupby(['user_id']).size()    # 按每个用户id累积订单数量作为f值

rfm_df = pd.concat([r_value, f_value], join='outer', axis=1)
rfm_df.columns = ["r_value","f_value"]

rfm_df["user_id"] = rfm_df.index
rfm_df["r_score"] = (rfm_df["r_value"] > rfm_df["r_value"].mean())*1
rfm_df["f_score"] = (rfm_df["f_value"] > rfm_df["f_value"].mean())*1

def put_label(item):
    return str(item["r_score"])+str(item["f_score"])

rfm_df["class_index"] = rfm_df.apply(put_label,axis=1)
def transform_user_class(x):
    if x == "11":
        user_label = "重要价值用户"
    elif x == "01":
        user_label = "重要深耕用户"
    elif x == "10":
        user_label = "重要唤回用户"
    else:
        user_label = "流失用户"
    return user_label

rfm_df["user_class"] = rfm_df["class_index"].apply(transform_user_class)
print(rfm_df.head(20))
user_count = rfm_df["user_class"].value_counts()
user_count.to_json('static/user_count.json')
Flask-SocketIO pushes data in real time
After obtaining the required data in the flow calculation step and batch calculation step, you can use flask to read the data in kafka and mysql, use flask-socketio to push the data to the client in real time, and the client receives the data in real time through socket.io.js , using echarts for dynamic drawing display
Flask application code, one main thread and three sub-threads
import json
import time
from flask import Flask, render_template,jsonify
from flask_socketio import SocketIO
from pykafka import KafkaClient
from sqlalchemy import create_engine
import pandas as pd


app = Flask(__name__)
app.config['SECRET_KEY'] = 'secret!'
socketio = SocketIO(app)
thread = None
thread2 = None
thread3 = None

# 实例化一个consumer,接收topic的消息
client = KafkaClient(hosts="Master:9092")
# # 确定使用的topic
topic = client.topics['areaTopic2']
consumer = topic.get_simple_consumer(
    consumer_group="consumer",
    reset_offset_on_start=True
)

topic2 = client.topics['actionClass']
consumer2 = topic2.get_simple_consumer(
    consumer_group="consumer2",
    reset_offset_on_start=True
)

topic3 = client.topics['ageData']
consumer3 = topic3.get_simple_consumer(
    consumer_group="consumer3",
    reset_offset_on_start=True
)

def age_background_thread():
    for msg in consumer3:
        data_json = msg.value.decode('utf8')
        data_list = json.loads(data_json)
        chart_data = []
        for data in data_list:
            if list(data.keys())[0] == '"0"':
                key = "未知"
            elif list(data.keys())[0] == '"1"':
                key = "小于18岁"
            elif list(data.keys())[0] == '"2"':
                key = "18到24岁"
            elif list(data.keys())[0] == '"3"':
                key = "25到29岁"
            elif list(data.keys())[0] == '"4"':
                key = "30到34岁"
            elif list(data.keys())[0] == '"5"':
                key = "35到39岁"
            elif list(data.keys())[0] == '"6"':
                key = "40到49岁"
            else:
                key = "大于49岁"
            chart_data.append({


                "name":key,
                "value":list(data.values())[0]
            })
        socketio.emit('age_message',chart_data)
        time.sleep(1)


def action_background_thread():
    for msg in consumer2:
        chart_data = []
        data_json = msg.value.decode('utf8')
        data_list = json.loads(data_json)
        for data in data_list:
            if list(data.keys())[0] == '"0"':
                key = "点击"
            elif list(data.keys())[0] == '"1"':
                key = "加入购物车"
            elif list(data.keys())[0] == '"2"':
                key = "购买"
            else:
                key = "关注"
            chart_data.append({


                "value":list(data.values())[0]/100,
                "name":key
            })

        socketio.emit('action_message',chart_data)
        time.sleep(1)

def area_background_thread():
    for msg in consumer:
        data_json = msg.value.decode('utf8')
        data_list = json.loads(data_json)
        chart_data = []
        for data in data_list:
            chart_data.append({


                "name":list(data.keys())[0].replace('"',""),
                "value":list(data.values())[0]
            })
        socketio.emit('area_message',chart_data)
        time.sleep(1)

#客户端发送age_connect事件时的处理函数
@socketio.on('age_connect')
def age_connect(message):
    global thread3
    if thread3 is None:
        # 单独开启一个线程给客户端发送数据
        thread3 = socketio.start_background_task(target=age_background_thread)

@socketio.on('area_connect')
def area_connect(message):
    global thread
    if thread is None:
        # 单独开启一个线程给客户端发送数据
        thread = socketio.start_background_task(target=area_background_thread)
    socketio.emit('connected', {

    'data': 'Connected'})

#客户端发送test_connect事件时的处理函数
@socketio.on('action_connect')
def action_connect(message):
    global thread2
    if thread2 is None:
        thread2 = socketio.start_background_task(target=action_background_thread)

@app.route('/catsql_data',methods = ["GET","POST"])
def get_place_data():
    conn = create_engine("mysql+pymysql://root:root@Master/double11?charset=utf8")
    result = pd.read_sql("select * from catCount_table",con=conn)
    data = list(result.apply(lambda item:{

    "name":item["cat_id"],"value":item["count"]},axis = 1))
    return jsonify(data)

@app.route("/")
def handle_itemClassMes():
    return render_template("index.html")


if __name__ == '__main__':
    socketio.run(app,debug=True,host='127.0.0.1',port=5000)
Echarts dynamic drawing
<!DOCTYPE html>
<html lang="en">
<head>
<meta charset="UTF-8">
<title>淘宝双11实时大屏数据分析</title>
<script src="https://cdn.bootcdn.net/ajax/libs/jquery/1.10.0/jquery.min.js"></script>
<script type="text/javascript" src="//cdn.bootcss.com/socket.io/1.5.1/socket.io.min.js"></script>
<script src="https://cdn.jsdelivr.net/npm/[email protected]/dist/echarts.min.js"></script>
<script type="text/javascript" src="../static/china.js"></script>
<script src="https://echarts-www.cdn.bcebos.com/zh/asset/theme/macarons.js"></script>
<script src="../static/esl.js"></script>
<style type="text/css">
body {
background-image: url("/static/timg.jpg");
}
h1 {
color: #fff;
}
#action_box,
#user_box,
#dailylife_box,
#cat_box,
#area_box,
#age_box {
background-color: rgba(230, 255, 255, 0.945)!important;
display: inline-block;
}
.contain {
text-align: center;
}
.public {
width: 600px;
height: 500px;
padding: 5px;
border: 1px solid #ccc;
box-shadow: 0 0 3px #aaa inset;
}
.empty {
height: 30px;
}
</style>
</head>
<body>
<h1 align="center">淘宝双11实时大屏数据分析</h1>
<div class="empty"></div>
<div class="contain">
<div id="action_box" class="public"></div>
<div id="user_box" class="public"></div>
<div id="age_box" class="public"></div>
<div id="dailylife_box" class="public"></div>
<div id="cat_box" class="public"></div>
<div id="area_box" class="public"></div>
</div>
</body>
<script>
var action_chart = echarts.init(document.getElementById('action_box'), "macarons");
var socket = io.connect('http://' + document.domain + ':' + location.port);
//客户端发起链接
socket.on('connect', function() {
socket.emit('action_connect', {
data: 'I\'m connected(action)!'
});
socket.emit('age_connect', {
data: 'I\'m connected(age)!'
});
socket.emit('area_connect', {
data: 'I\'m connected!'
});
socket.emit('action_connect', {
data: 'I\'m connected(daily)!'
});
});
var update_mychart = function(res) {
var option = {
title: {
text: '淘宝双11各购物行为漏斗图',
x: 'center'
},
tooltip: {
trigger: 'item',
formatter: "{a} <br/>{b} : {c}人"
},
toolbox: {
feature: {
dataView: {
readOnly: false
},
restore: {
},
saveAsImage: {
}
}
},
series: [{
name: '漏斗图',
type: 'funnel',
left: '10%',
top: 60,
bottom: 40,
width: '80%',
min: 0,
max: 100,
minSize: '0%', //数据最小值 min 映射的宽度,默认为0%
maxSize: '100%', //绝对的像素大小,也可以是相对布局宽度的百分比
sort: 'descending',
gap: 2,
label: {
show: true,
position: 'inside'
},
labelLine: {
length: 10,
lineStyle: {
width: 1,
type: 'solid'
}
},
itemStyle: {
borderColor: '#fff',
borderWidth: 1
},
emphasis: {
label: {
fontSize: 20
}
},
data: res
}]
};
action_chart.setOption(option);
};
socket.on('action_message', function(message) {
update_mychart(message)
});
var myChart = echarts.init(document.getElementById('user_box'), 'macarons');
$.get('../static/user_count.json', function(data) {
dataAxis = Object.keys(data);
dataValue = Object.values(data);
// 指定图表的配置项和数据
var option2 = {
title: {
text: '淘宝用户类型分布',
x: "center"
},
tooltip: {
},
xAxis: {
data: dataAxis
},
yAxis: {
},
series: [{
name: '用户等级',
type: 'bar',
data: dataValue
}]
};
// 使用刚指定的配置项和数据显示图表。
myChart.setOption(option2);
});
var age_chart = echarts.init(document.getElementById('age_box'), "macarons");
var update_agechart = function(res) {
var option3 = {
title: {
text: '淘宝双11买家年龄分布',
x: 'center'
},
tooltip: {
trigger: 'item',
formatter: '{a} <br/>{b} : {c} ({d}%)'
},
series: [{
name: '年龄分布',
type: 'pie',
radius: '55%',
center: ['50%', '60%'],
data: res,
emphasis: {
itemStyle: {
shadowBlur: 10,
shadowOffsetX: 0,
shadowColor: 'rgba(0, 0, 0, 0.5)'
}
}
}]
};
age_chart.setOption(option3);
};
socket.on('age_message', function(message) {
update_agechart(message)
});
var area_chart = echarts.init(document.getElementById('area_box'), "macarons");
var update_areachart = function(res) {
var option4 = {
title: {
text: '淘宝双11各省份实时销量',
x: 'center'
},
tooltip: {
trigger: 'item'
},
dataRange: {
min: 0,
max: 150,
x: 'left',
y: 'center',
color: ['#006edd', '#e0ffff'],
text: ['高', '低'],
calculable: true
},
series: [{
name: '数据',
type: 'map',
mapType: 'china',
roam: true,
label: {
normal: {
show: true //省份名称
},
emphasis: {
show: true
}
},
data: res
}]
};
area_chart.setOption(option4);
};
socket.on('area_message', function(message) {
update_areachart(message)
});
var catChart = echarts.init(document.getElementById('cat_box'), "macarons");
$.get('/catsql_data', function(data) {
var chart_data = data;
var option5 = {
title: {
text: '淘宝双11商品类别销量Top20',
x: "center"
},
tooltip: {
trigger: 'item',
formatter: "{b}: {c}"
},
toolbox: {
show: true,
feature: {
mark: {
show: true
},
dataView: {
show: true,
readOnly: false
},
restore: {
show: true
},
saveAsImage: {
show: true
}
}
},
calculable: false,
series: [{
name: '矩形树图',
type: 'treemap',
data: chart_data
}]
};
catChart.setOption(option5)
})
var dailyChart = echarts.init(document.getElementById('dailylife_box'), 'macarons');
var update_dailychart = function(res) {
dataAxis = []
dataValue = []
for (var item in res) {
dataAxis.push(res[item]["name"])
dataValue.push(Math.round(res[item]["value"] * 100))
}
console.log(dataValue)
var option6 = {
title: {
text: '淘宝双11日活量',
x: "center"
},
xAxis: {
type: 'category',
data: dataAxis
},
yAxis: {
type: 'value'
},
series: [{
data: dataValue,
type: 'bar',
label: {
show: true,
position: 'inside'
},
showBackground: true,
backgroundStyle: {
color: 'rgba(220, 220, 220, 0.8)'
}
}]
};
dailyChart.setOption(option6)
}
socket.on('action_message', function(message) {
update_dailychart(message)
});
</script>
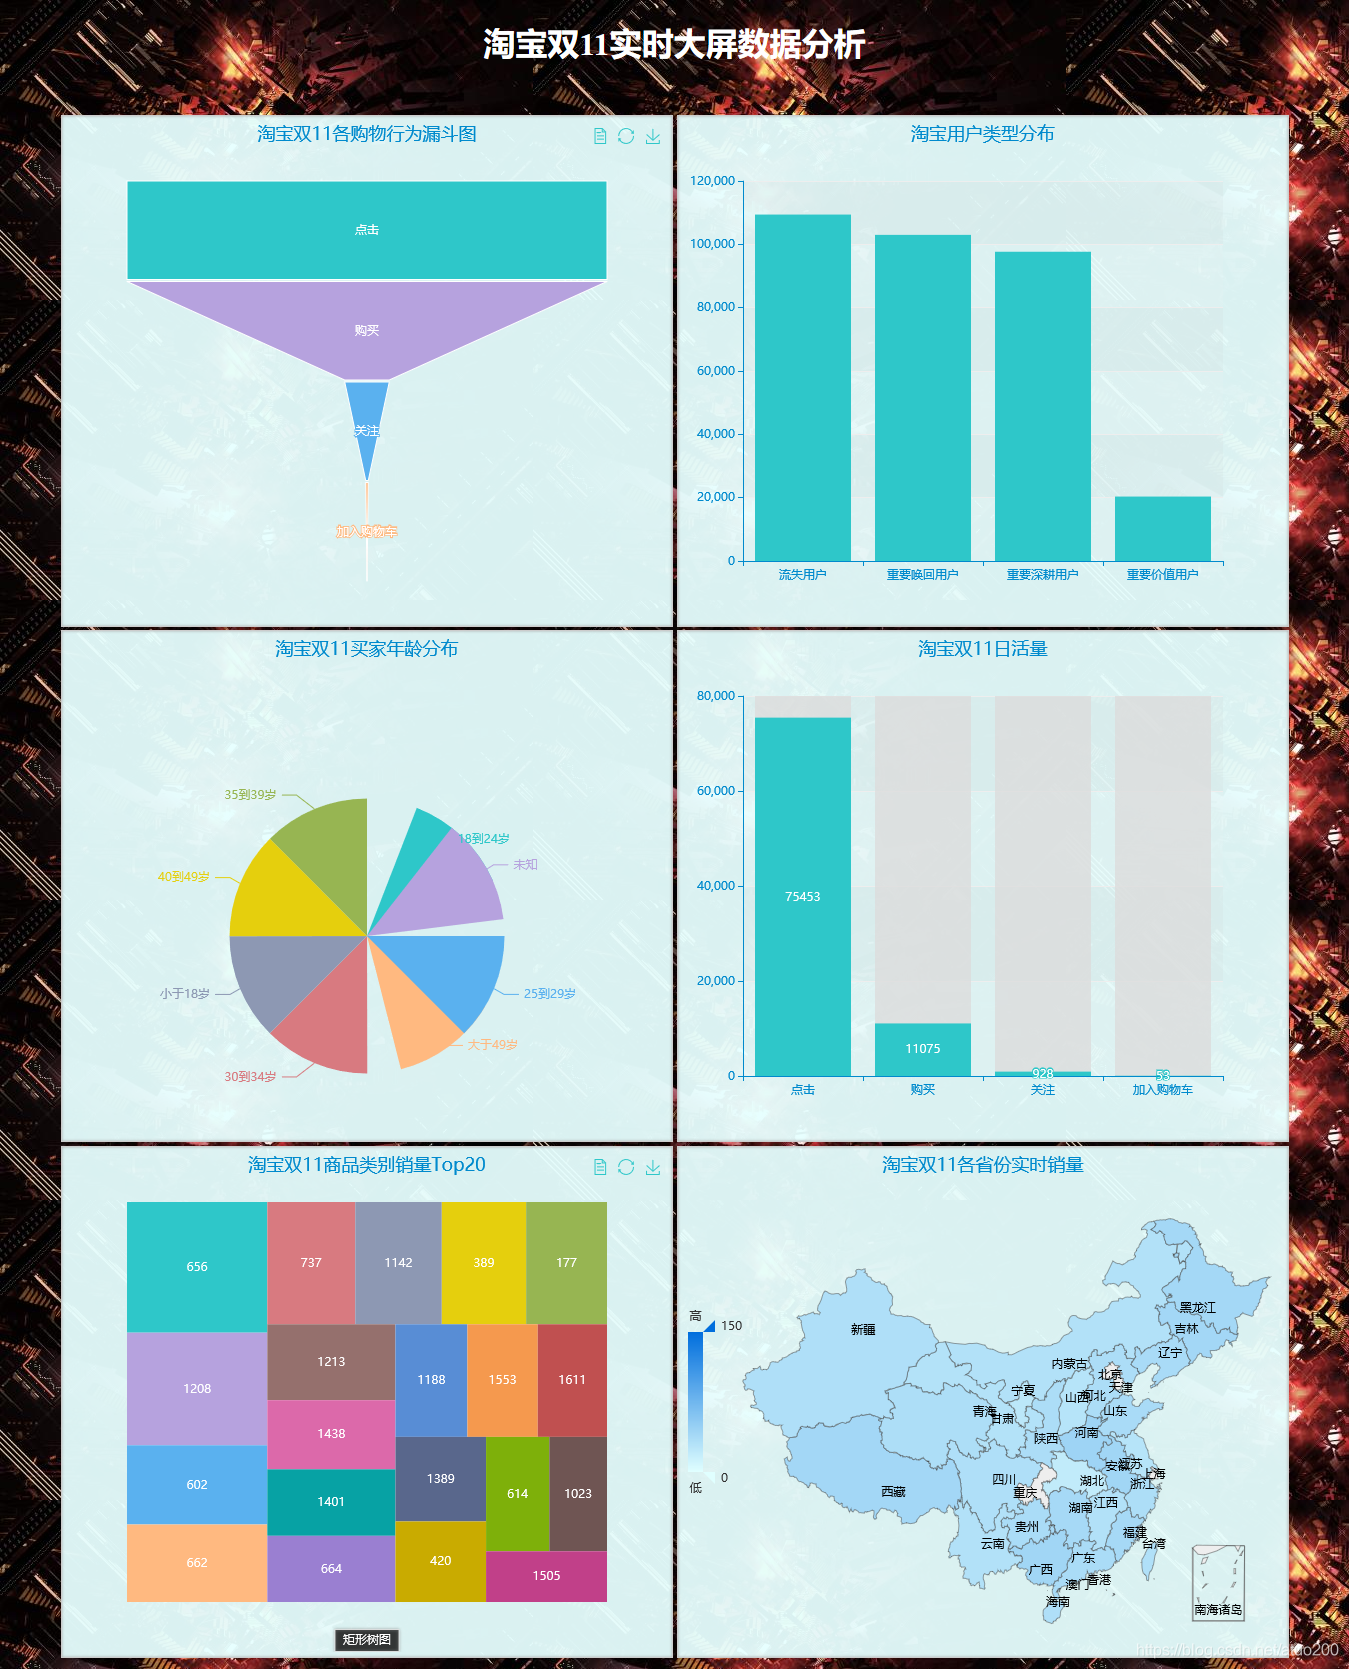
</html>
project results