Use xdebug to debug PHP in vscode—absolutely solve the problem that remote xdebug cannot debug
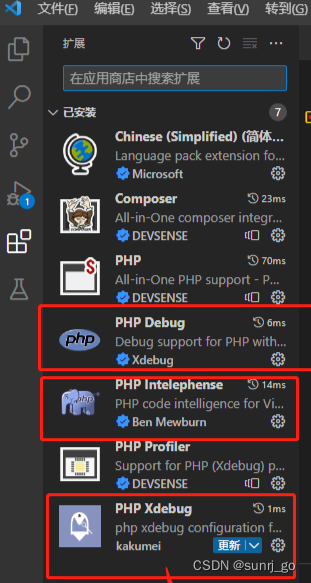
1. Vscode plugin installation
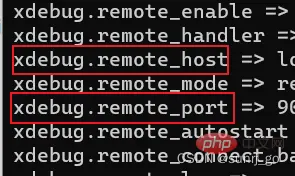
2. Check and install the xdebug extension of php
php -m

3. Modify the configuration information of xdebug in php.ini on the remote host
vi php.ini
4. Modify the launch.json file in vscode
{


    // Use IntelliSense to learn about possible attributes.
    // Hover to view descriptions of existing attributes.
    // For more information, visit: https://go.microsoft.com/fwlink/?linkid=830387
    "version": "0.2.0",
    "configurations": [
        {


            "name": "Launch built-in server and debug",
            "type": "php",
            "request": "launch",
            "runtimeArgs": [
                "-S",
                "localhost:8000",
                "-t",
                "."
            ],
            "port": 9003,
            "serverReadyAction": {


                "action": "openExternally"
            }
        },
        {


            "name": "Debug current script in console",
            "type": "php",
            "request": "launch",
            "program": "${file}",
            "cwd": "${fileDirname}",
            "externalConsole": false,
            "port": 9003
        },
        {


            "name": "Listen for Xdebug",
            "type": "php",
            "request": "launch",
            "port": 9003,
            "pathMappings": {

    "/com/web": "${workspaceFolder}/aaa"}
        }
    ]
}
illustrate:
- "port" is the port that the local IDE will listen to when debugging, and this port is used when the remote xdebug communicates with vscode. This port must be the same as the configured port of xdebug configured in php.ini
Key point:
Sometimes, remote debugging will encounter obvious xdebug, but the debugging can never enter the breakpoint, then you must configure pathMappings. The specific configuration is as shown in the example.
illustrate:
- Native code directory structure
 tree

 结果:
├── .vscode
    ├── launch.json
├── aaa
	├── composer.json
	├── composer.lock
	├── Dockerfile
	├── README.md
	├── src
	│   ├── Controllers
	│   ├── Global
	│   ├── Models
	│   ├── module
	│   ├── resource.ini
	│   └── Utils
	├── vendor
Code path for remote environment:
├── com
	├── web
		├── composer.json
		├── composer.lock
		├── Dockerfile
		├── README.md
		├── src
		│   ├── Controllers
		│   ├── Global
		│   ├── Models
		│   ├── module
		│   ├── resource.ini
		│   └── Utils
		├── vendor