Table of contents
Radar chart (radar)
need

[1] Copy case
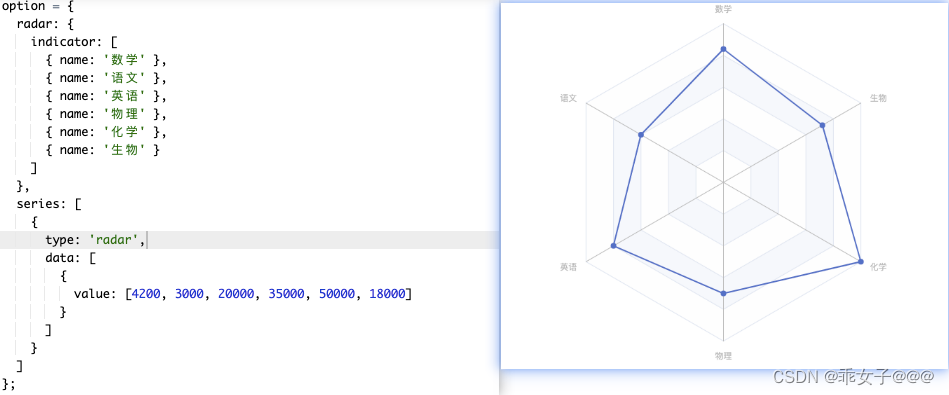
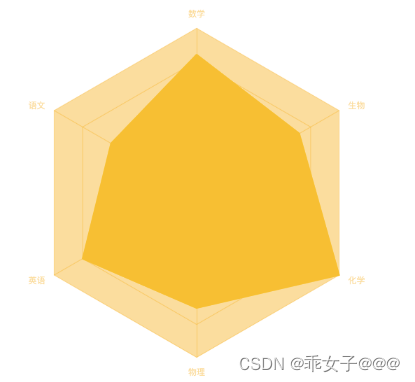
As shown above, first copy the simplest radar chart
[2] Uniform tone
Cartesian coordinates use the xAxis/yAxis configuration item, but the radar chart uses
radarthe configuration item to configure the coordinate system.
| configuration item | annotation | area |
|---|---|---|
| splitNumber | The number of segments of the indicator axis, the default is 5 segments | |
| splitArea | Configure the settings related to the area separated by the indicator | 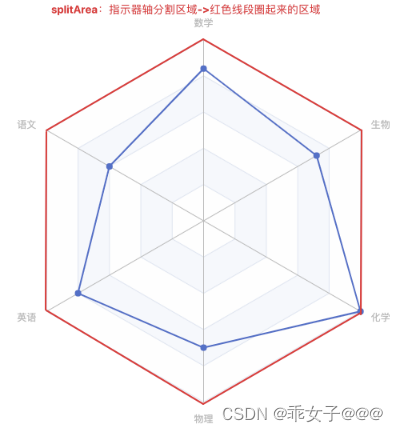 |
| splitLine | Dividing line related settings |  |
| axisLine | Coordinate axis related settings |  |
Data polylines, regions, etc. are configured
seriesin
| configuration item | annotation | area |
|---|---|---|
| symbol | Is there an inflection point | |
| itemStyle | The style of the polyline inflection mark | 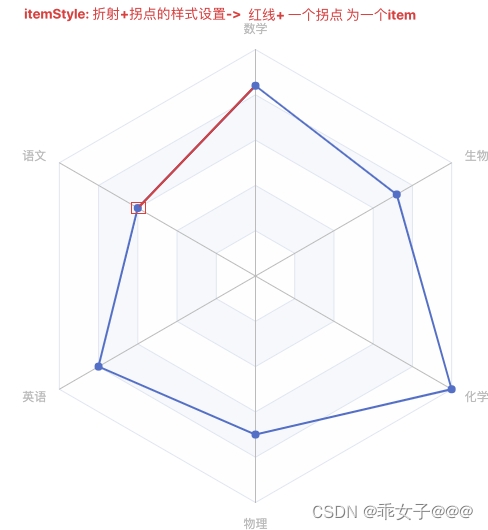 |
| lineStyle | The style of the polyline flag | The difference from itemStyle is that itemStlye includes inflection points |
| areaStyle | area fill style | 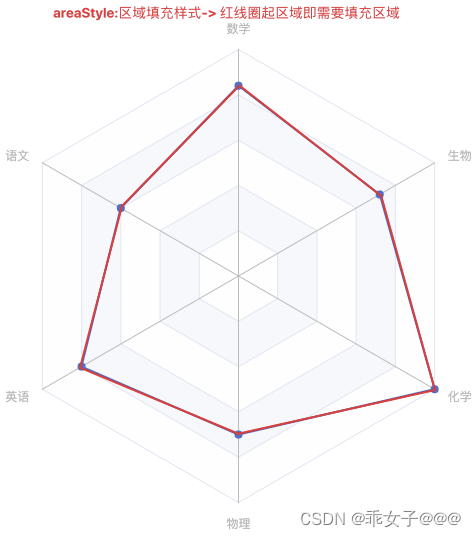 |
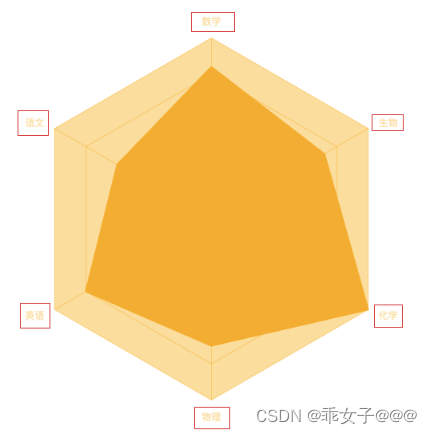
Adjust the color of the radar chart to be unified as follows
option = {


  radar: {


    splitArea: {


      areaStyle: {

     color: 'rgba(255, 175, 0,.4)' }
    },
    axisLine: {


      lineStyle: {

     color: 'rgba(255, 175, 0,.4)' }
    },
    splitLine: {


      lineStyle: {

     color: 'rgba(255, 175, 0,.4)' }
    },
    indicator: [
      {

     name: '数学' },{

     name: '语文' },{

     name: '英语' },
      {

     name: '物理' },{

     name: '化学' }, {

     name: '生物' }
    ]
  },
  series: [
    {


      type: 'radar',
      symbol:'none',
      lineStyle: {

     color: "#FEAE01" },
      areaStyle:{


        color:'#FEAE01',
        opacity:1 //默认存在透明度
      },
      data: [{

    value: [4200, 3000, 20000, 35000, 50000, 18000]}
      ]
    }
  ]
};
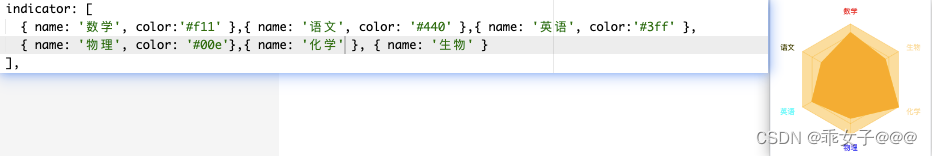
[3] Configuration items
As shown in the above configuration item, the default value of the configuration item is indicatorthe name attribute of the array element; the default color of the configuration item is the same as the color of the coordinate axis.
-
Modify the text color: If you only modify the text color of the configuration item, you can modify it through the color attribute of the indicator array element.
-
Modify text content: You can use
axisNameattributes to modify text content. The axisName has a formatter attribute to adjust the text style. Note that配置项中的formatter不识别html标签!.
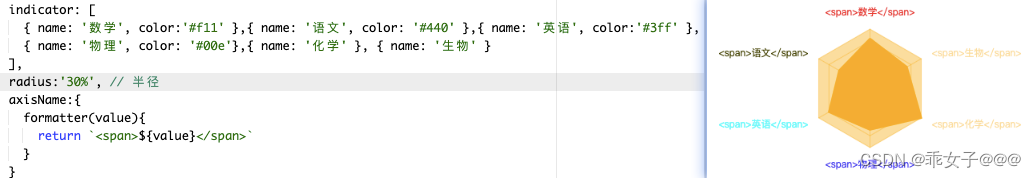
As shown above, the formatter here does not recognize html tags, and will recognize html tags as ordinary stringsIf you want to set the style, you can use
richthe paratext editor
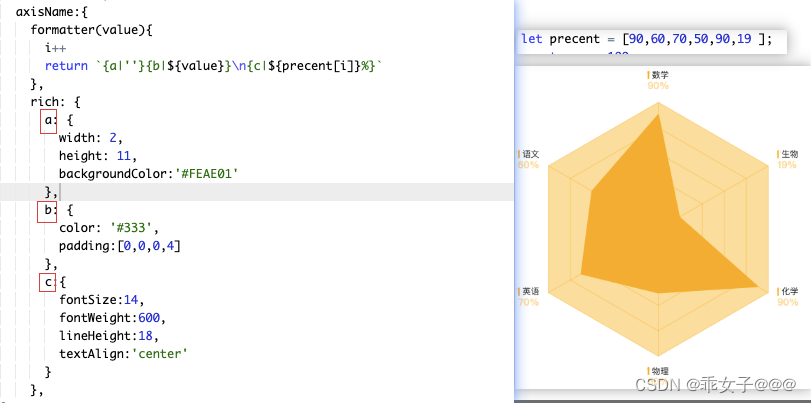
As shown above, you can set three different styles.Since the formatter in the radar configuration item can only get the name value of the configuration item without other values, I set the occupation percentage as an array and fill in the data
遍历.
Implementation code
let precent = [90,60,70,50,90,19 ];
const max = 100
let i = -1
option = {
  radar: {
    splitArea: {
      areaStyle: { color: 'rgba(255, 175, 0,.4)' } // 由于设置透明度会造成背景穿透
    },
    axisLine: {
      lineStyle: { color: 'rgba(255, 175, 0,.4)' }
    },
    splitLine: {
      lineStyle: { color: 'rgba(255, 175, 0,.4)' }
    },
    indicator: [
      { name: '数学', max}, // 设置max,否则展示比例可能存在展示不正确的存在
      { name: '语文', max },
      { name: '英语', max},
      { name: '物理',  max },
      { name: '化学',  max },
      { name: '生物',  max }
    ],
    radius:'58%', // 半径
    axisName:{
      formatter(value){
        i++
        return `{a|''}{b|${value}}\n{c|${precent[i]}%}`
      },
      rich: {
        a: {
          width: 2,
          height: 11,
          backgroundColor:'#FEAE01'
        },
        b: {
          color: '#333',
          padding:[0,0,0,4]
        },
        c:{
          fontSize:14,
          fontWeight:600,
          lineHeight:18,
          textAlign:'center'
        }
      },
  },
  },
  series: [
    {
      type: 'radar',
      symbol:'none',
      lineStyle: { color: "#FEAE01" },
      areaStyle:{
        color:'#FEAE01',
        opacity:1 //默认存在透明度
      },
      data: [{value: [90,60,70,50,90,19]}
      ]
    }
  ]
};