Article Directory
Preface;
InVSthe environment, we can not only write code, compile, and run executable programs, but also debug the generated executable programs. In this chapter, we will learn how toLinuxdebug in the environment.
1. Preface
To debug, you must first generate an executable program, so first prepare a simple C program:
touch Test.c
vim Test.c
//C代码:
 #include<stdio.h>

int accumulate(int n)
{


	printf("Start\n");
	int sum = 0;
	for (int i = 0; i <= n; i++)
	{


		sum += i;
	}
	printf("End\n");
	return sum;
}

 int main()
 {


	 int n = 100;
	 int ret = accumulate(n);
	 printf("%d\n", ret);
	 return 0;
 }
To review make/Makefilethe use of:
touch Makefile
vim Makefile
//Makefile的内容
Test:Test.c
	gcc Test.c -o Test -std=c99
.PHONE:clean
clean:
	rm -f Test
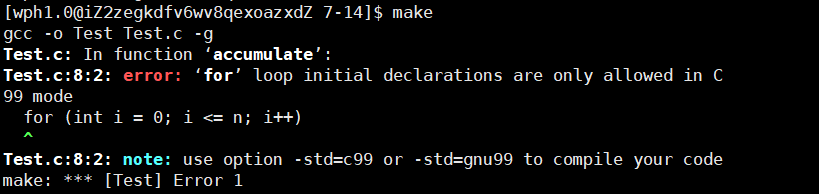
- The meaning of the option here
-std=c99is:forthe operation of defining the variable i in the loop isc99only supported, so it needs to be declared at compile time. Otherwise, the following error will appear:
2. Install the gdb debugger
In Linux, we use gdbto debug; switch root identity or use sudothe command to install:
yum install -y gdb
3. Enter debugging
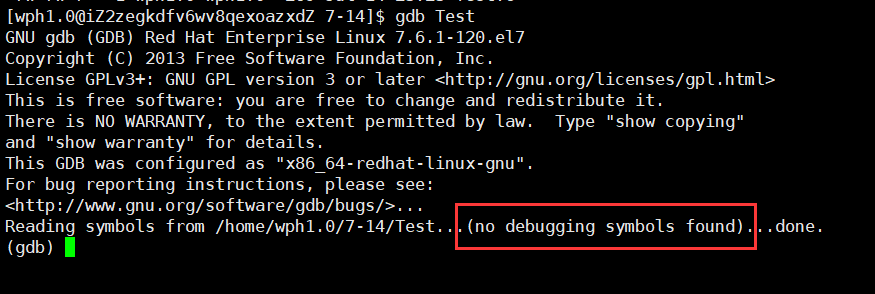
After the executable file ( Test) is generated, use the command gdb[file name] to enter debugging.
gdb Test
- If you directly
Testdebug the file, there will be an error report without debugging information, as shown in the figure below:
- The reason is that there are two ways to publish a program:
releaseanddebug.gcc/g++The executable program generated by default isreleaseversion. And we all know that debugging is aimed atdebugthe version of the executable program, because onlydebugthe version contains debugging information.- When
gcc/g++compiling,-gyou can select the generateddebugversionTestfile by adding options (in order to distinguish, you candebugadd a suffix to the version file-debug, andreleaseadd a suffix to the version-release).
Amended Makefilefile:
Test-debug:Test.c
	gcc Test.c -o Test-debug -g -std=c99

.PHONE:clean
clean:
	rm -f Test
Regenerate the file Test-debugand enter debug:
make
gdb Test-debug
4. Debug related instructions
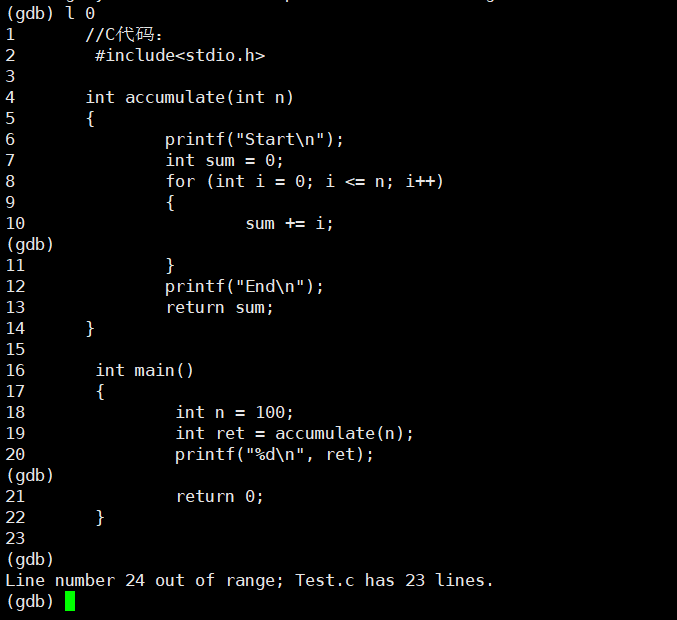
gdb[文件名]: enter debuggingCtrl + dorquit: exit debugist+ [行号]orl + [行号](short form): Displays the source code of an executable program. Start displaying from the line number, and display 10 lines at a time
(After using this command for the first time, you can directly press Enter to continue executing the previous command for convenience. Other commands have the same effect)
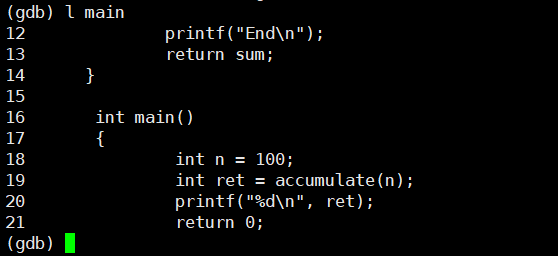
list + [函数名]orl + [函数名]: display the source code of a function
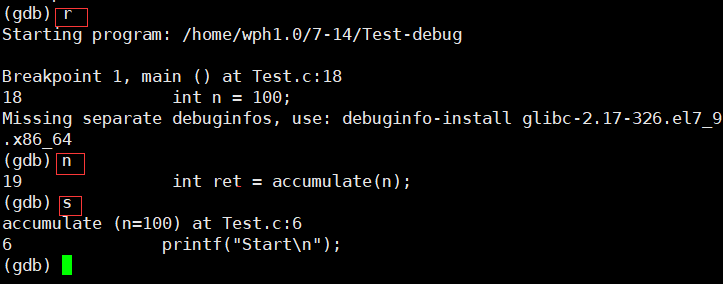
runOrr: run the program (run until the end of the program if no breakpoint is set)
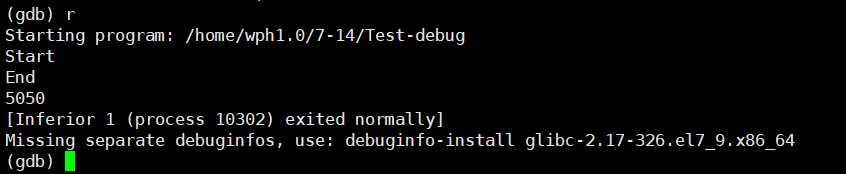
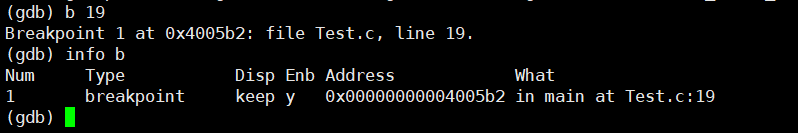
break + [行号]Orb + [行号]: set a breakpoint on a certain lineinfo + bView breakpoint information
break + [函数名]: Set a breakpoint at the beginning of a functiondelete/d breakpoint n: delete the breakpointnnumbered

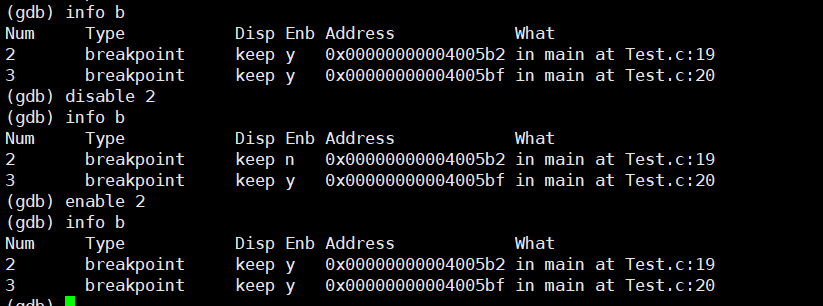
delete/d breakpoint: remove all breakpointsdisable breakpoint: disable breakpoint
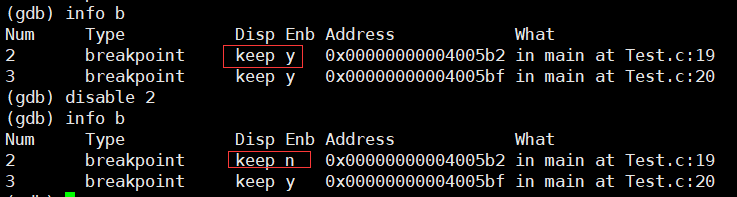
enable breakpoint: enable breakpoint
nextorn: process by process (vsinF10)stepors: statement by statement (vsinF11)
finish: Execute until the current function returns, then stop and wait for the commandprintOrp: print the value of the expression, the value of the variable can be modified or the function can be called through the expressionp + 变量: print variable valueset + 变量: modify the value of the variablecontinueorc: run from the current position until the next breakpointdisplay + 变量名: Trace to view a variable, displaying its value each time you stopundisplay: untrack those variables that were previously setuntil + 行号: jump to a line to executebreaktraceOrbt: view function calls and parameters at all levelsinfo + 变量 + locals: View the value of the local variable of the current stack frame;
gdbCommonly used commands are summarized here.
When learning gdb, we should VScompare it with debugging in the environment to understand better, for example:
requivalentvstoF5bEquivalentvsto setting a breakpoint innequivalentvstoF10sF11Equivalent to (at the function) in vsp/displayEquivalent tovssurveillance in
gdbThe instructions in are generally abbreviated, for example:
list——lrun——rbreak——bdelete——dbreakpoint——bnext——nstep——sprint——pcontinue——cbreaktrace——bt
…
This is the end of this article, the code text is not easy, please support me a lot! !