1 Introduction
If our game runs slowly, freezes or even freezes, we know that the game has a performance problem. Before we try to fix the problem, we first need to know what is causing the problem. Different problems require different solutions. If we try to guess the question or make adjustments to the game based on other items, it can be a waste of time and make the problem even worse.
At this time, we need to analyze the problem. Profiling is the measurement of various aspects while running our game. Using profiling tools, when our game is running, we can see what is happening behind the screen and use this information to trace the cause of performance problems. By looking at profiling tools, we can measure the results of our modifications so we can tell if our fixes are effective.
In this article, we will:
- Use the Profiler tool that comes with Unity to collect game data with poor performance.
- Analyze this data and use the results of the analysis to track down performance issues.
- Provides links to fixes for these issues.
Making a game run smoothly is a balancing act. We may have to modify and validate the game several times before we get the desired result. Knowing how to use profiling tools to analyze our problems means we can determine what the problem is with the game and know what to do next.
2 friendly reminder
This article will help us track down where Unity games run slowly, freeze or even freeze. If we had other issues like crashes or image anomalies, this post might not be of much help. If there are some problems in our game that are not mentioned in this article, you can try to search the Unity Manual, Unity Community or Unity Answers.
If we are not familiar with the Profiler window or how to use the Profiler, it is recommended to read this article first .
3 Introduction to Gaming Performance
Frame rate is a measure of game performance. Frames in games are similar to frames in animation. It's just the game screen drawn to the screen. Drawing a frame to the screen is called rendering a frame. Frame rate or the speed at which frames are rendered is measured in per second ( FPS ).
Most games these days aim for 60 FPS. Usually 30+ FPS is considered acceptable, especially for some games that do not require high reaction speed, such as puzzle or adventure games. Some games have relatively high frame rate requirements, such as VR, 90 FPS will be rejected. When the frame rate is below 30 FPS, the player experience is usually poor, the image may freeze, and the operation may be sluggish. However, not only speed is important, but frame rate stability is also important. The change in frame rate is obvious to the player. An unstable framerate is usually worse than a stable game with a low framerate.
Although frame rate is often mentioned when talking about game performance, it is more useful to consider the number of milliseconds it takes to render a frame when trying to improve game performance. There are two reasons, firstly this is a more accurate measurement method. When we try to improve the performance of our games, every millisecond counts towards our goals. Second, the relative change in frame rate means that different scales have different frame rates. Going from 60 FPS to 50 FPS represents a 3.3 millisecond increase in processing time, but going from 30 FPS to 20 FPS represents a 16.6 millisecond increase in processing time. The same is 10 FPS lower, but the time it takes to render a frame is vastly different.
It is very helpful to know how many milliseconds it takes to render a frame at a typical frame rate. To find the time this takes, we should follow the formula 1000/[desired frame rate] . Using this formula, we know that at 30 FPS per second, rendering takes less than 33.3 milliseconds per frame. A game running at 60 FPS takes less than 16.6 milliseconds to render each frame.
For each frame that is rendered, Unity has to perform a number of different tasks. In short, Unity has to update the state of the game, take a snapshot of the game and render it to the screen. The tasks that must be performed each frame include reading user input, executing scripts, and lighting calculations. In addition, there are some operations that are performed multiple times in one frame, such as physical calculations. When all tasks are executed fast enough, our game will have a stable, acceptable frame rate. When all tasks are not executed fast enough, it will take longer to render and the frame rate will drop.
Knowing which tasks are taking the longest time is critical to how to troubleshoot game performance issues. Once we know which task is killing the frame rate, we can try to optimize that part. This is why profiling is so important: profiling tools can show how long each task takes in a given frame.
4Record analysis data
In order to study the performance of our game, we have to record data on poor game performance. In order to obtain more accurate analysis data, we need to create a test package ( development build ) to run on the target hardware and record the analysis data.
If we are not familiar with the packaging and real machine debugging process, click here to view the operation guide.
Collect data using real devices
- Use the development build method to package and run on the target machine.
- Start recording profiling data before performance issues arise.
- Once performance issues occur, click anywhere above the Profiler window to pause the game and select a frame.
- At the top of the Profiler window, select the frames that show poor performance. This could be a "spike" below our requested frame rate or a representative frame. We can use the left and right keys or the forward and backward keys to move between frames better.

We've gotten profiling data for poor performance in games. Next, let's learn how to analyze this data.
5 Analyzing data
Before drawing any conclusions about a game's performance, we must learn how to read and analyze the performance data displayed in the Profiler window. We know that when Unity cannot complete all the tasks required for rendering in time, the frame rate will drop. We'll use the Profiler window to see exactly what tasks were executed, how long they took and in what order. This information will help us find which parts of the task are causing the rendering time to be too long.
It is better to learn how to analyze than to learn a series of steps. It is more useful to understand these data by ourselves, so that when we encounter new problems, we can study them by ourselves. Even if we just learned to search on Unity answers, it's a great start.
To learn how to profile, we'll use the CPU profiler as an example, which is probably the profiler we use the most to investigate frame rate issues.
5.1 CPU Profiler
When we look at the CPU profiler in the Profiler window, we can see how long the CPU takes to complete each frame.
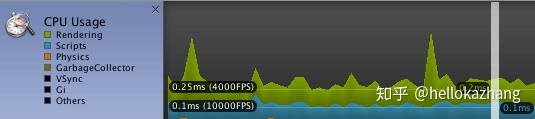
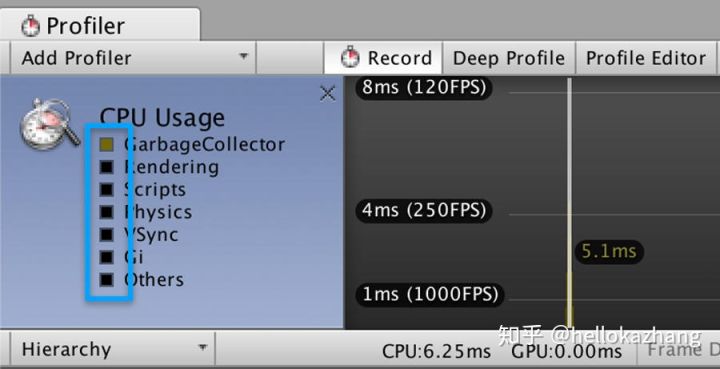
We can see a colored wave graph of time spent. Different colors represent time spent in rendering operations, physics calculations, etc. Those keywords indicate which colors represent which tasks.
In the next screenshot, we can see that the main time of this frame is spent in rendering operations. The CPU time indicator below shows that our total CPU time was spent in this frame at 85.95 milliseconds.

hierarchy diagram
Let's use the CPU Profiler's Hierarchy View to dig into the current data and see more precisely which tasks are spending the most CPU time on the current frame. When the CPU profiler is selected, we can see the detailed information of the current frame in the lower half of the Profiler window. Looking at the bottom half of the Profiler window, we can use the drop-down menu to select the structure view above. This allows us to see the details of the tasks that are happening on the CPU.
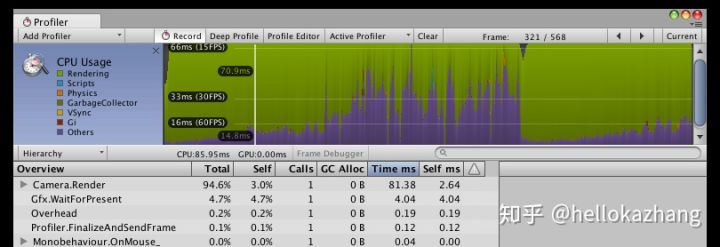
In a hierarchy graph, click the column header of any column to sort by that value. For example, click Time ms to start sorting by taking the longest time, and click Calls to sort by the function with the most calls in the currently highlighted frame. In the screenshot above, we sort by time-consuming, we can see that the most time-consuming CPU function is Camera.Render.
If there are small arrows on the left and right of a function name, we can expand to see which other functions are called by this function and their performance impact. The Self ms column indicates the time consumption of this function itself, and the Time me column indicates the time consumption of this function and other functions it calls.

In this case, we can see that under Camera.Render, the most time-consuming function is Shadows.RenderJob. Even though we don't know much about this specific function yet, we already have information about our game problem. We know that our problem is related to rendering, and the most time-consuming task is related to shaodws.
Another useful thing we can do in the Hierarchy Graph is compare our game's frames so we can see how performance changes over time. We use the CPU profiler to analyze the single most time-consuming function frame by frame. When we click on the function name on the CPU profiler hierarchy diagram, the function-related data will be highlighted.

For example, if we click Gfx.WaitForPresent in the hierarchy view, the rendering function related to Gfx.WaitForPresent will be highlighted.
timeline view
Now let's use the CPU Profiler's timing view to learn more about our rendering problems. The time view shows two things: the order in which CPU tasks are executed and which thread is responsible for which task. We can use the drop-down button to select the timeline view in the upper left corner of the lower half of the screen of the Profiler window (where the structure view option was shown before)
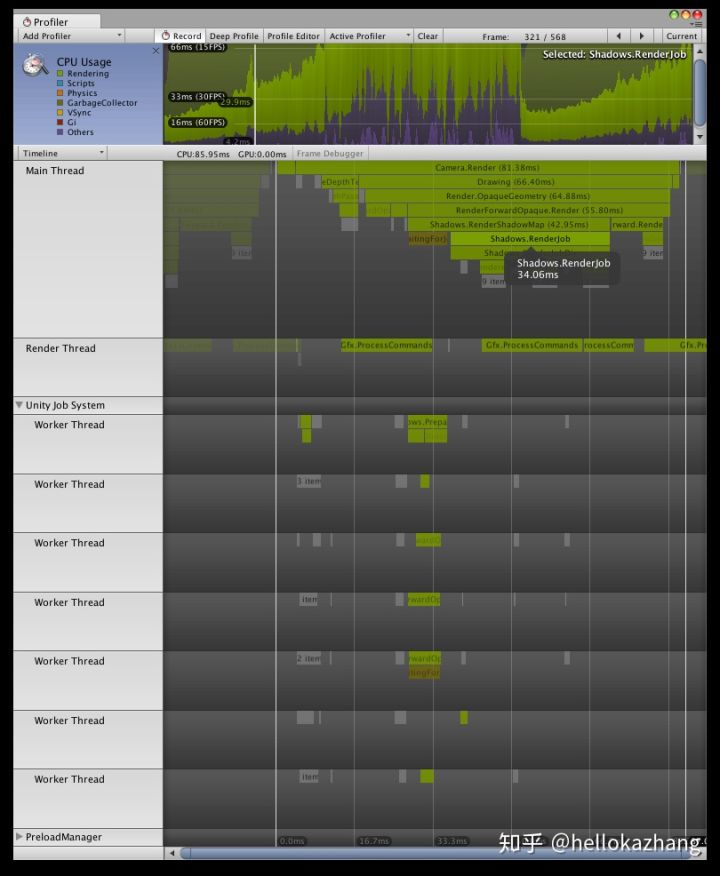
Threads can run multiple separate tasks concurrently. While one thread is performing a task, another thread can perform a completely independent task. Unity's rendering process contains three types of threads: main thread , render thread , and worker threads . Knowing which threads are responsible for which tasks is very helpful: once we know which thread performs the slowest task, we know we should focus our efforts on optimizing the operations performed by those threads.

We can zoom in on the timeline view to get a closer look at individual tasks. Calls from other functions are also displayed. In this example, we zoomed in on Shadows.RenderJob to see the individual tasks that make up this job. We can see that Shadows.RenderJob is called in the main thread. We also see that worker threads perform tasks related to shadows. The WaitingForJob task appears on the main thread, indicating that the main thread is waiting for the worker thread to complete the task. From this we can conclude that shadows related rendering operations are taking too long in main thread and worker threads. We now know the problem.
5.2 Other analyzers
While the CPU profiler is the most commonly used tool when tracking down framerate-related performance issues, other profilers can be very useful as well. It's a good idea to familiarize yourself with the information provided by other analyzers.
Follow the steps above and try to learn what information a few other different profilers provide per frame. For example, try using the Render Profiler to see how the render stats change from frame to frame.
6 Determining the Cause of Performance Issues
Now that we're familiar with the process of reading and analyzing performance data in the profiler, we can begin to find the cause of performance problems.
6.1 Eliminate the influence of vertical synchronization
Vertical synchronization, referred to as VSync , is used to match the game frame rate and screen refresh rate. VSync will affect the game frame rate, and its effect will be displayed on the Profiler window. It's easy to think it's a performance issue if we don't know what we're looking at, so before we move on to performance issues, learn how to rule out vsync.
Hide vsync info in CPU profiler
We can choose which information to hide in CPU Profiler. This allows us to ignore information that is not helpful for the current study.
The steps to hide VSync are as follows:
- Click on CPU Profiler
- At the top of the Profiler window, the CPU profiler area displays the currently concerned data, click the yellow square marked VSync to hide the vertical synchronization information
Ignore vsync information in hierarchy view
There is no way to hide vsync information in the hierarchy view, but we know what it looks like so we can ignore it.
Whenever we see WaitForTargetFPS in the hierarchy view, it means our game is waiting for vsync, we don't need to study this function, just ignore it.
mask vsync
Vsync cannot be disabled on all platforms: many (eg iOS) enforce Vsync. But if we're developing for a platform that doesn't enforce vsync, we can disable vsync. Click Edit -> Project Settings -> Quality , find VSync Count , and select Don't Sync from the menu .
6.2 Rendering Analyzer
Rendering is a common cause of performance issues. Before attempting to fix rendering issues, it is critical to determine whether our game is CPU bound or GPU bound , as the solution varies from case to case.
Simply put, the CPU is responsible for deciding what to draw, and the GPU is responsible for drawing. If the rendering problem is due to the CPU taking too much time, the game is CPU intensive, and if the rendering problem is due to the GPU taking too much time, the game is GPU intensive.
Tell if our game is GPU intensive
The quickest way to tell if our game is GPU intensive is to use the GPU Profiler. Unfortunately, not all devices or drivers support this analyzer. Before we use the GPU profiler, we first check if the GPU profiler is available on the target device.
To detect if the GPU profiler is available on the target device, we should perform the following steps:
- In the upper left corner of the Profiler window, select Add profiler
- Select the GPU via the drop-down menu
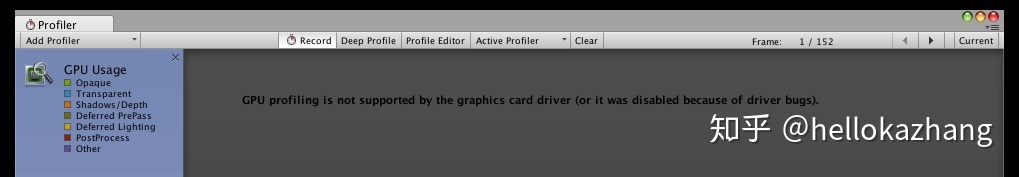
If the GPU profiler is not supported, we will see a message starting with "GPU Profiling is not supported" in the area where the GPU normally displays data.
If you don't see this message, it means the GPU profiler is supported on the target device. If a GPU profiler is available, following these steps can tell if our game is GPU intensive very quickly:
- Click on GPU Profiler
- Look at the very center of the screen, which shows the CPU and GPU elapsed time for the currently selected frame.
If the GPU time is greater than the CPU time, then we can confirm that our game is GPU intensive.

If the GPU profiler isn't available on the target device, we can still tell if our game is GPU intensive. We can do this by looking at the CPU profiler. If we see that the CPU is waiting for the GPU to complete tasks, it means our game is GPU intensive. To find out if this is the case, we can perform the following steps:
- Click to select CPU Profiler.
- Check the current frame information and profiler information displayed in the bottom area of the Profiler window.
- Select Hierarchy View from the drop-down menu in the upper left corner of the area.
- Select the Time ms column header, and the function time is sorted by time.
If the function Gfx.WaitForPresent is the most time-consuming function in the CPU profiler, this indicates that the CPU is waiting for the GPU. This means our game is GPU intensive.

Fix rendering issues when our game is GPU intensive.
If we've confirmed that our game is GPU intensive, we should read this article .
Identify if our game is CPU intensive
If we haven't already identified the cause of the performance issue, now we look at CPU-based rendering issues.
- Click to select CPU Profiler.
- Over time, information at the top of the Profiler window displays profiling data, detecting portions of the image that represent renderings. We can show or hide this data by clicking the colored square image next to the keyword.
If most of the slow frame time is taken up by rendering, it means that rendering may be the cause of our problem. We can confirm by continuing to dig as follows:
- Click to select CPU Profiler.
- Detect current frame information and profiler information displayed in the Profiler window.
- Select Hierarchy from the drop-down menu in the upper left corner of the Analysis Data area.
- Select the column header Time ms to sort by function time consumption.
- Click to select the topmost function.
If a rendering function is selected, the CPU profiler image will highlight the Rendering image. If this is the case, it means that rendering-related operations are causing our performance issues and confirms that our game is CPU intensive. Note the function name and which thread executes the function. This information is useful when we try to solve the problem.
Fix rendering issues when our game is CPU intensive. We should read this article
if we have confirmed that our game is having CPU intensive rendering issues .
6.3 Garbage Collection Analyzer
Next, we check whether garbage collection is causing a bottleneck. Garbage collection is a feature of Unity's automatic memory management, and it can be a slow operation.
- Click to select CPU Profiler.
- In the Profiler window, this part can be turned yellow to represent garbage collection, and the small color block next to the name can display or cancel the data collection of garbage collection. Note that you can drag and drop the names of the sections you are interested in to reorder them. In the screenshot below, we dragged the GarbageCollector to the top and clicked to turn off other aspects of the data.
If most of the slow frame time is spent by garbage collection, this indicates that we have a problem with excessive garbage collection. We can drill down to confirm the problem.
- Click to select the CPU profiler, and check the current frame information displayed at the bottom of the Profiler window.
- The drop-down button in the upper left corner of the bottom area selects Hierarchy View.
- Select the Time ms column header to sort by function time.
If the GC.Collect() function appears and takes a long time, we can confirm that our game has garbage collection problems.
Solving Garbage Collection Problems
If we confirm that our game has garbage collection issues, we should read this article .
6.4 Physics Analyzer
If we ruled out rendering and garbage collection issues, we check to see if the responsible physics calculations are the cause of our performance problems.
- Click to select CPU Profiler.
- At the top of the Profiler window displaying data, detect the image representing Physics (orange image). We show or hide images by clicking on the colored square next to the name.
If most of the slow frame time is taken up by physics, then physics calculations are confirmed to be the cause of our problem. We can investigate further to confirm the problem:
- Click to select the CPU profiler to check the current frame details displayed in the area below the Profiler.
- Select Hierarchy View from the drop-down menu in the upper left corner of the bottom area.
- Select the Time ms column header to sort by function time.
- Click to select a function at the top.
If a physics function is selected, the CPU profiler image will highlight the Physics image. If this is the case, we can determine that the cause of the performance issue is related to physical calculations.
solve physics problems
If we confirm that our problem is physically caused, the following information will be helpful:
- This page of the Unity Manual.
- This tutorial on optimising physics in a Unity game.
- Unite 2012 talk on optimization
6.5 Slow scripts
Now we detect whether slow or overly complex scripts are the cause of performance problems. Script, here will be non-Unity engine code. These scripts are usually written by ourselves, or introduced by third-party plug-ins.
- Click to select CPU Profiler
- At the top of the Profiler window showing the data, detect the image representing the Script, we can show or hide the image data by clicking the color square next to the keyword.
If the slow frames are mostly occupied by scripts, it can be confirmed that the script written by the developer is the cause of the problem. We can move on to the confirmation problem:
- Click to select the CPU profiler to detect the detailed data of the current frame at the bottom of the Profiler window.
- Select Hierarchy View from the drop-down menu in the upper left corner of the bottom area.
- Select the Time ms column header to sort by function time.
- Click to select a function at the top.
If you wrote your own scripts, the CPU Profiler image will highlight the Scripts image. In this case, we can confirm that the cause of the performance problem is related to the script we wrote.
Note that there is a special case above: when our game contains rendering related functions, such as Image Effects scripts or OnWillRenderObject or OnPreCull functions, these will appear in the Rendering Profiler instead of the Scripting Profiler.
Although it was a little confusing at first, when you usually use the hierarchical structure view and timeline view to detect code, you can also track the relevant code.
Troubleshoot slow code
If we determine that the scripts we wrote are the cause of performance problems, here are some simple tips to improve performance. Here is a resource on code optimization:
- userful advice on optimizing scripts
- avoiding expensive function calls
- userful summary of common scripting problems
7 Other Causes of Performance Issues
While we've discussed the four most common causes of performance issues, our game may have some performance issues that aren't mentioned here. In this case, we should use some of the methods above to collect data, study the CPU profiler and find the function name causing the problem. Once we know the function name, we can find some information about this function and how to reduce the consumption of these functions by searching the Unity Manual, Unity Community and Unity Answers.
Learning recommendation: the use of the Profiler tool for unity performance analysis_mob60475702a1ff's technical blog_51CTO blog