Table of contents
DOM node (addition, deletion and modification) debugging
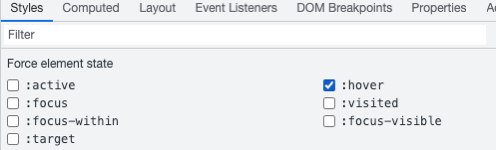
Simulate pseudo-states of elements for easy debugging
Resource list + (changeable) local storage Cookie, WebStorage (localStorage, sessionStorage)
VS Code and devtoolDebugging
Content scripts: Plugins
Components(props、data、computed、route)
Timeline (records the trigger time of the event (Mouse\keyboard))
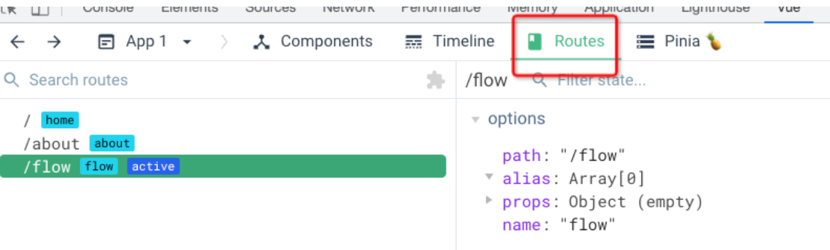
Routes (view routes for all pages)
https://developer.chrome.com/docs/devtools
Elements
DOM node (addition, deletion and modification) debugging

Subtree modifications: When a child node is deleted or addedAttributes modifications: When the property is modifiedNode Removal: When the node is deleted

Styles


DOM structure
Add and delete attributes


Simulate pseudo-states of elements for easy debugging
Computed

Layout

Event Listeners
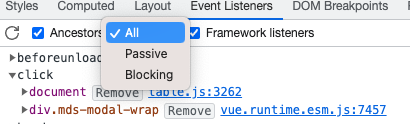
whether Ancestors show events bound on ancestors,
"passive" : When the event listener is marked "passive" ,
It indicates that the listener will not be called
preventDefault()to prevent the default behavior of the event.In other words, it just passively observes events happening without intervening or preventing the event's default behavior.
This behavior is very useful for optimizing scrolling performance , as it tells the browser not to wait for the listener to finish executing before continuing to scroll.
"blocking" : When the event listener is marked as "blocking" ,
It indicates that the listener will be called
preventDefault()to prevent the default behavior of the event.In other words, it actively intervenes in the handling of events, preventing the default behavior from occurring.
This behavior is often used to handle specific user interactions that require custom behavior or prevent certain undesired actions.
Framework listeners ( recommended to check ) After checking, the browser will handle the binding events of mainstream frameworks
Network

Application
Resource list + (changeable) local storage Cookie, WebStorage (localStorage, sessionStorage)

Source Debugging
VS Code and devtool Debugging
As an editor, the biggest advantage of VS Code is that you can edit the source code while debugging with breakpoints . The debugging function is complete, and it has some advanced breakpoint functions that devtool does not have .
The debugging efficiency of Node.jstheJavaScript program is very high;
However, debugging Vue, Reactsuch projects may be relatively less efficient than browsers, because the browser instance opened during debugging may not be able to persist cookies , cannot use devtool Vue, and may cause some obstacles ;React
The browser's devtool is a development tool for the browser. It can review web page elements, view the console, breakpoint the source code, view memory, persist data, etc. It can be said that all content related to the web page can be viewed. Website development is fully functional .
The disadvantage is that it is not as fast and flexible as the break point of the editor in real time, and you need to manually find the location of the source code, which is equivalent to doing the operation of finding the code in the browser again, which is more troublesome. But you can use Vueand Reactdevelop plug-ins, which is more convenient.
Summarize:
VSCode is suitable for debugging Node.jsandJavaScript programs with more logic,
Browsers are suitable for debugging frameworks with devtool plug-ins , and which method to use depends on the actual scenario.
Page: resource directory

Content scripts: plugins
Snippets: Convenient Testing

Vue Devtools
Install
Open Google App Store, search vue devtools并安装

The beta version is also available for both vue3 and vue2
Open the console and there will be a Vue tab
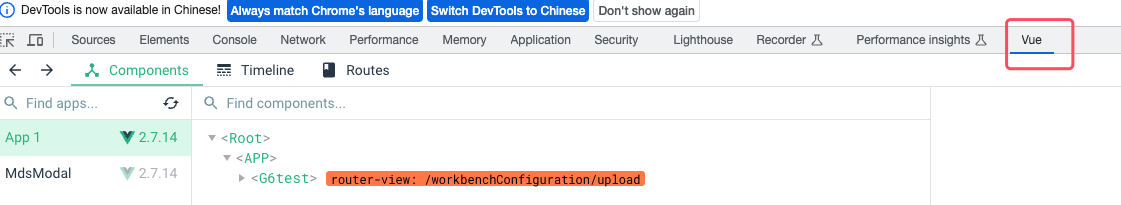
Components(props、data、computed、route)

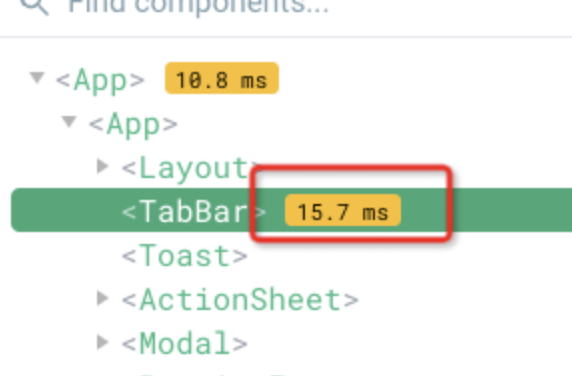
loading time
Timeline (records the trigger time of the event (Mouse\keyboard))

Routes (view routes for all pages)
This is very useful when taking over an old project, especially when the routing is spliced by the backend
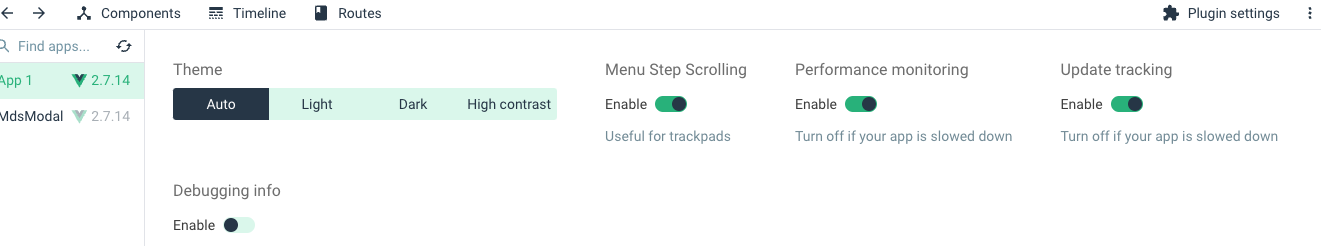
set up

Component names Set the display format of component names
Editable props whether to allow editing props
Hightlight updates Whether to highlight when updating

- Theme (theme color)
- Menu Step Scrolling (Step-by-step scrolling in a menu or toolbar. This feature is typically used for browsing and selecting when there are a large number of options in a menu or toolbar.)
- Performance monitoring (performance monitoring) is recommended to be turned on,
- Update tracking
- Debugging info