Practical debugging skills - detailed explanation
1. What is a bug?
The first known cause of a computer error was a moth, and it was also the first computer program error .
The origin of bugs:
bugs (the original meaning is bugs or bugs), the first generation of computers are composed of many huge vacuum tubes, and use a lot of electricity to make the vacuum tubes glow. A small bug, Bug, got into a vacuum tube, causing the entire computer to fail to work. After spending half a day, the researchers finally found the reason. After taking the bug out of the vacuum tube, the computer returned to normal. Later, the term Bug was used.
2. What is debugging? How important is it?
So there are traces of what happened. If you have a clear conscience, there is no need to cover up, that is, there are no signs. If you have a guilty conscience, there must be signs. The more signs, the easier it is to find out. This is the process of reasoning .
When troubleshooting, we have to do: what do we do? What do we want to do? how do i do it What code did you write during the process?
2.1 What is debugging?
Debugging (English: Debugging/Debug): Also known as debugging, the process of discovering a program error.
2.2 Basic steps of commissioning
- detect the presence of programming errors
- Positioning Troubleshooting Errors
- determine the cause of the error
- Propose a solution to correct the error
- Correct program errors and retest
2.3 Introduction to Debug and Release
Debug is usually called the debug version , it contains debugging information, and does not make any optimization, which is convenient for programmers to debug programs.
Release is called the release version (cannot be debugged), and it is often optimized to make the program optimal in code size and running speed, which is convenient for users to use.
The process of launching the software:
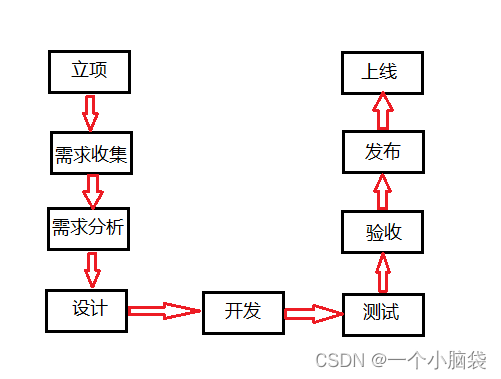
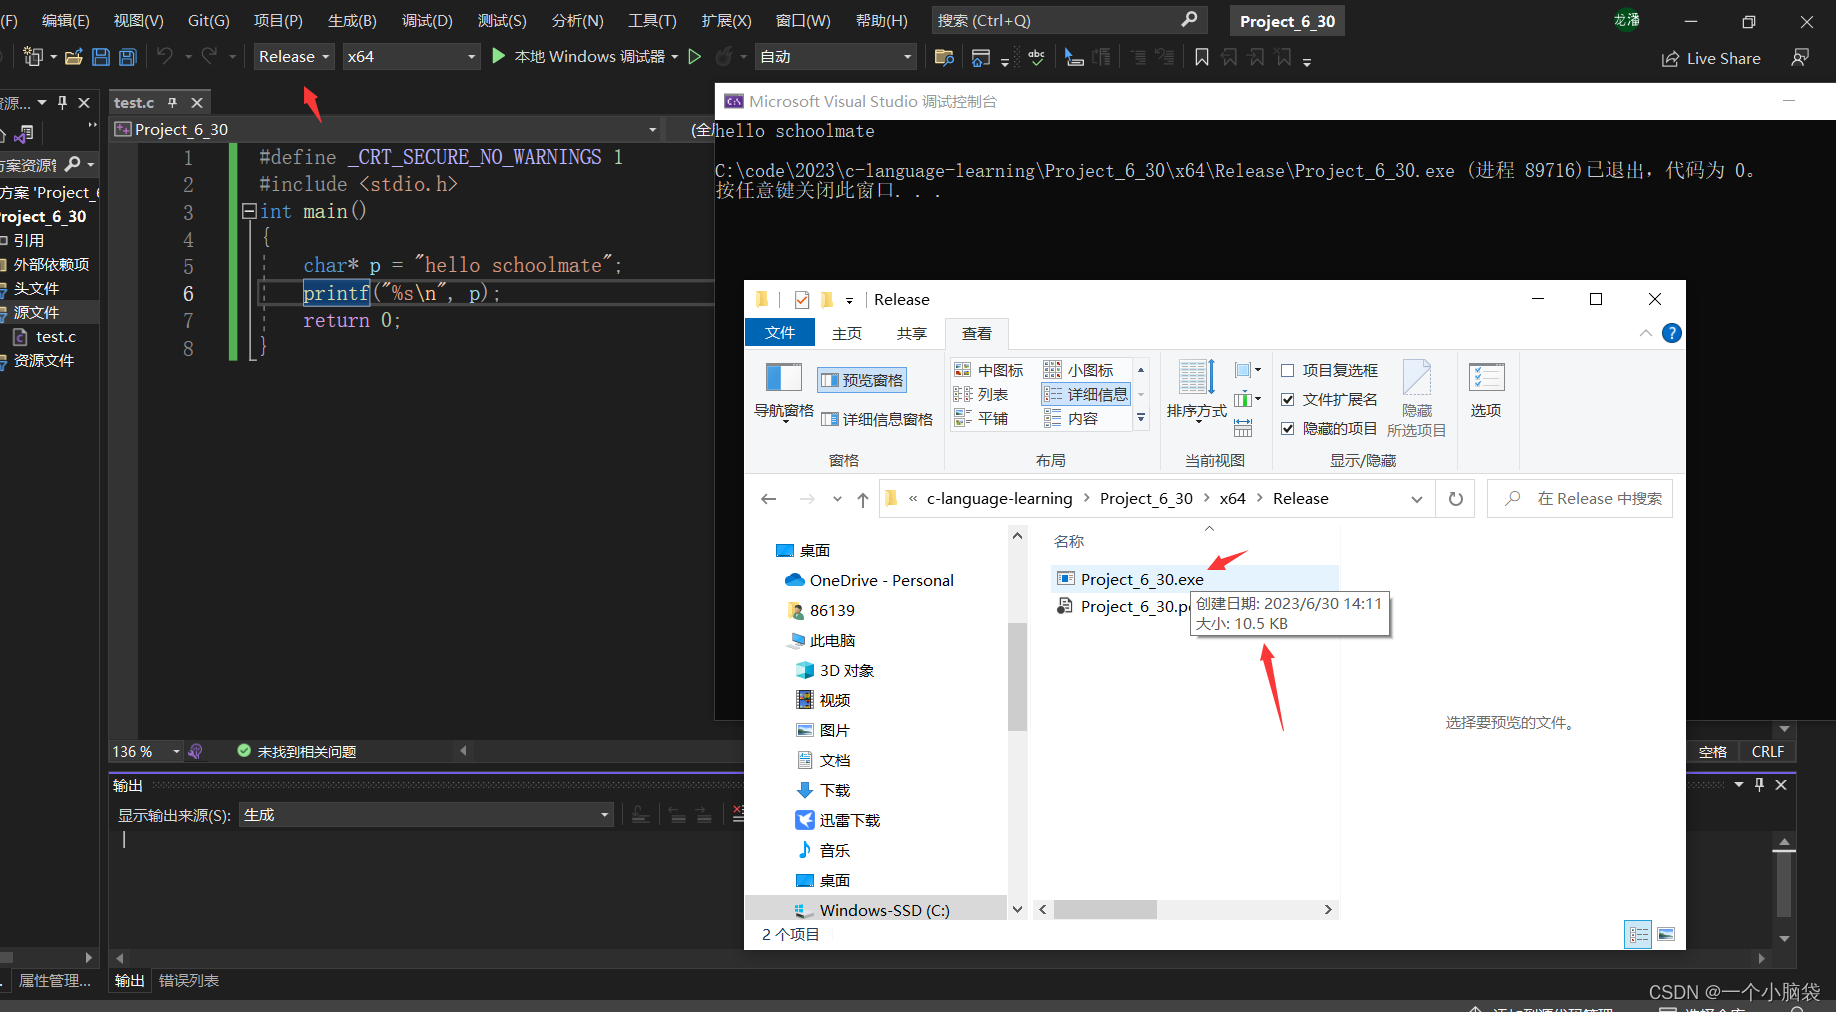
the code is displayed in the Debug environment:
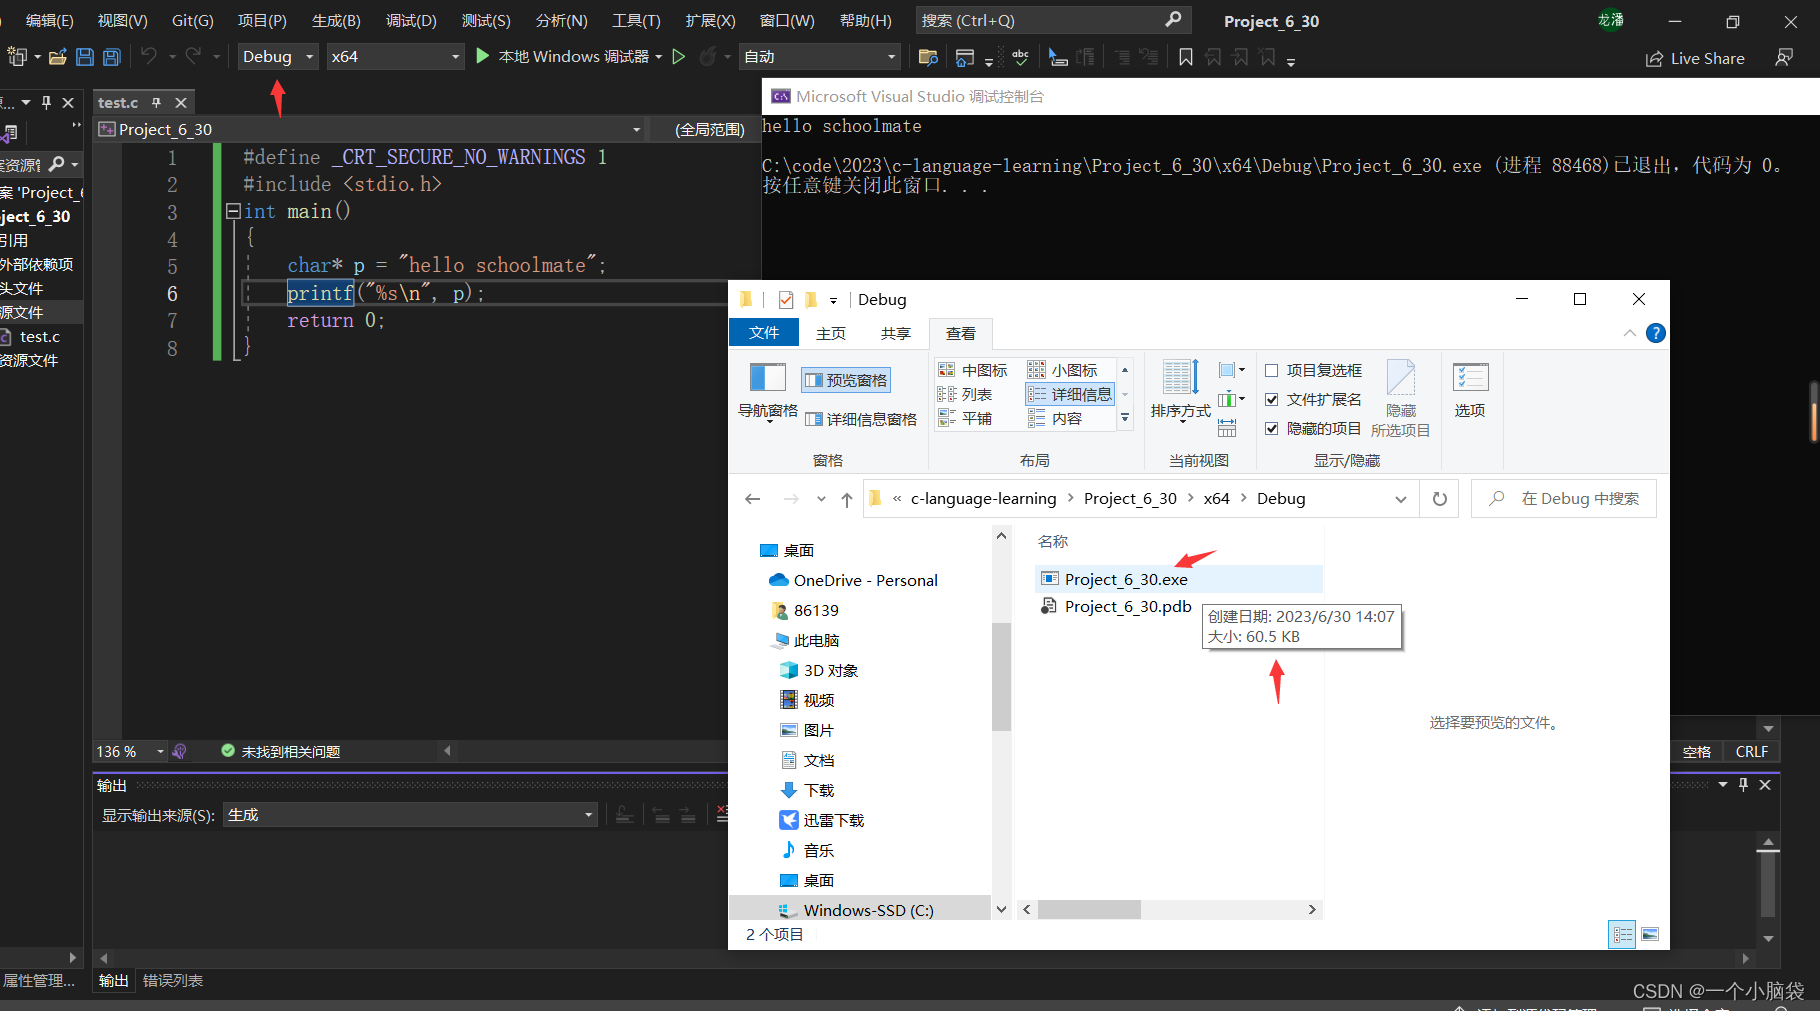
The code is displayed in the Release environment:
Debug and Release disassembly display comparison:
Compared with Debug and Release, it can be seen that the program code of Release is smaller than that of Debug, and the code has been optimized, but we don't know how to optimize it.
Let's continue to look at an example to explore:
#include <stdio.h>
int main()
{


    int arr[10] = {

     0 },i;
    for (i = 0; i <= 12; i++)
    {


        arr[i] = 0;
        printf("hehe\n");
    }
    return 0;
}
Executing the program under the Debug version crashes directly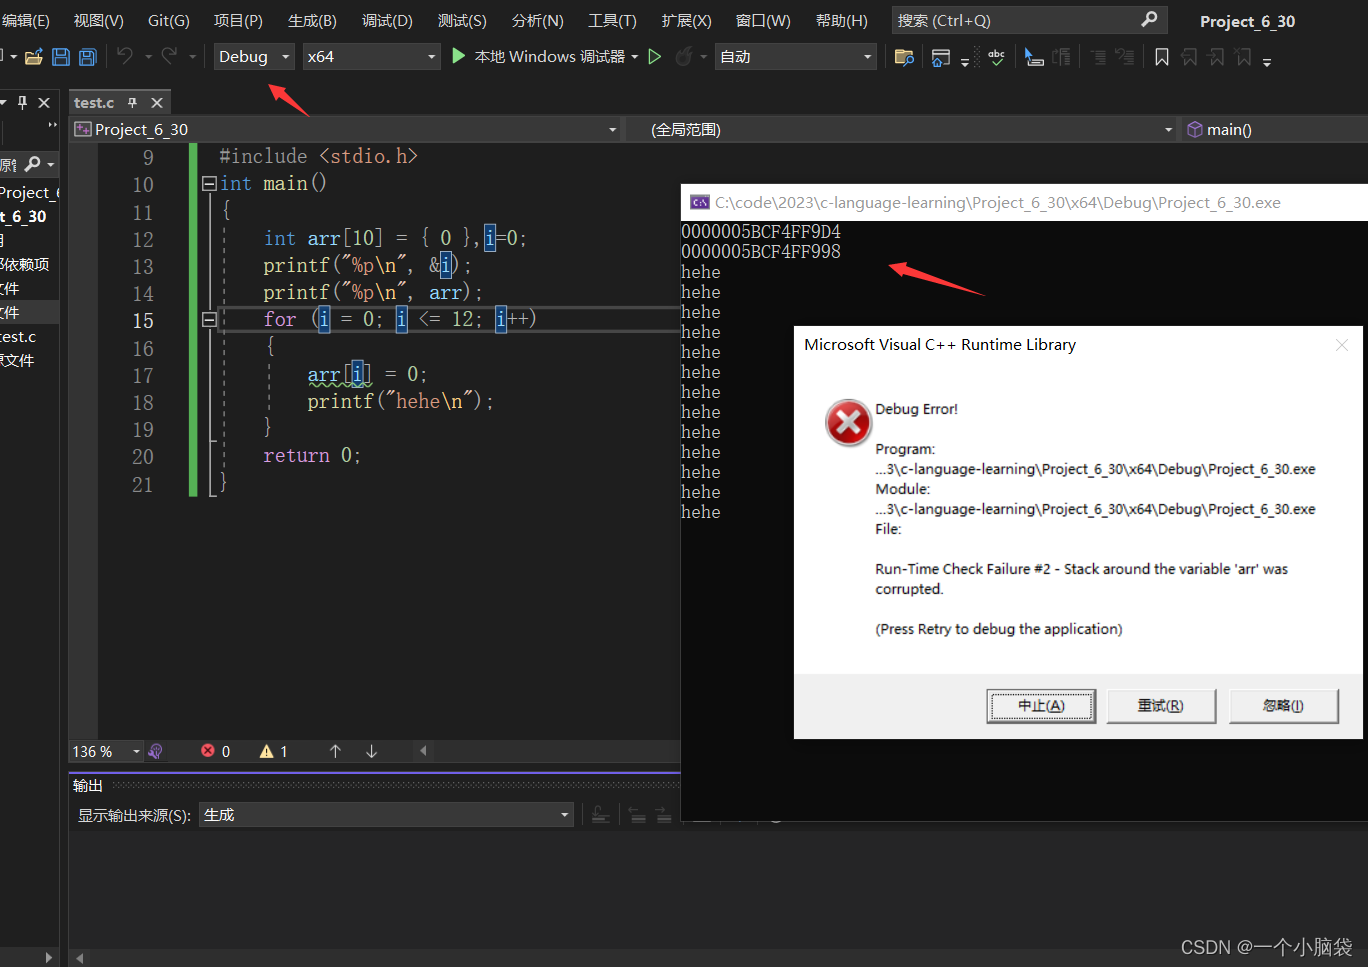
Execute the program under the Release version, and the execution is successful.
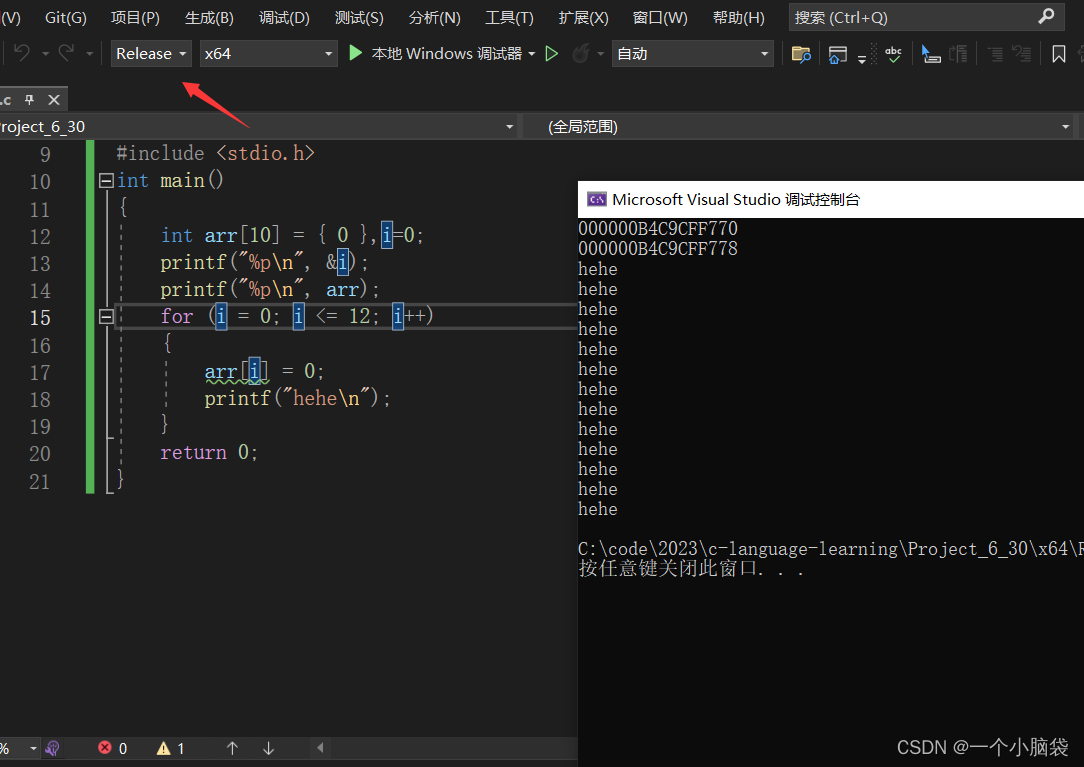
The order in which variables are opened in memory has changed, which affects the result of program execution.
Conclusion: This is caused by optimization,
3. Introduction to debugging in windows environment
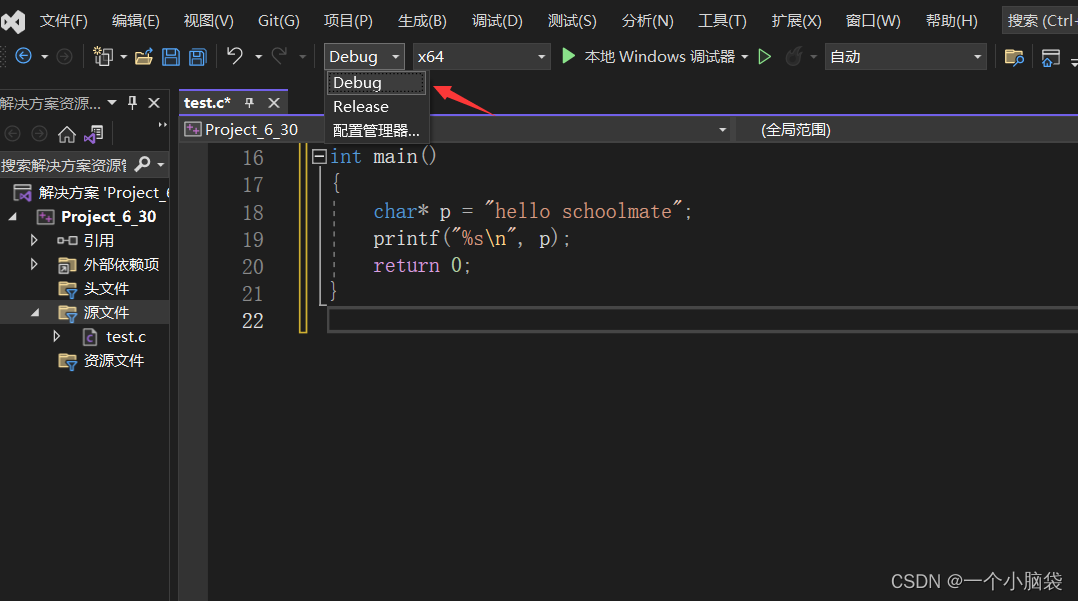
3.1 Debugging environment preparation
Select the debug option in the environment to make the code debug normally:
3.2 Shortcut keys
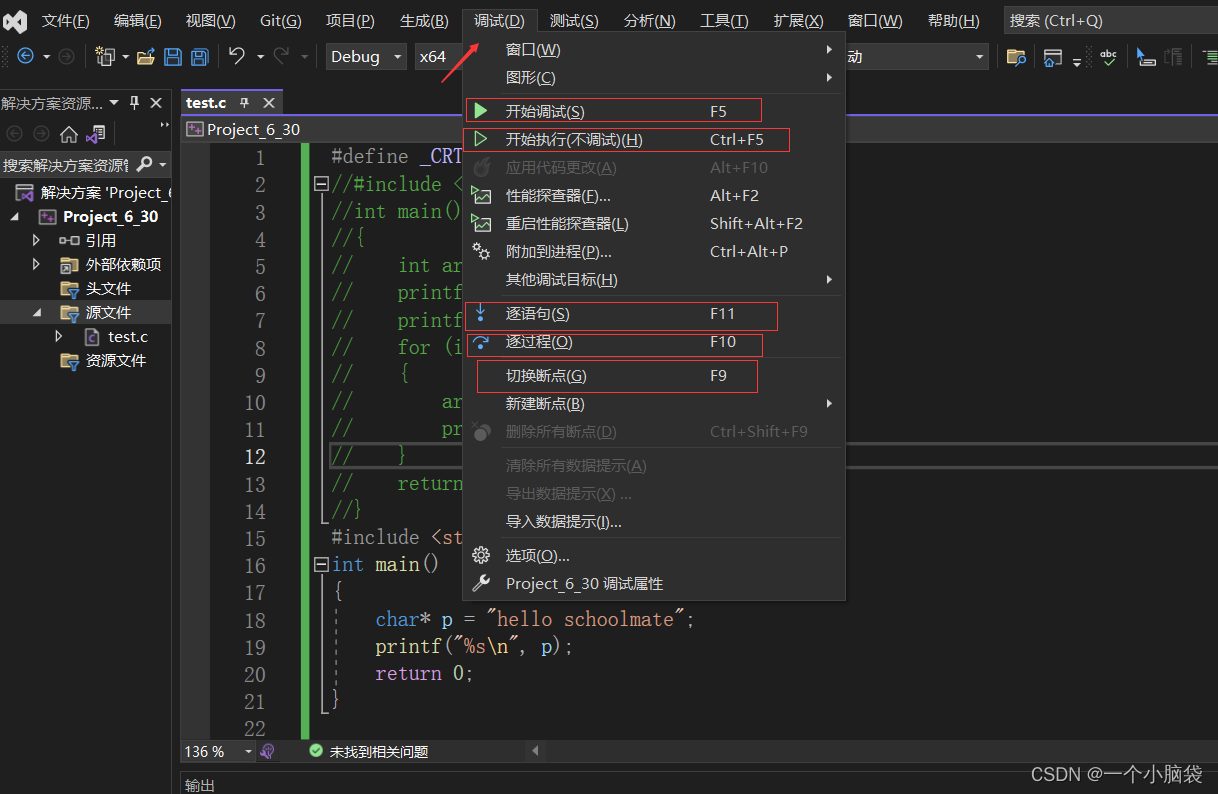
The most commonly used shortcut keys:
F5 :
Start debugging, often used to jump directly to the next breakpoint.
F9 :
Create breakpoints and cancel breakpoints.
The function of the breakpoint: You can set a breakpoint at any position of the program, so that the program can be stopped at any desired position, and then executed step by step.
F10 :
Process by process, usually used to process a process, a process can be a function call, or a statement.
F11 :
Statement by statement, that is, execute a statement each time, but this shortcut key can make our execution logic enter the function ; more detailed, you can enter the function to observe the process of function execution. (This is the most commonly used)
CTRL+F5 :
Start execution without debugging, if you want the program to run directly without debugging, you can use it directly.
Note:
If f9, f10, and f11 do not work on your computer, it is a problem with the fn key, just turn off fn. (or fn+f5; fn+f9; fn+f10; fn+f11)
show:
expand:
- Ctrl+Tab switch page
- Ctrl+D Paste the line of code where the cursor is located
- Ctrl+/ line comment out/uncomment line
- Ctrl+Shift+/ block comment/uncomment block
- Tab Indent right (two spaces)
- Shift+Tab back a tab character
- Ctrl+Enter open a line before the current line
- Ctrl+Z undo
- Ctrl+Y undo
- Ctrl+A select all
- Ctrl+C copy
- Ctrl+V Paste
- Ctrl+S Save
- Ctrl+F Quick Find
- Ctrl+Shift+F Find in files
- Ctrl+H quick replacement
- Home Back to the beginning of the line
- End jump to the end of the line
- Shift+Left/Right Select characters left/right
- Ctrl+Left/Right Move the cursor left/right at a granularity of one word
- F4 shows the properties window
- F12 Go to definition
- Shift+Tab cancel tab
- F5 run debugging
- Ctrl + F5 run without debugging
- Shift+F5 End debugging
- Ctrl+K+C Comment selection
- Ctrl+K+U Uncomment content
- Ctrl+W+X to open the toolbox
- Ctrl+E+W automatic line break
- Ctrl+M+M Hide or expand the current nested folded state
- Ctrl+L Delete a line of content
- Ctrl+E+D typeset the entire document format
- F11 statement-by-statement debugging
- F10 step-by-step debugging
- F9 enable/stop breakpoint
- Ctrl+Shift+F9 delete all breakpoints
- Ctrl+E+S view blank
- Ctrl+Alt+L Open Solution Explorer.
- F1 displays MSDN help.
- Shift+Alt+F10 import namespace
- Ctrl+F4 close the current tab window
- Ctrl+Shift+spacebar to view parameter information
- Shift+Alt+C Add class
- Quickly switch the cursor to the next line: Ctrl + Shift + Enter
- Quickly switch the cursor to the previous line: Ctrl + Enter
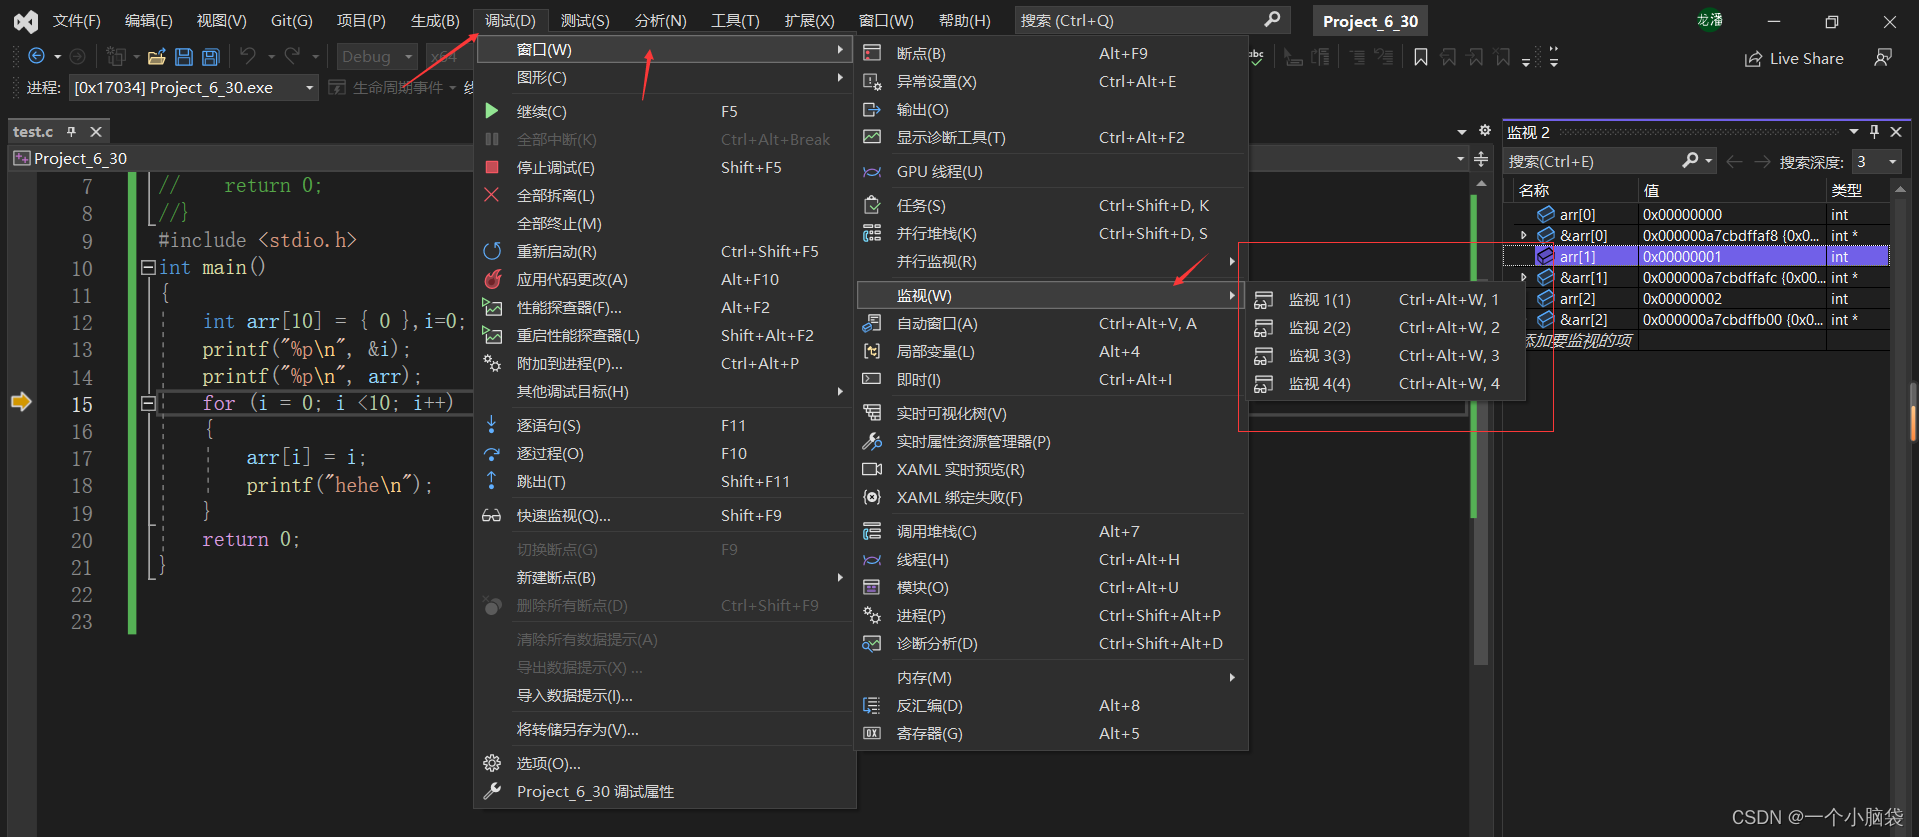
3.3 View the current information of the program during debugging
3.3.1 View the value of a temporary variable
After debugging starts, the value used to observe the variable can also observe the address.
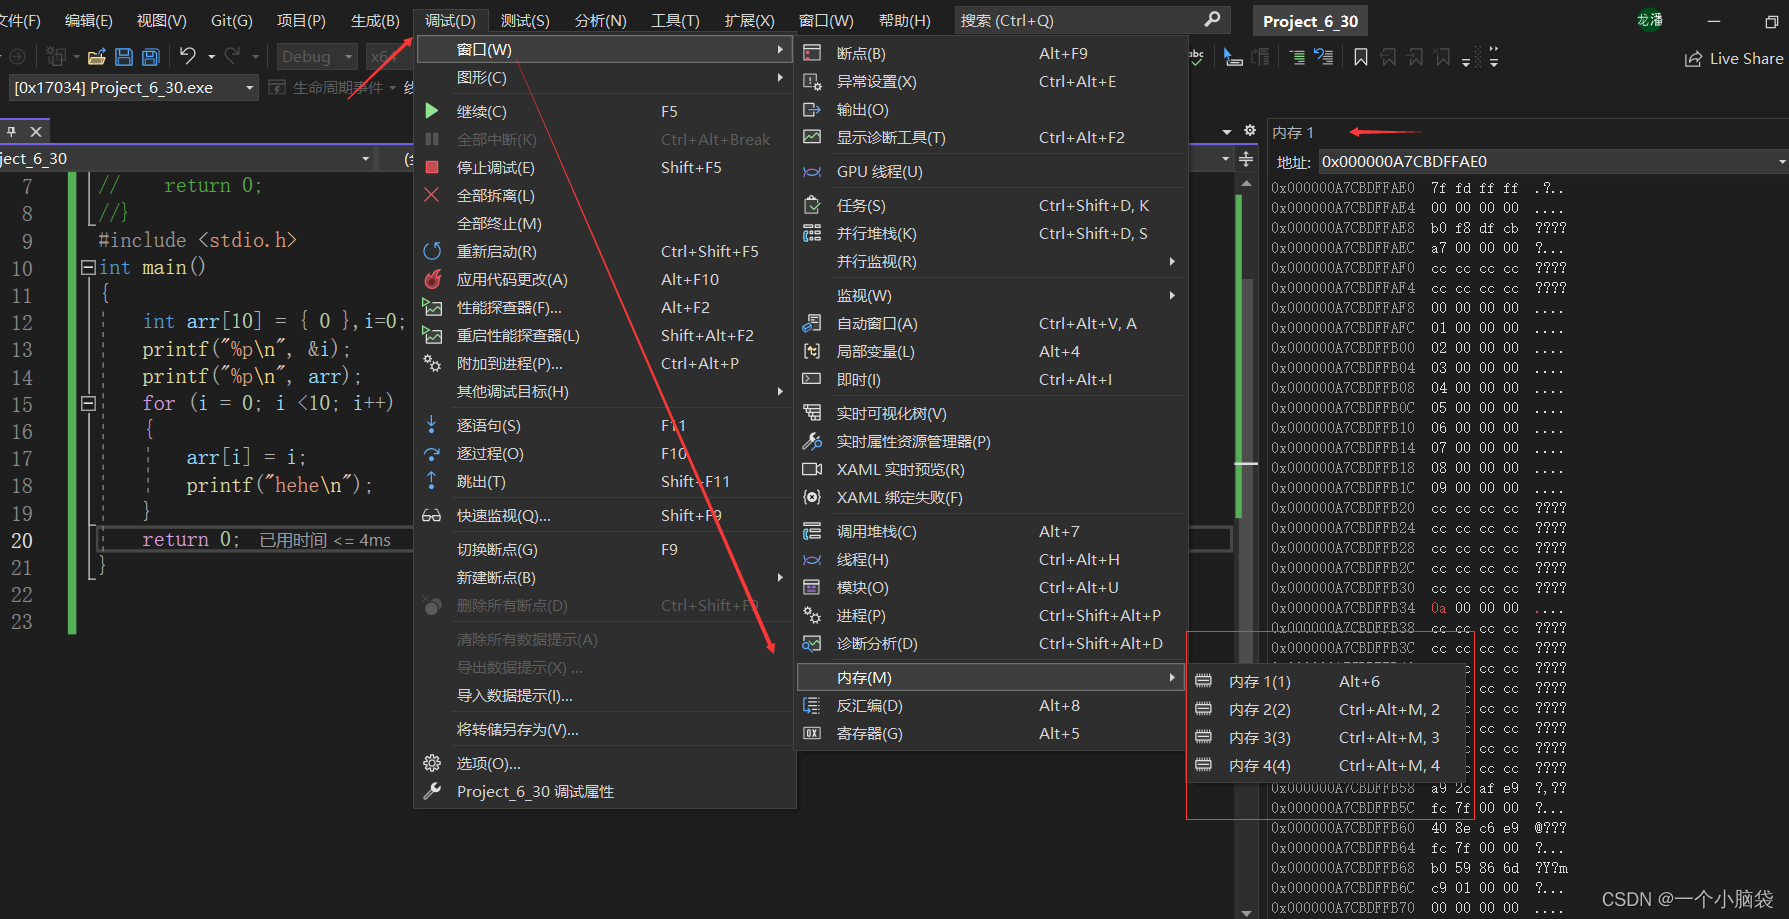
3.3.2 View memory information
After debugging starts, it is used to observe memory information
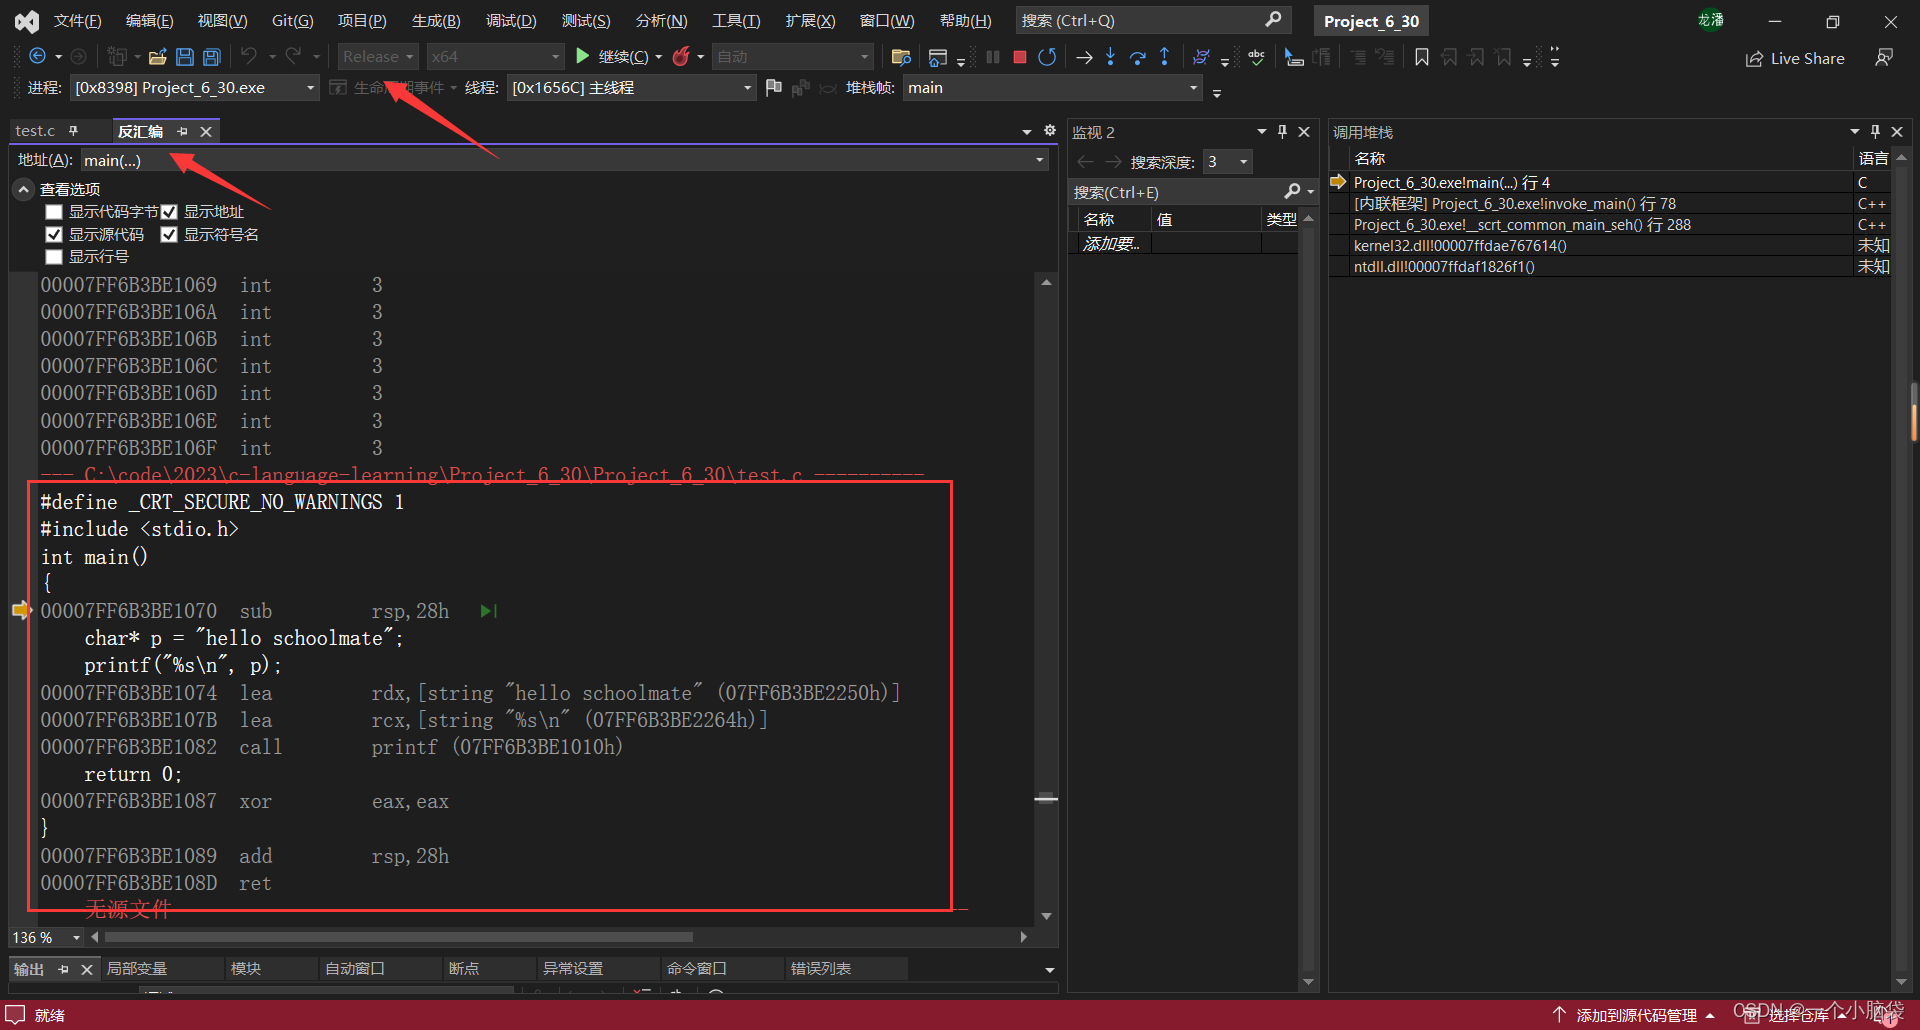
3.3.3 View call stack
After the debugging starts
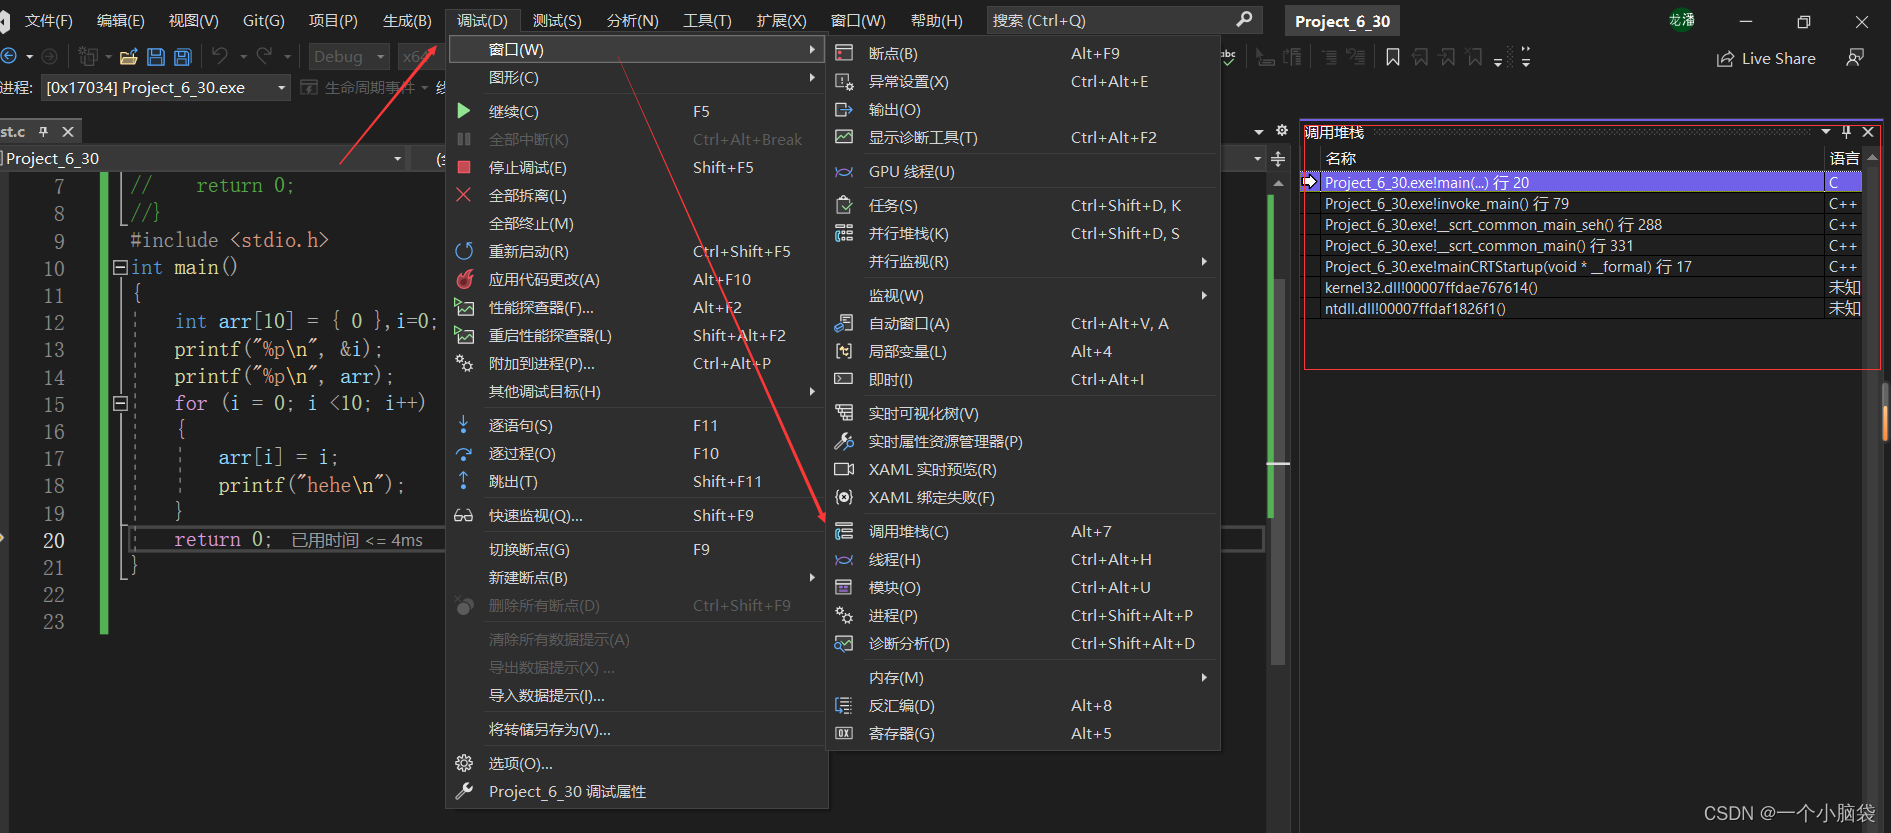
, the call stack can clearly reflect the call relationship of the function and the location of the current call.
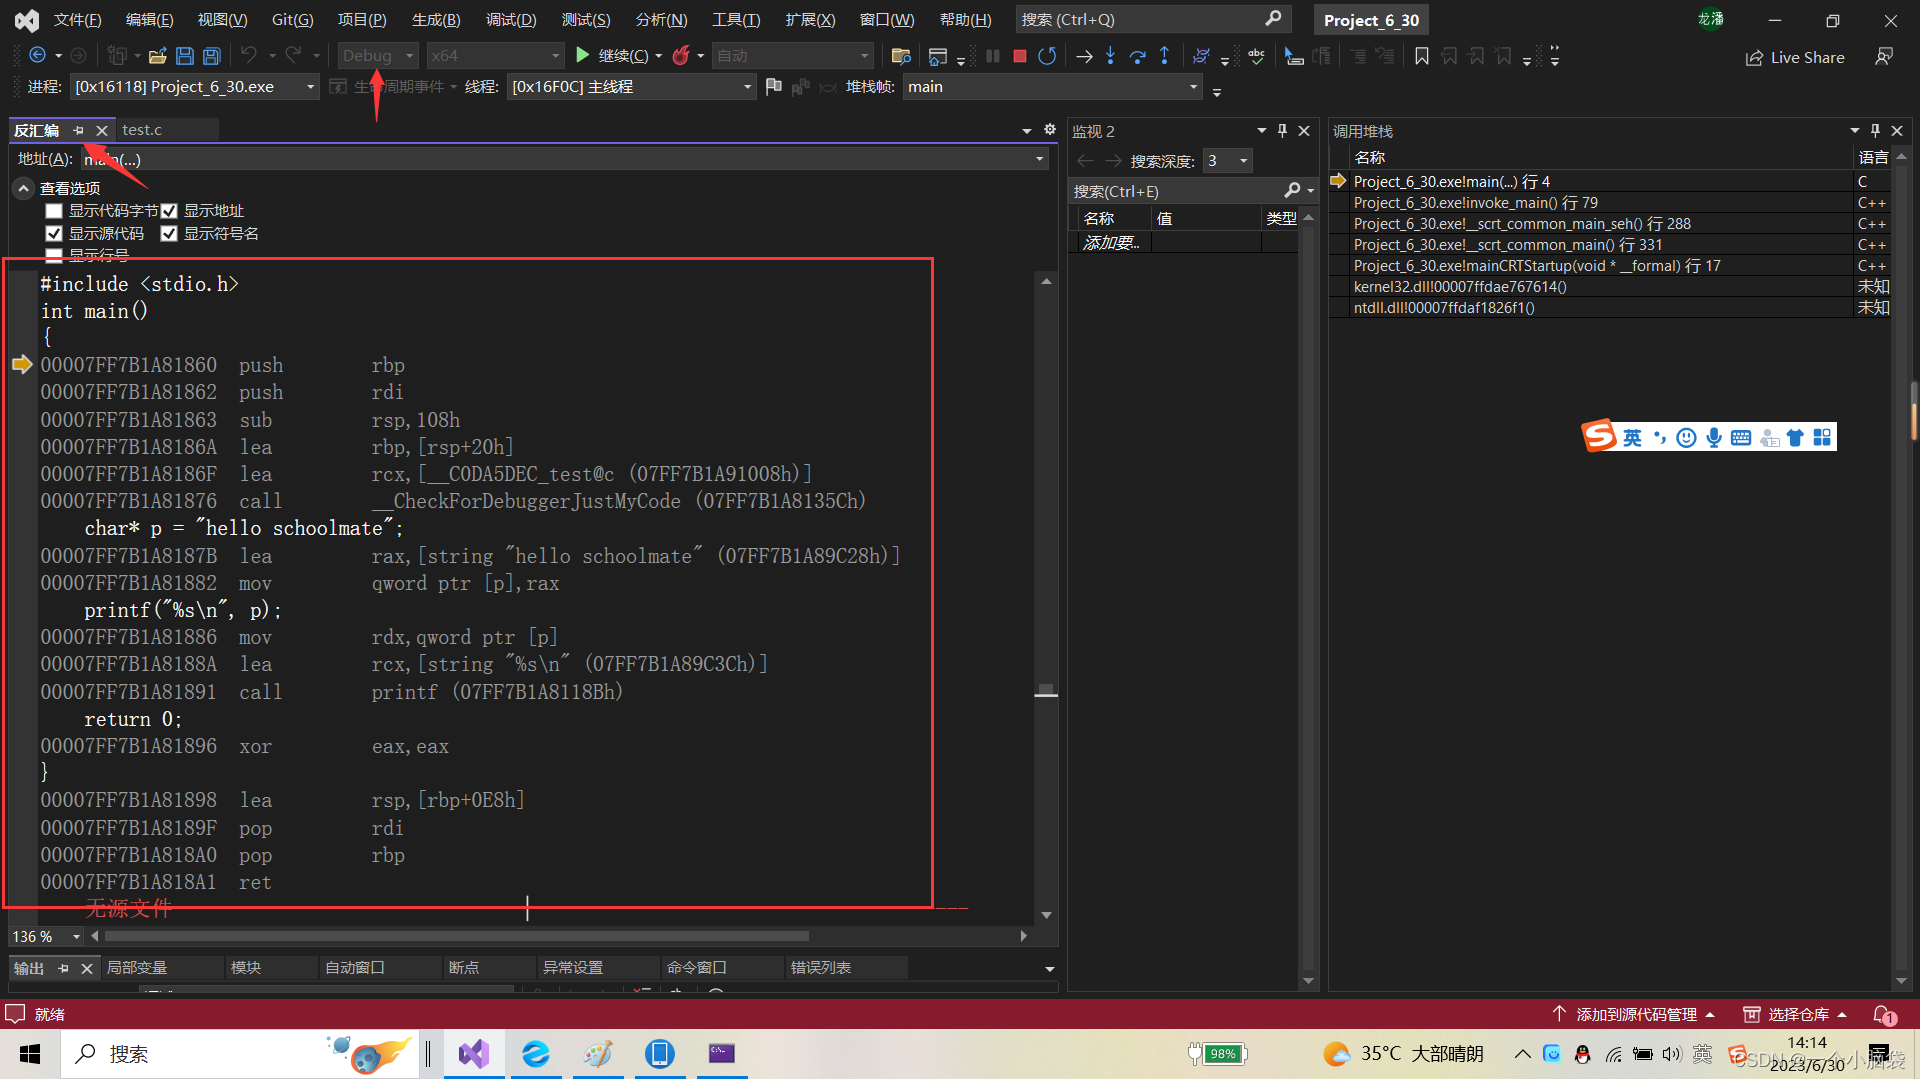
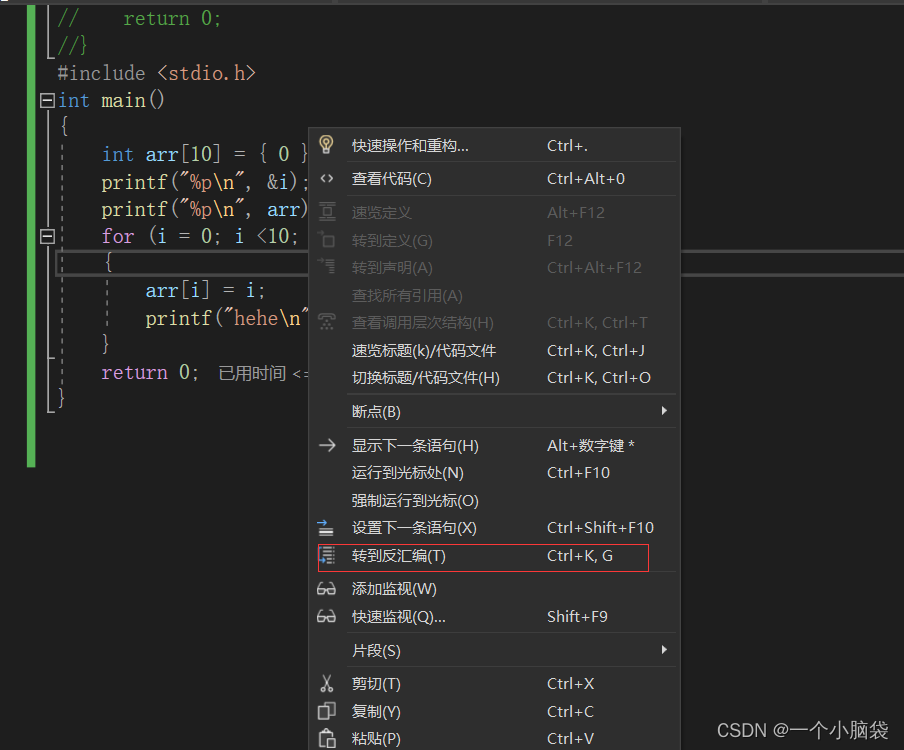
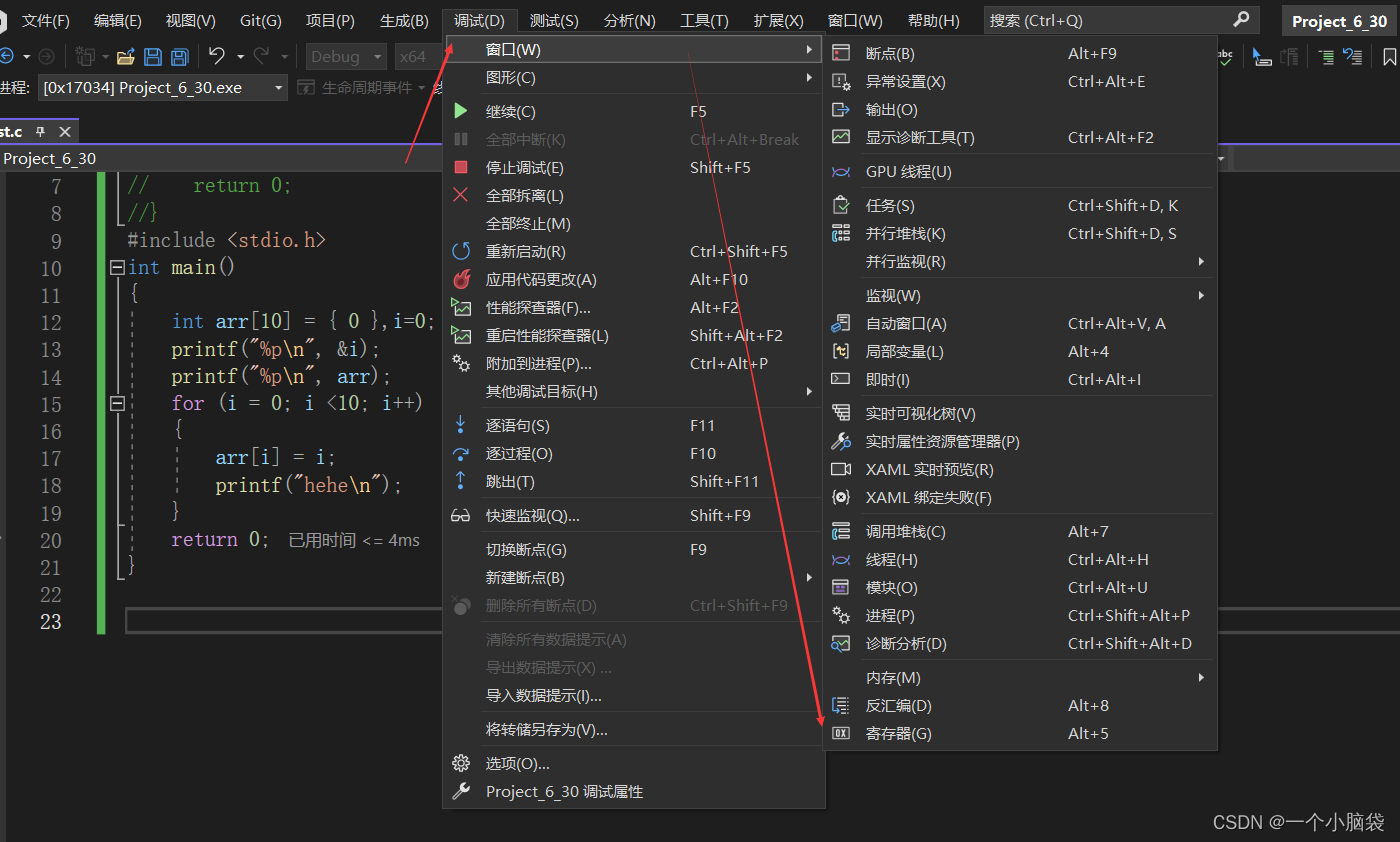
3.3.4 View assembly information (disassembly)
After debugging starts
Method 1: Right-click the mouse and select Go to Disassembly
Method 2:
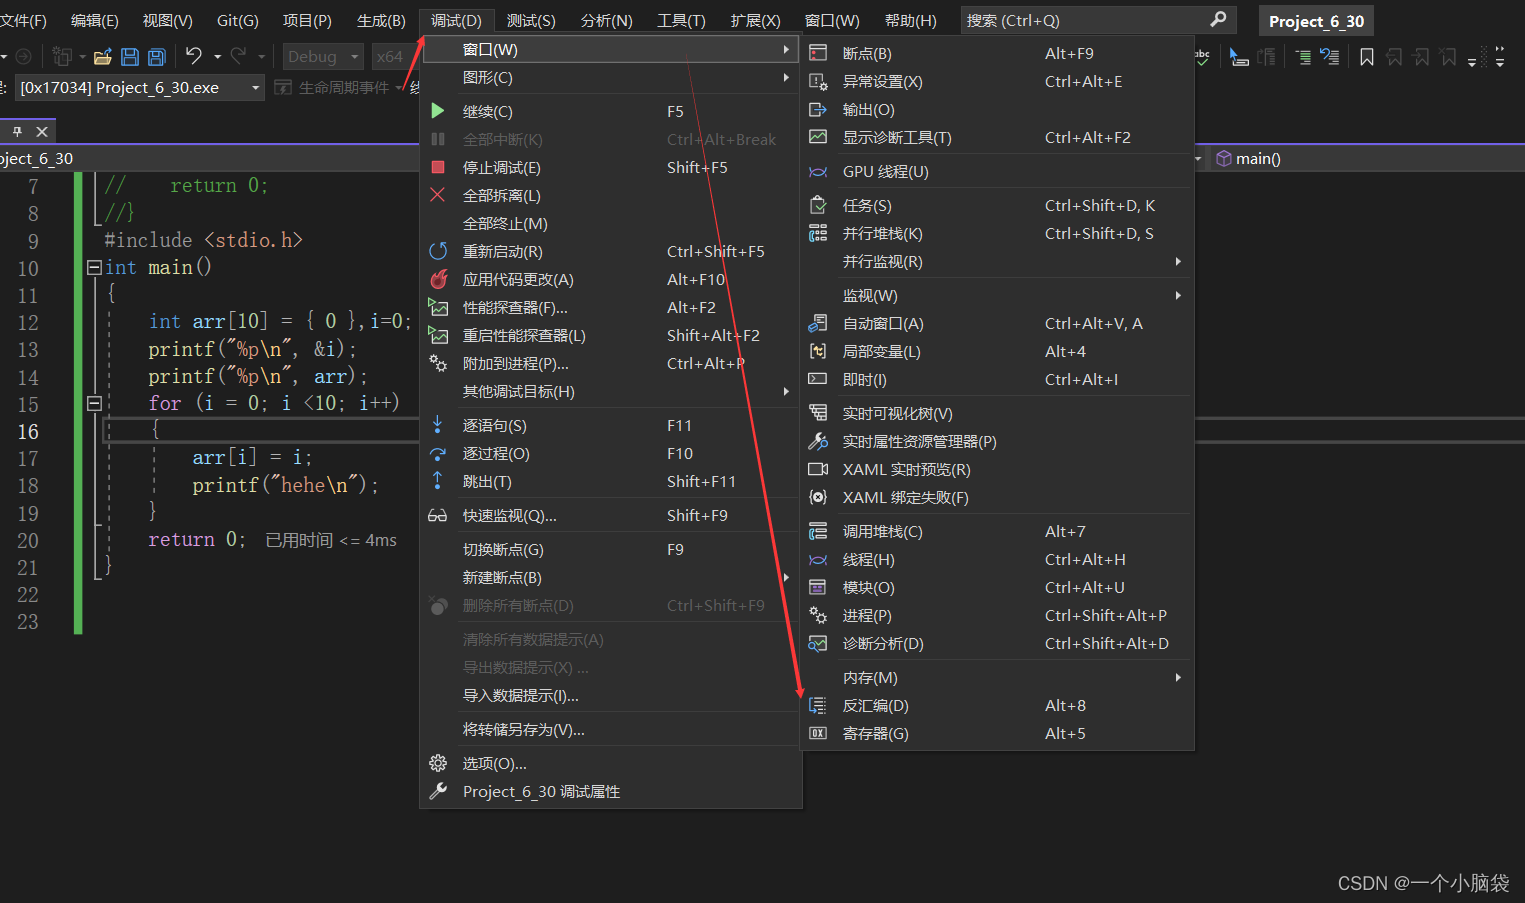
Then you can switch to assembly code
3.3.5 View register information
You can view the usage information of registers in the current operating environment
4. Conclusion
In the process of writing programs, we will encounter many bugs. We have to summarize and overcome difficulties.
You must be proficient in debugging skills; usually write code, debug more, dare to debug, and locate problems in order to make progress. What I write here are some simple debugging methods, which must be mastered.