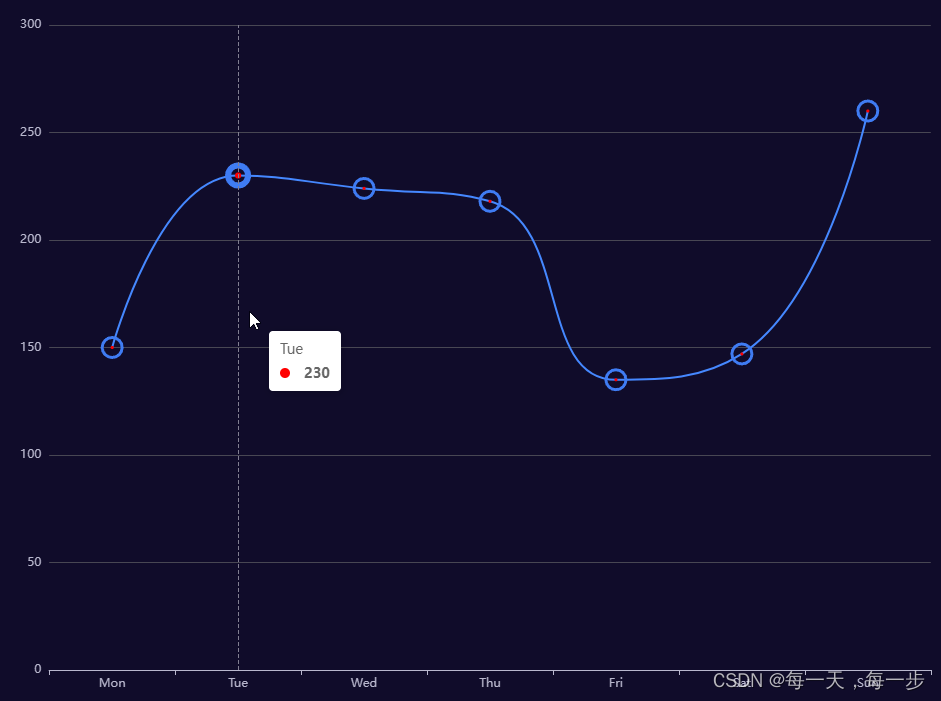
The symbolSize in the series sets the size of the dot, the color in the itemStyle sets the color of the dot, and the outer circle is implemented using border attributes, namely borderWidth and borderColor:
option = {
  tooltip: {
    trigger: 'axis'
  },
  xAxis: {
    type: 'category',
    data: ['Mon', 'Tue', 'Wed', 'Thu', 'Fri', 'Sat', 'Sun']
  },
  yAxis: {
    type: 'value'
  },
  series: [
    {
      type: 'line',
      smooth: true,
      lineStyle: { color: '#3f7cf3', width: 2 },
      symbolSize: 3, // symbol大小
      itemStyle: {
        normal: {
          color: 'red', // 中心圆点及hover时提示框中数值前面的圆点的颜色
          borderWidth: 20, // symbol边框
          borderColor: '#3f7cf3' // symbol边框颜色
        }
      },
      data: [150, 230, 224, 218, 135, 147, 260]
    }
  ]
};
Effect: