In articles 25 and 27, the master-standby switchover process is introduced. Through the explanation of these contents, you should already be very clear: in the dual-M architecture of one master and one backup, the master-standby switchover only needs to switch the client traffic to the standby database; while in the one-master-multiple-slave In addition to switching the client traffic to the standby database, it is also necessary to connect the slave database to the new master database.
There are two scenarios for active/standby switchover, one is active switchover and the other is passive switchover. Among them, passive switching is often initiated by the HA system because of a problem with the main library.
This also leads to the question we are going to discuss today: how to judge that there is a problem with a main library?
You will definitely say, this is very simple, just connect to MySQL and execute a select 1. But if select 1 returns successfully, does it mean that the main library is fine?
select 1 judgment
In fact, the successful return of select 1 only means that the process of this library is still there, and it does not mean that the main library is fine. Now, let's look at this scenario.
set global innodb_thread_concurrency=3;

CREATE TABLE `t` (
`id` int(11) NOT NULL,
`c` int(11) DEFAULT NULL,
PRIMARY KEY (`id`)
) ENGINE=InnoDB;

insert into t values(1,1)
The purpose of setting the innodb_thread_concurrency parameter is to control the upper limit of InnoDB's concurrent threads. That is to say, once the number of concurrent threads reaches this value, when InnoDB receives a new request, it will enter a waiting state until a thread exits.
Here, I set innodb_thread_concurrency to 3, which means that InnoDB only allows 3 threads to execute in parallel. In our example, the sleep(100) in the first three sessions makes all three statements in the "execution" state to simulate a large query.
As you can see, in session D, select 1 can be executed successfully, but the query table t will be blocked. In other words, if we use select 1 to detect whether the instance is normal at this time, no problem can be detected.
In InnoDB, the default value of the parameter innodb_thread_concurrency is 0, which means that the number of concurrent threads is not limited. However, it is definitely not possible to limit the number of concurrent threads. Because the number of CPU cores of a machine is limited, if all the threads rush in, the cost of context switching will be too high.
Therefore, under normal circumstances, we recommend setting innodb_thread_concurrency to a value between 64~128. At this time, you must have doubts, what is the purpose of setting the upper limit of concurrent threads to 128? The number of concurrent connections online can easily reach thousands.
The reason for this question is to confuse concurrent connections and concurrent queries.
Concurrent connections and concurrent queries are not the same concept. The thousands of connections you see in the result of show processlist refer to concurrent connections. The "currently executing" statement is what we call a concurrent query.
The impact of thousands of concurrent connections is not significant, it just takes up more memory. What we should focus on is concurrent queries, because too high a concurrent query is a CPU killer. This is why we need to set the innodb_thread_concurrency parameter.
Then, you may still think of the hot update and deadlock detection we mentioned in the seventh article. If you set innodb_thread_concurrency to 128, then when the problem of hot update in the same line occurs, will it be replaced soon? 128 is exhausted, so the whole system will hang up?
In fact, after the thread enters the lock waiting, the count of concurrent threads will be reduced by one, that is to say, threads waiting for row locks (including gap locks) are not counted in 128.
It makes sense for MySQL to be designed this way. Because the thread waiting for the lock no longer eats the CPU; more importantly, it must be designed in this way to avoid the entire system from being locked.
why? Assuming that threads waiting for locks also account for the count of concurrent threads, you can imagine this scenario:
1. Thread 1 executes begin; update t set c=c+1 where id=1, starts transaction trx1, and then maintains this state. At this time, the thread is in an idle state and is not counted as a concurrent thread.
2. Thread 2 to thread 129 all execute update t set c=c+1 where id=1; due to waiting for row lock, they enter the waiting state. In this way, there are 128 threads in the waiting state;
3. If the count of threads in the lock waiting state does not decrease by one, InnoDB will consider that the number of threads is full, and will prevent other statements from entering the engine to execute, so that thread 1 cannot submit the transaction. And the other 128 threads are in the lock waiting state, and the whole system is blocked.
Figure 2 below shows this state.
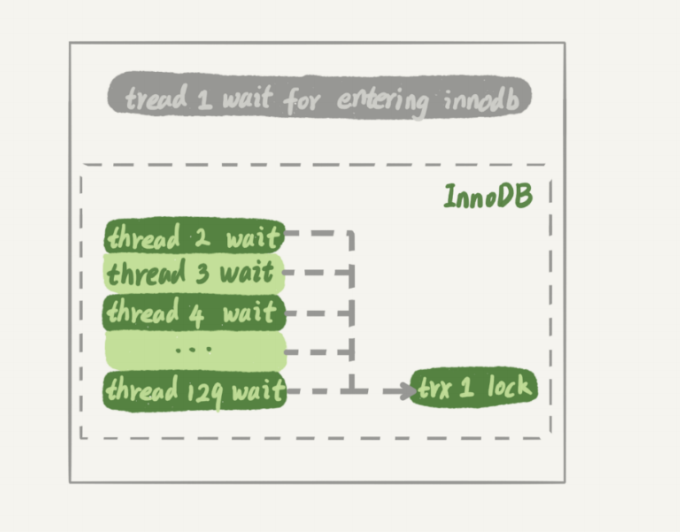
At this time, InnoDB cannot respond to any requests, and the entire system is locked. Moreover, since all threads are in the waiting state, the CPU occupied at this time is 0, which is obviously unreasonable. Therefore, we say that in the design of InnoDB, when a process enters a lock waiting situation, the design of reducing the count of concurrent threads by 1 is reasonable and necessary.
Although the thread waiting for the lock is not counted in the concurrent thread count, if it is actually executing the query, such as select sleep(100) from t in the first three transactions in the above example, it still needs to be counted as the concurrent thread counted.
In this example, the statement being executed at the same time exceeds the set value of innodb_thread_concurrency. At this time, the system is actually not working, but the system is considered to be normal by selecting 1 to detect the system.
Therefore, we need to modify the judgment logic of using select 1.
Check table judgment
In order to be able to detect system unavailability caused by too many concurrent threads of InnoDB, we need to find a scenario of accessing InnoDB. The general approach is to create a table in the system library (mysql library), such as named health_check, and only put one row of data in it, and then execute it regularly:
mysql> select * from mysql.health_check; Using this method, we can detect situations where the database is unavailable due to too many concurrent threads.
However, we will immediately encounter the next problem, that is, when the space is full, this method will become unworkable again.
We know that the update transaction needs to be written to the binlog, and once the space occupancy rate of the disk where the binlog is located reaches 100%, all update statements and commit statements submitted by the transaction will be blocked. However, the system can still read data normally at this time.
Therefore, we still improve this monitoring statement. Next, let's take a look at the effect of changing the query statement to an update statement.
update judgment
Since it needs to be updated, it is necessary to put a meaningful field. A common practice is to put a timestamp field to indicate the time when the last detection was performed. This update statement looks like:
mysql> update mysql.health_check set t_modified=now();The detection of node availability should include the main library and the standby library. If the update is used to detect the main database, then the standby database should also be updated.
However, the detection of the standby database also needs to write binlog. Since we usually design the master-slave relationship between database A and B as a double M structure, the detection command executed on standby database B must also be sent back to master database A.
However, if both the master database A and the standby database B use the same update command, row conflicts may occur, which may cause the synchronization of the master and slave to stop. Therefore, it seems that the mysql.health_check table cannot have only one row of data.
In order to prevent conflicts between the updates between the master and the backup, we can store multiple rows of data in the mysql.health_check table, and use the server_id of A and B as the primary key.
mysql> CREATE TABLE `health_check` (
`id` int(11) NOT NULL,
`t_modified` timestamp NOT NULL DEFAULT CURRENT_TIMESTAMP,
PRIMARY KEY (`id`)
) ENGINE=InnoDB;

/* 检测命令 */
insert into  mysql.health_check(id, t_modified) values (@@server_id, now()) on duplicate  key update t_modified=now();
Since MySQL stipulates that the server_id of the master database and the standby database must be different (otherwise an error will be reported when creating the master-standby relationship), this ensures that the detection commands of the master and standby databases will not conflict.
Update judgment is a relatively common solution, but there are still some problems. Among them, "slow judgment" has always been a headache for DBAs.
You must be wondering, if the update statement fails or times out, you can initiate a master-standby switchover. Why is there still a problem of slow judgment?
In fact, what is involved here is the issue of server IO resource allocation.
First, all detection logic needs a timeout N. Execute an update statement, if it does not return after more than N seconds, the system is considered unavailable.
You can imagine a scenario where the IO utilization of the log disk is already 100%. At this time, the response of the entire system is very slow, and a master/standby switchover is required.
But you need to know that 100% IO utilization means that the IO of the system is working, and each request has the opportunity to obtain IO resources and perform its own tasks. The update command used in our detection requires very few resources, so it may be submitted successfully when the IO resource is obtained, and it will be returned to the detection system before the timeout time N seconds is reached.
Checking the system, the update command did not time out, so the conclusion of "the system is normal" was obtained.
That is to say, at this time, the normal SQL statement on the business system has been executed very slowly, but the DBA went up to see that the HA system is still working normally, and thinks that the main database is now available.
The fundamental reason for this phenomenon is that all the methods we mentioned above are based on external detection. There is a natural problem with external detection, which is randomness.
Because external detection requires regular polling, the system may have a problem, but we need to wait until the next detection initiates the execution statement before we may find the problem. Moreover, if your luck is not good enough, you may not be able to find it in the first poll, which will lead to the problem of slow switching.
So, next, I'm going to introduce you to another way to find database problems inside MySQL.
internal statistics
Regarding the issue of disk utilization, if MySQL can tell us the time of each internal IO request, then our method of judging whether there is a problem with the database will be much more reliable.
In fact, the performance_schema library provided by MySQL version 5.6 and later counts the time of each IO request in the file_summary_by_event_name table.
There are many rows of data in the file_summary_by_event_name table. Let's take a look at the row event_name='wait/io/file/innodb/innodb_log_file' first.

This line in the figure indicates that the statistics are the writing time of the redo log, and the first column EVENT_NAME indicates the type of statistics.
The next three sets of data show the time statistics of redo log operations.
The first group of five columns is the statistics of all IO types. Among them, COUNT_STAR is the total number of all IOs, and the next four columns are specific statistical items in picoseconds; the prefixes SUM, MIN, AVG, and MAX, as the name implies, refer to the sum, minimum, average, and maximum.
The second group of six columns is the statistics of read operations. The last column SUM_NUMBER_OF_BYTES_READ counts the total number of bytes read from the redo log.
The third group of six columns counts write operations.
The final fourth set of data is the statistics of other types of data. In the redo log, you can think of them as fsync statistics.
In the file_summary_by_event_name table of the performance_schema library, binlog corresponds to the line event_name = "wait/io/file/sql/binlog". The statistical logic of each field is exactly the same as that of the redo log. Here, I won't go into details.
Because every time we operate the database, performance_schema needs to additionally count these information, so there is a performance loss when we turn on this statistical function.
The result of my test is that if all the performance_schema items are turned on, the performance will drop by about 10%. Therefore, I suggest that you only open the items you need for statistics. You can turn on or off the statistics of a specific item through the following methods.
If you want to enable the time monitoring of redo log, you can execute this statement:
mysql>update setup_instruments set ENABLED='YES', Timed='YES' where name like '%wait/io/file/innodb/innodb_log_file%';Suppose, now you have enabled the two statistical information of redo log and binlog, how to use this information for instance status diagnosis?
Very simple, you can judge whether there is a problem with the database by the value of MAX_TIMER. For example, you can set a threshold. A single IO request that takes more than 200 milliseconds is abnormal, and then use a statement like the following as the detection logic.
mysql> select event_name,MAX_TIMER_WAIT FROM performance_schema.file_summary_by_event_name where event_name in ('wait/io/file/innodb/innodb_log_file','wait/io/file/sql/binlog') and MAX_TIMER_WAIT>200*1000000000;After finding an exception, get the information you need, and then pass the following statement:
mysql> truncate table performance_schema.file_summary_by_event_name;Clear the previous statistics. In this way, if the abnormality occurs again in the subsequent monitoring, the monitoring cumulative value can be added.
summary
Today, several methods for detecting the health status of a MySQL instance are introduced, as well as the problems and evolution logic of various methods.
After reading it, you may think that methods such as select 1 have been eliminated, but in fact, MHA (Master High Availability), which is very widely used, is used by default.
Another optional method in MHA is to only connect, that is, "if the connection is successful, the main library is considered to be fine". But as far as I know, very few people choose this method.
In fact, every improvement plan will increase additional losses, and you cannot use "right or wrong" to make a direct judgment. You need to make trade-offs based on the actual business situation.
My personal preference is to give priority to updating the system tables, and then cooperate with adding information for detecting performance_schema.
Supplement:
If you use the scheme of GTID and other points for read-write separation, what will happen when you do DDL for a large table?
Assume that this statement takes 10 minutes to execute on the main database, and it takes 10 minutes to transmit it to the standby database after submission (a typical large transaction). Then, when the GTID of the transaction submitted after the main database DDL is checked, it will wait 10 minutes before it appears.
In this way, the read-write separation mechanism will time out within 10 minutes, and then go to the main library.
This kind of expected operation should ensure that the main library can support all business queries during the off-peak period of business, and then switch all read requests to the main library, and then do DDL on the main library. After the standby database delays to catch up, switch the read request back to the standby database.
Through this thinking question, I mainly want to focus on the impact of large events on the equipotential scheme.
Of course, it is also a good choice to use the gh-ost solution to solve this problem.