The development of business intelligence BI has a strong correlation with the growth of data, and current technologies and applications such as artificial intelligence, big data, cloud computing, Internet of Things, and the Internet all promote the growth of data, so business intelligence BI also With the growth of data comes into play in enterprises of all walks of life.
Business Intelligence (BI) is a technology and tool used to collect, analyze and interpret data inside and outside an organization. It is designed to help corporate management and decision makers understand operations, identify trends, evaluate performance, predict outcomes, and make strategic decisions based on this information.
Business intelligence BI-Pieco data visualization analysis platform
Business intelligence encompasses many aspects, including data warehousing, data mining, reporting and analysis. The following are the main components of business intelligence:
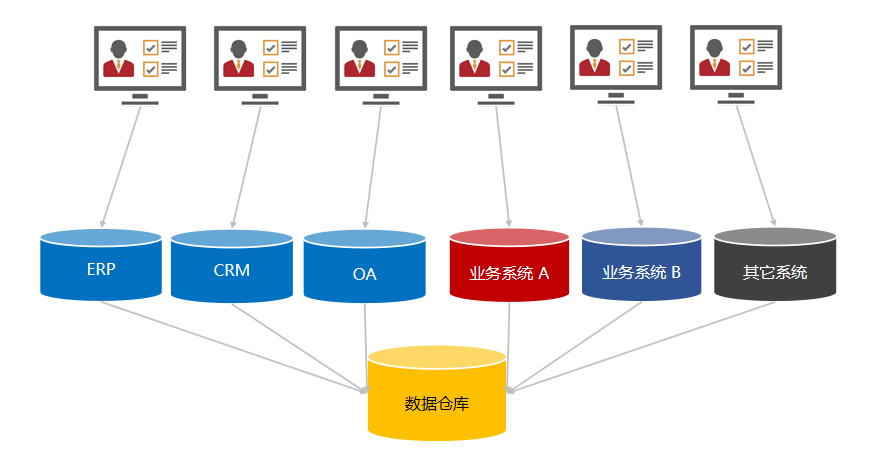
Data Acquisition: A business intelligence system builds a comprehensive data set by acquiring data from internal and external sources. These data sources can be internal databases, CRM systems, ERP systems, etc., or external market research data, social media data, etc.
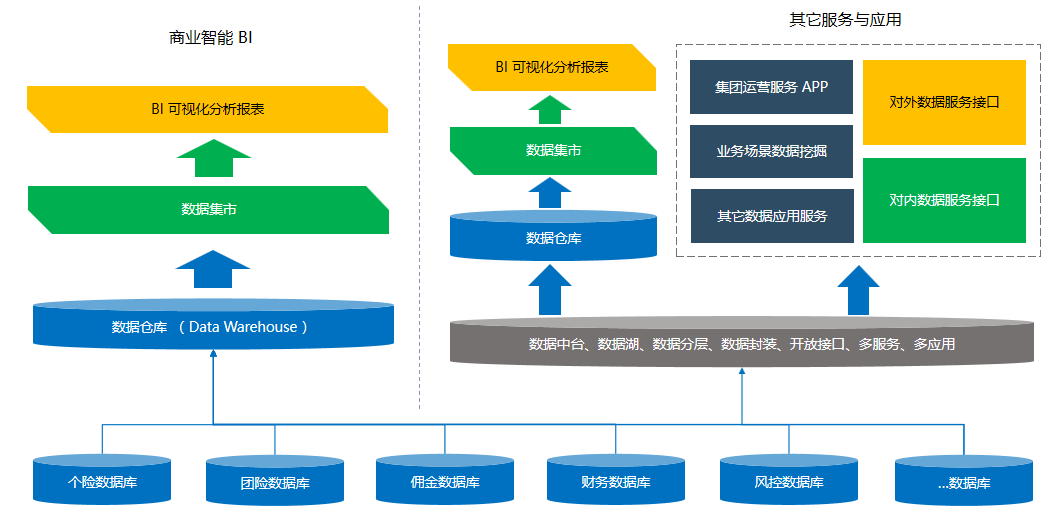
Data Warehouse-Pieco Data Business Intelligence BI Data Visualization Analysis Platform
Data integration: Data integration is the cleaning, processing and integration of data from different data sources to ensure the accuracy and consistency of the data. This process includes operations such as data cleansing, data transformation, and data integration.
Data storage: The business intelligence system will store the organized data in the data warehouse for subsequent analysis and report generation. A data warehouse is a database used to store and organize large amounts of structured and unstructured data.
Data Analysis: Business intelligence systems utilize various analytical techniques and algorithms to mine hidden information and trends in data. These analytical techniques include data mining, statistical analysis, machine learning, etc. Through data analysis, enterprises can obtain insights about market trends, customer behavior, product sales, etc., and provide reference for decision makers.

Data Analysis-Pico Data Visualization Analysis Platform
Report generation: The business intelligence system can generate various forms of reports and visual charts based on the results of data analysis. These reports can be used to display information such as key business indicators, performance evaluation, market trends, etc., to help decision makers understand the operation of the enterprise.

Management Cockpit - Pico Data Visualization Analysis Platform
The scope of application of business intelligence is very wide. It can be applied in all walks of life, including sales, marketing, finance, supply chain management and other fields. Through business intelligence, enterprises can achieve better business management and decision-making, improve efficiency and competitiveness.
In general, business intelligence BI can promote the work of most employees in the enterprise. Only efficient and agile data visualization can reduce costs and increase efficiency for enterprises to a large extent. However, although business intelligence BI is of high value to different groups of people in the enterprise, the people who need business intelligence BI most are the top management personnel of the enterprise. They use business intelligence BI and data visualization to meet the needs of different groups of people in the enterprise for data query, analysis and exploration, and obtain information and knowledge, thereby providing data basis and decision support for management and business.