Table of contents
renderings
change method
- The original YOLOv7 turned off this drawing code, just open it
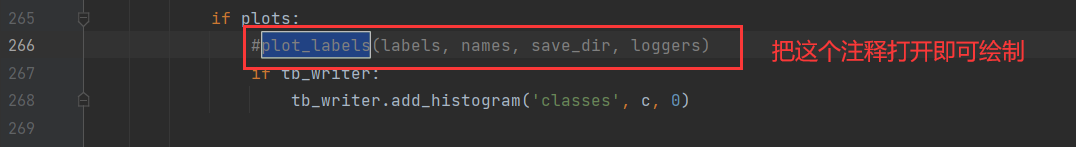
train.pyPress and hold the shortcut key Ctrl+Fto search and locate the location as shown in plot_labelsthe figure
explain
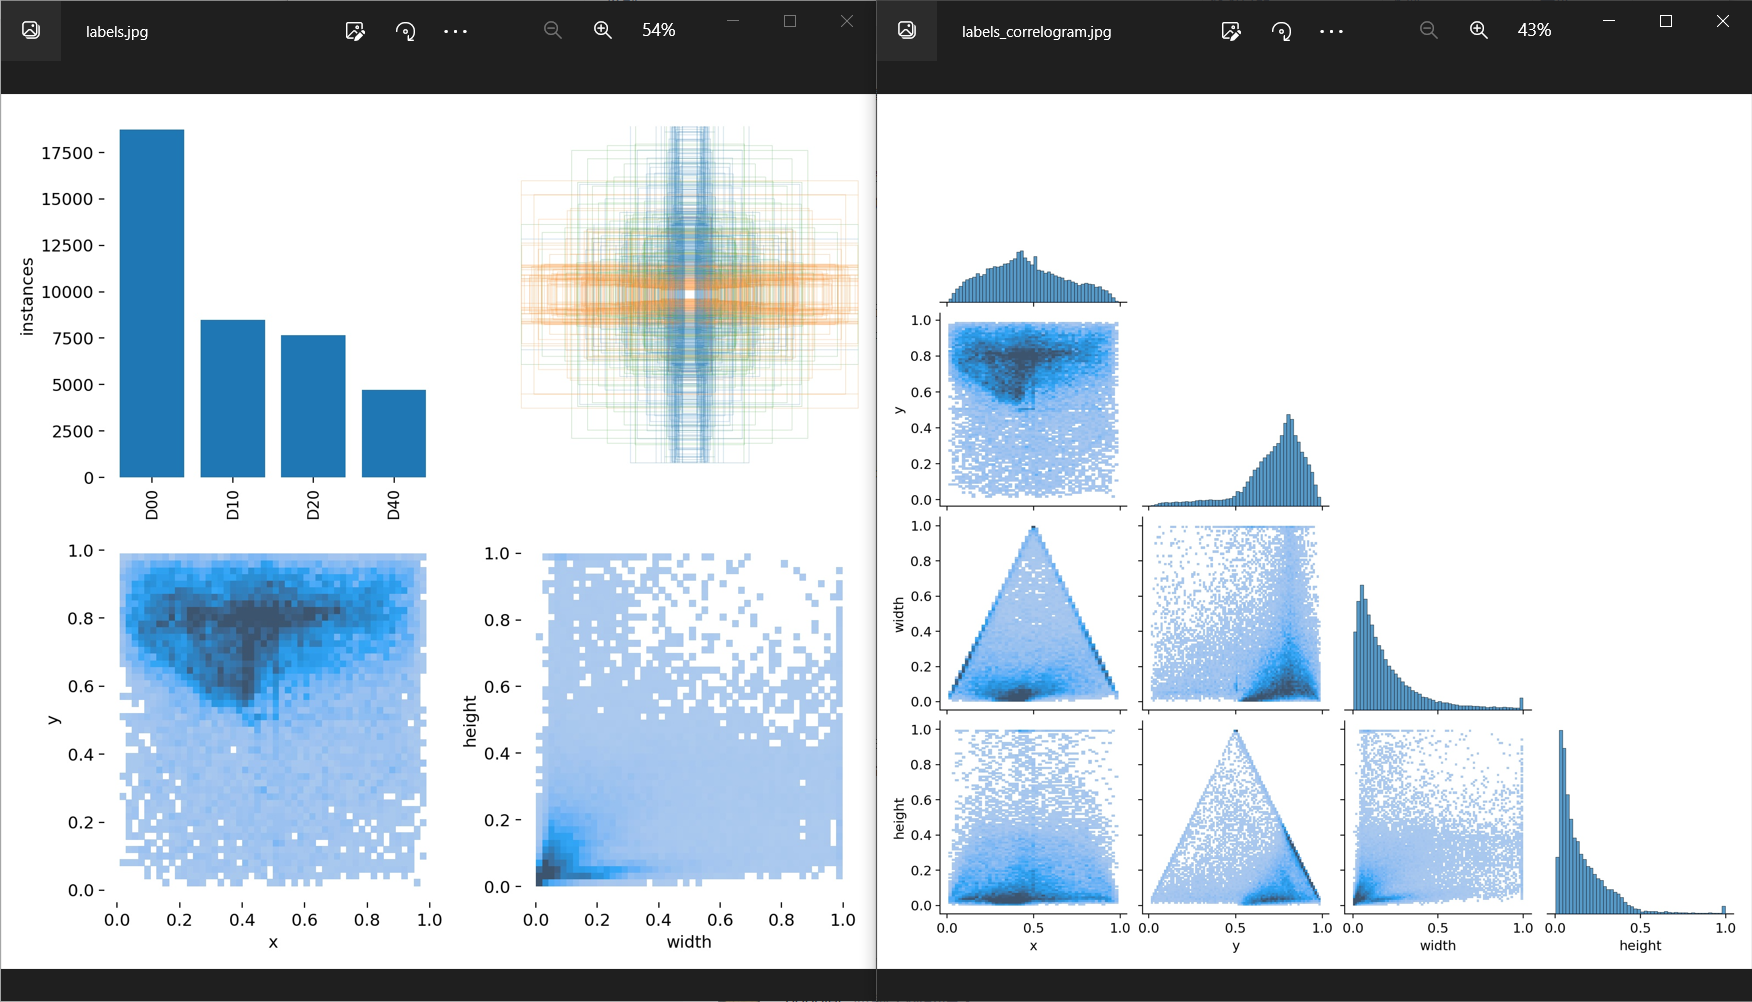
labels.jpg: Statistical histogram of the number of each category of training set data (upper left corner), set the x and y center values of all boxes at the same position to see the length and width of each label box of each training set data (upper right corner), draw x , y variable histogram to show the distribution of the data set (bottom left corner), draw width, height variable histogram to show the data set distribution (bottom right corner).
labels_correlogram.jpg: Summarize the labels of the training set data, and draw the relationship diagram between the four variables of the training set data labels x, y, width, height (linear or nonlinear, whether there is a more obvious correlation)