
1. Background
In one of our applications, occasional GC time is too long (about 4 hours apart), resulting in performance fluctuations (the interface takes up to 3 seconds or more). After investigation, it is found that the G1 garbage collector parameter configuration is improper and the MySQL connection exceeds the idle time to recycle, resulting in a large number of phantom references, causing G1 to perform mixed GC in the old generation, and the marking phase takes too long. The following is the analysis and summary of this problem.
In addition, because this application uses redis cache to cache hotspot data for the database for a period of time, it will easily be idle after the business starts to create database links, and it is easy to be judged by the database connection pool to be idle for too long and be cleaned up.
application background
JDK1.8 , mysql-connector-java-5.1.30, commons-dbcp-1.4, spring-4.3.20.RELEASE
Hardware: 8-core 16GB;
Summary of JVM startup parameters:
-Xms9984m -Xmx9984m -XX:MaxMetaspaceSize=512m -XX:MetaspaceSize=512m -XX:MaxDirectMemorySize=512m -XX:ParallelGCThreads=8 -XX:CICompilerCount=4 -XX:ConcGCThreads=4 -
server -XX:+UnlockExperimentalVMOptions -XX:+UseG1GC -XX:G1HeapRegionSize=32M -XX:SurvivorRatio=10 -XX:MaxTenuringThreshold=5 -XX:InitiatingHeapOccupancyPercent=45 -
XX:G1ReservePercent=20 -XX:G1MixedGCLiveThresholdPercent=80 -XX:MaxGCPauseMillis=100 -XX:+ExplicitGCInvokesConcurrent -
XX:+PrintGCDetails -XX:+PrintReferenceGC -XX:+PrintGCDateStamps -XX:+PrintHeapAtGC -Xloggc:/export/Logs/app/tomcat7-gc.log
dbcp configuration:
maxActive=20
initialSize=10
maxIdle=10
minIdle=5
minEvictableIdleTimeMillis=180000
timeBetweenEvictionRunsMillis=20000
validationQuery=select 1
Configuration instructions:
maxActive=20: The maximum number of connections that can exist in the connection pool at the same time, the configuration is 20.
`initialSize=10: The number of connections created when the data source is initialized, the configuration is 10.
maxIdle=10: The maximum number of idle connections in the connection pool, that is to say, when the number of connections in the connection pool exceeds 10, the excess connections will be released, and the configuration is 10.
minIdle=5: The minimum number of idle connections in the connection pool, that is to say, when the number of connections in the connection pool is less than 5, new connections will be automatically added to the connection pool, and the configuration is 5.
`minEvictableIdleTimeMillis=180000: The minimum idle time of the connection in the connection pool. Here it is configured as 3 minutes, which means that the connection in the connection pool will be removed after 3 minutes of idleness, so as to avoid long-term occupation of resources.
timeBetweenEvictionRunsMillis=20000: The running time interval of the maintenance thread in the connection pool, in milliseconds. The configuration here is 20 seconds, which means that the connection pool will check every 20 seconds whether the connection in the connection pool has been idle for too long and needs to be closed.
validationQuery=select 1: A SQL statement to verify whether the connection is valid. A simple SELECT 1 query is used here.
Key words
java G1GC, G1 parameter tuning, G1 STW takes too long, com.mysql.jdbc.NonRegisteringDriver, ConnectionPhantomReference, PhantomReference, GC ref-proc spent too much time, GC remark, Finalize Marking
2. Troubleshooting
Availability alarm
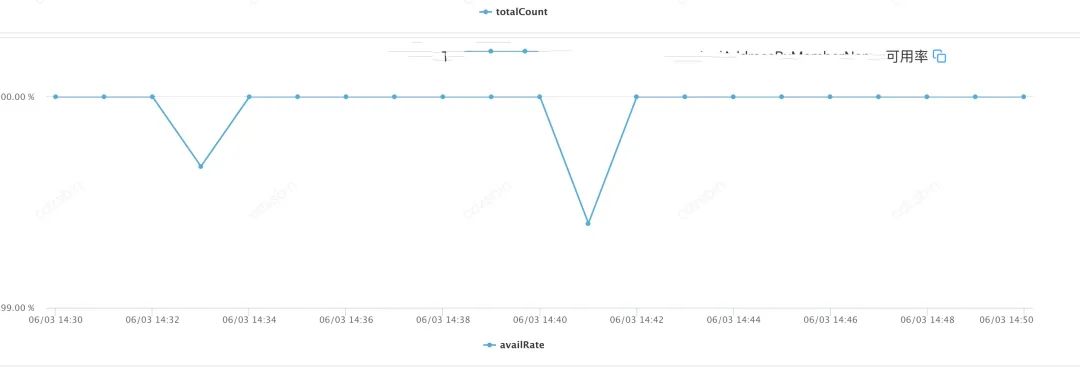
log query
Query the local log, find the interface log of the downstream timeout, and find the relevant IP: 11.#.#.201
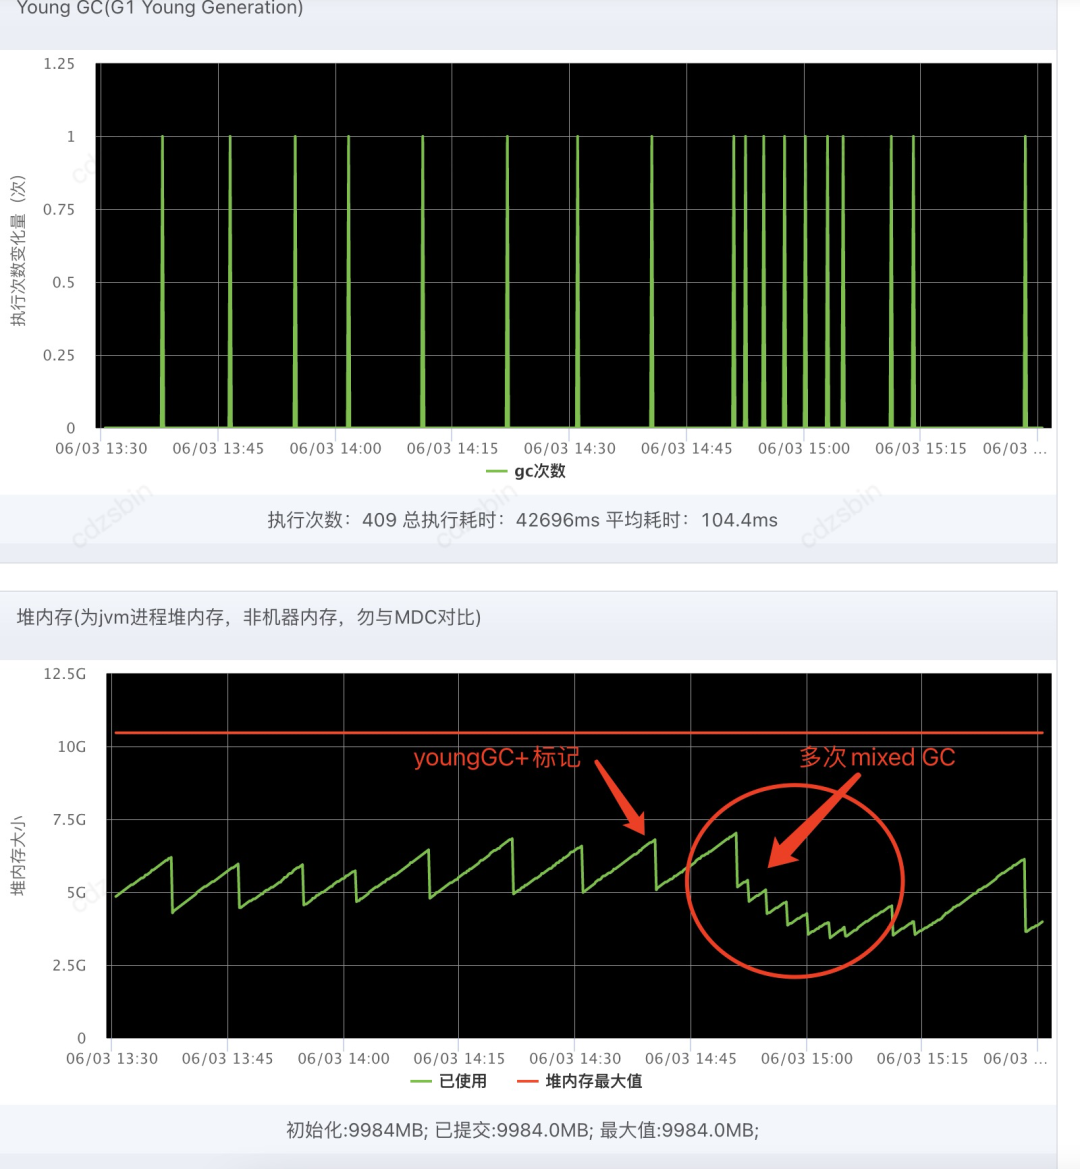
View jvm monitoring
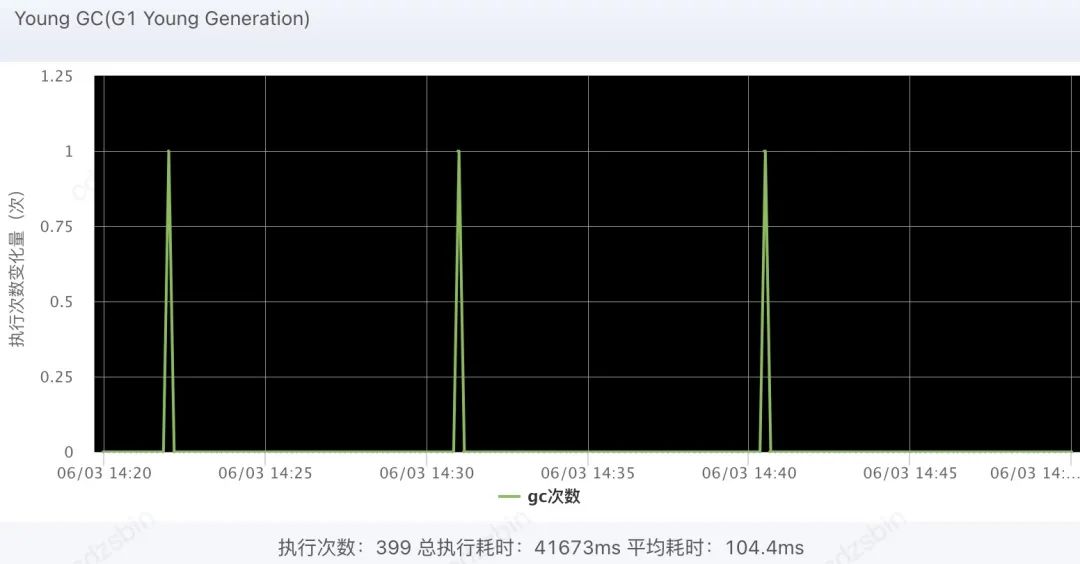
There is a problem here, because the monitoring of the jvm by the system tool ump only focuses on young gc & full gc, omitting the mixed GC of G1, resulting in the problem that the GC is too long to be found directly through system monitoring. Later, I downloaded the gc log, and finally analyzed the monitoring results of the GC time exceeding 3.7 seconds, which is also the root of the problem.
3. Problem Analysis
GC log analysis
2023-06-03T14:40:31.391+0800: 184748.113: [GC pause (G1 Evacuation Pause) (young) (initial-mark), 0.1017154 secs]
   [Parallel Time: 70.3 ms, GC Workers: 6]
      [GC Worker Start (ms): Min: 184748113.5, Avg: 184748113.6, Max: 184748113.6, Diff: 0.1]
      [Ext Root Scanning (ms): Min: 1.9, Avg: 2.1, Max: 2.2, Diff: 0.3, Sum: 12.3]
      [Update RS (ms): Min: 9.7, Avg: 9.9, Max: 10.4, Diff: 0.7, Sum: 59.6]
         [Processed Buffers: Min: 12, Avg: 39.5, Max: 84, Diff: 72, Sum: 237]
      [Scan RS (ms): Min: 0.1, Avg: 0.7, Max: 1.2, Diff: 1.1, Sum: 4.0]
      [Code Root Scanning (ms): Min: 0.0, Avg: 0.0, Max: 0.0, Diff: 0.0, Sum: 0.0]
      [Object Copy (ms): Min: 56.9, Avg: 57.5, Max: 57.7, Diff: 0.8, Sum: 344.8]
      [Termination (ms): Min: 0.0, Avg: 0.0, Max: 0.0, Diff: 0.0, Sum: 0.0]
         [Termination Attempts: Min: 1, Avg: 1.0, Max: 1, Diff: 0, Sum: 6]
      [GC Worker Other (ms): Min: 0.0, Avg: 0.0, Max: 0.0, Diff: 0.0, Sum: 0.1]
      [GC Worker Total (ms): Min: 70.1, Avg: 70.1, Max: 70.2, Diff: 0.1, Sum: 420.9]
      [GC Worker End (ms): Min: 184748183.7, Avg: 184748183.7, Max: 184748183.7, Diff: 0.0]
   [Code Root Fixup: 0.0 ms]
   [Code Root Purge: 0.0 ms]
   [Clear CT: 0.4 ms]
   [Other: 31.0 ms]
      [Choose CSet: 0.0 ms]
      [Ref Proc: 30.1 ms]
      [Ref Enq: 0.1 ms]
      [Redirty Cards: 0.2 ms]
      [Humongous Register: 0.0 ms]
      [Humongous Reclaim: 0.0 ms]
      [Free CSet: 0.1 ms]
   [Eden: 1760.0M(1760.0M)->0.0B(2080.0M) Survivors: 192.0M->224.0M Heap: 6521.7M(9984.0M)->4912.0M(9984.0M)]
Heap after GC invocations=408 (full 0):
 garbage-first heap   total 10223616K, used 5029872K [0x0000000570000000, 0x00000005720009c0, 0x00000007e0000000)
  region size 32768K, 7 young (229376K), 7 survivors (229376K)
 Metaspace       used 112870K, capacity 115300K, committed 115968K, reserved 1150976K
  class space    used 12713K, capacity 13380K, committed 13568K, reserved 1048576K
}
 [Times: user=0.45 sys=0.01, real=0.10 secs]
2023-06-03T14:40:31.493+0800: 184748.215: [GC concurrent-root-region-scan-start]
2023-06-03T14:40:31.528+0800: 184748.251: [GC concurrent-root-region-scan-end, 0.0359052 secs]
2023-06-03T14:40:31.528+0800: 184748.251: [GC concurrent-mark-start]
2023-06-03T14:40:31.623+0800: 184748.345: [GC concurrent-mark-end, 0.0942951 secs]
2023-06-03T14:40:31.624+0800: 184748.347: [GC remark 2023-06-03T14:40:31.624+0800: 184748.347: [Finalize Marking, 0.0003013 secs] 2023-06-03T14:40:31.625+0800: 184748.347: [GC ref-proc, 3.7471488 secs] 2023-06-03T14:40:35.372+0800: 184752.094: [Unloading, 0.0254883 secs], 3.7778434 secs]
 [Times: user=3.88 sys=0.05, real=3.77 secs]
2023-06-03T14:40:35.404+0800: 184752.127: [GC cleanup 4943M->4879M(9984M), 0.0025357 secs]
 [Times: user=0.01 sys=0.00, real=0.00 secs]
2023-06-03T14:40:35.407+0800: 184752.129: [GC concurrent-cleanup-start]
2023-06-03T14:40:35.407+0800: 184752.130: [GC concurrent-cleanup-end, 0.0000777 secs]
{Heap before GC invocations=409 (full 0):
 garbage-first heap   total 10223616K, used 6930416K [0x0000000570000000, 0x00000005720009c0, 0x00000007e0000000)
  region size 32768K, 67 young (2195456K), 7 survivors (229376K)
 Metaspace       used 112870K, capacity 115300K, committed 115968K, reserved 1150976K
  class space    used 12713K, capacity 13380K, committed 13568K, reserved 1048576K
According to the log analysis, the G1 garbage collector has performed one youngGC and one concurrent marking.
The young GC starts at 14:40:31.391, with a pause time of 0.1017154 seconds, which is the young collection and initial-mark phase. And 6 GC worker threads executed in parallel for 70.3 milliseconds. During the GC process, there are time records and detailed information for multiple stages. The heap size was reduced from 6521M to 4912M.
Concurrent marking started at 14:40:31.493 and involved concurrent scan, mark and remark phases. After the cleanup phase, the heap size decreased from 4943M to 4879M.
Therefore, the total STW (Stop-The-World) time of the G1 garbage collector during this period is 0.10 + 3.77 = 3.87 seconds.
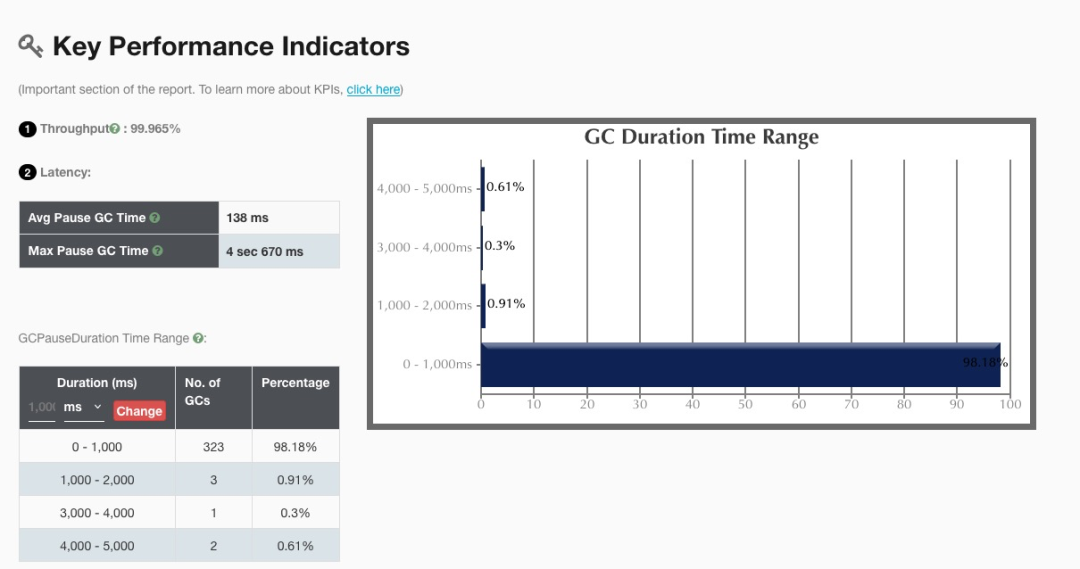
Results of Gceasy.io analysis:
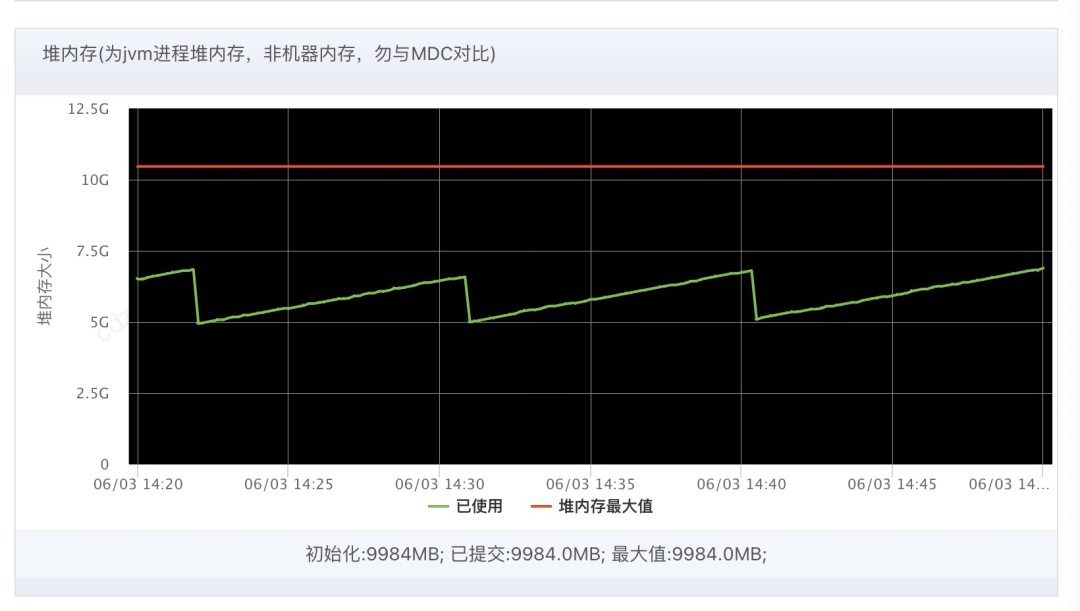
Question 1: Is heap memory recovery not obvious after youngGC?
It will be traced back to the MySQL connection pool virtual reference. This time, the GC can only GC the connection instance first, and the virtual reference used to track the recovery of the connection instance will be recycled in the next GC.
Question 2: Is the MaxGCPauseMillis of G1 strictly complied with? Why did I configure -XX:MaxGCPauseMillis=100 and the gc time still reached more than 3 seconds?
G1's -XX:MaxGCPauseMillis parameter indicates the maximum STW time of G1 GC, that is, if a single GC pause time exceeds this value, G1 will adjust its behavior as much as possible to achieve this goal. But please note that this parameter is a guiding parameter and absolute accuracy cannot be guaranteed.
In practical applications, due to the influence of application and system load conditions, heap memory size and other factors, both GC occurrence and STW time may have a certain degree of fluctuation and uncertainty. Therefore, it is possible for a single GC pause to exceed the -XX:MaxGCPauseMillis configuration value, and this situation is more likely to occur under high load or high heap memory usage.
Question 3: Why there are multiple mixed GCs in the monitoring, and the interval is so short
-XX:G1MixedGCCountTarget, the default is 8. This parameter indicates that the final mixed recovery stage will be executed 8 times, and only a part of the Region will be recovered at a time, and then the system will continue to run. After a short period of time, mixed recovery will be performed again, repeated 8 times . By performing this kind of intermittent mixed recycling, we can control the time of each mixed recycling within the pause time we need, and at the same time achieve the effect of garbage cleaning. After cleaning up 7 times, the recycling effect is satisfied, so the mixed GC is not continued.
The above is for: the MaxGCPauseMillis pause time is controlled within the expected range, so there will be multiple mixed GCs with very short intervals.
dump analysis
Through the analysis of the MAT tool, it is found that the first possible problem is: com.mysql.jdbc.NonRegisteringDriver occupies relatively large memory, as shown in the following figure:
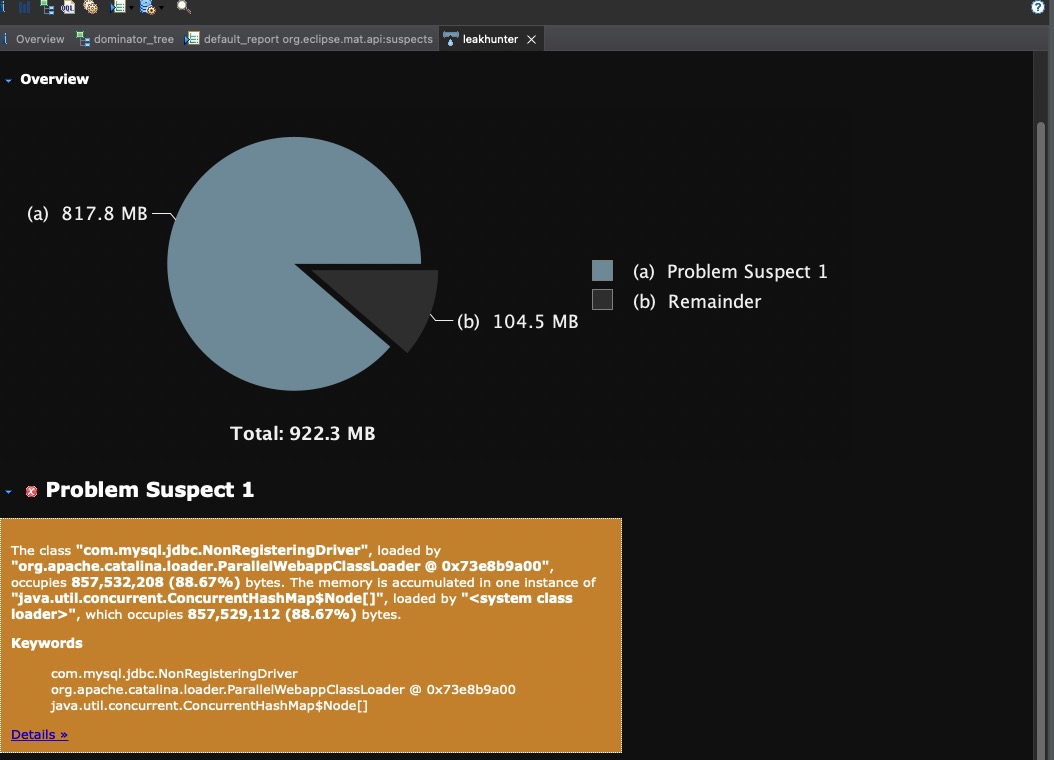
The class com.mysql.jdbc.NonRegisteringDriver, loaded by org.apache.catalina.loader.ParallelWebappClassLoader @ 0x73e8b9a00, occupies 857,532,208 (88.67%) bytes. The memory is accumulated in one instance of java.util.concurrent.ConcurrentHashMap$Node[], loaded by , which occupies 857,529,112 (88.67%) bytes.
Keywords
com.mysql.jdbc.NonRegisteringDriver
org.apache.catalina.loader.ParallelWebappClassLoader @ 0x73e8b9a00
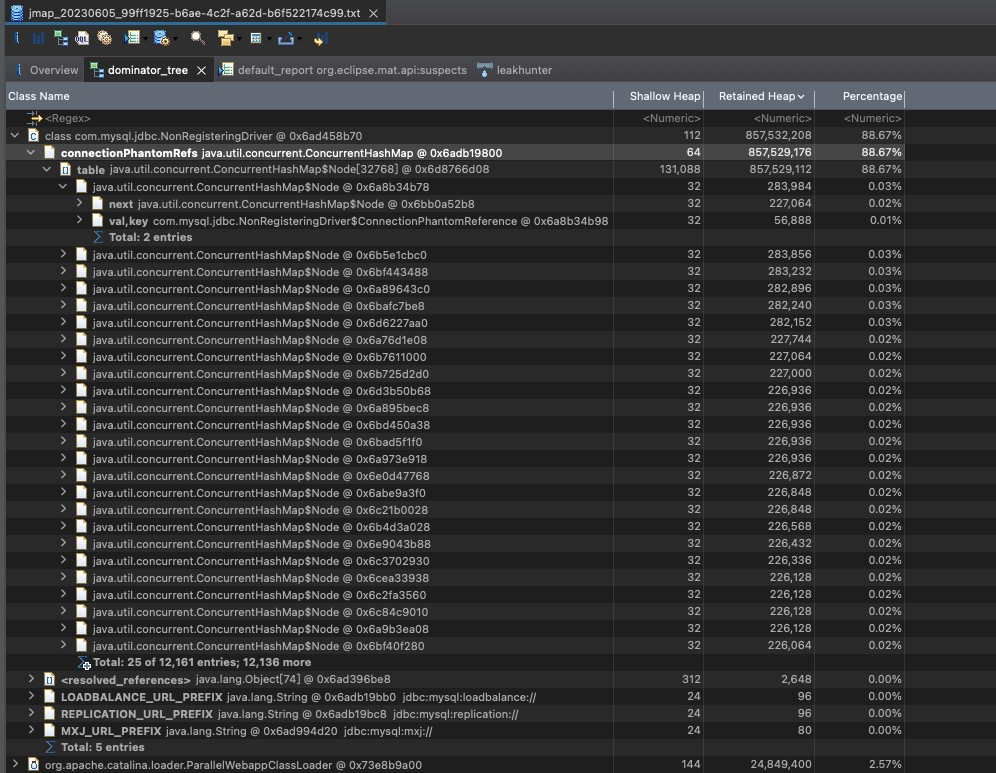
java.util.concurrent.ConcurrentHashMap$Node[]Then look at the list of large objects. The NonRegisteringDriver object does occupy a lot of memory. Among them, the member variable connectionPhantomRefs occupies the most memory, which stores the virtual reference of the database connection. Its type is ConcurrentHashMap<ConnectionPhantomReference, ConnectionPhantomReference>, accounting for as much as 88%. .
Add JVM parameters to print detailed object recovery scan logs
Add JVM parameter: -XX:+PrintReferenceGC, print the detailed recycling time of various reference objects:
PrintReferenceGC is a parameter provided by the JVM to print information about reference processing during garbage collection. When this parameter is enabled, the JVM will output some information about reference processing (Reference Processing) to standard output or the specified log file each time garbage collection is performed.
Specifically, the PrintReferenceGC parameter can help developers and system administrators better understand how various types of references in the application are handled, including Soft Reference, Weak Reference, Phantom Reference, etc. This information is useful for diagnosing memory leaks and tuning garbage collector performance.
The detailed gc log printed is as follows:
2023-06-04T10:28:52.886+0800: 24397.548: [GC concurrent-root-region-scan-start]
2023-06-04T10:28:52.941+0800: 24397.602: [GC concurrent-root-region-scan-end, 0.0545027 secs]
2023-06-04T10:28:52.941+0800: 24397.602: [GC concurrent-mark-start]
2023-06-04T10:28:53.198+0800: 24397.859: [GC concurrent-mark-end, 0.2565503 secs]
2023-06-04T10:28:53.199+0800: 24397.860: [GC remark 2023-06-04T10:28:53.199+0800: 24397.860: [Finalize Marking, 0.0004169 secs] 2023-06-04T10:28:53.199+0800: 24397.861: [GC ref-proc2023-06-04T10:28:53.199+0800: 24397.861: [SoftReference, 9247 refs, 0.0035753 secs]2023-06-04T10:28:53.203+0800: 24397.864: [WeakReference, 963 refs, 0.0003121 secs]2023-06-04T10:28:53.203+0800: 24397.865: [FinalReference, 60971 refs, 0.0693649 secs]2023-06-04T10:28:53.273+0800: 24397.934: [PhantomReference, 49828 refs, 20 refs, 4.5339260 secs]2023-06-04T10:28:57.807+0800: 24402.468: [JNI Weak Reference, 0.0000755 secs], 4.6213645 secs] 2023-06-04T10:28:57.821+0800: 24402.482: [Unloading, 0.0332897 secs], 4.6620392 secs]
 [Times: user=4.60 sys=0.31, real=4.67 secs]
2023-06-04T10:28:57.863+0800: 24402.524: [GC cleanup 4850M->4850M(9984M), 0.0031413 secs]
 [Times: user=0.01 sys=0.01, real=0.00 secs]
{Heap before GC invocations=68 (full 0):
 garbage-first heap   total 10223616K, used 7883923K [0x0000000570000000, 0x00000005720009c0, 0x00000007e0000000)
  region size 32768K, 98 young (3211264K), 8 survivors (262144K)
 Metaspace       used 111742K, capacity 114304K, committed 114944K, reserved 1150976K
  class space    used 12694K, capacity 13362K, committed 13568K, reserved 1048576K
The content of the translation log is as follows:
2023-06-04T10:28:52.886+0800: 24397.548: [GC concurrent-root-region-scan-start]:开始扫描并发根区域。
2023-06-04T10:28:52.941+0800: 24397.602: [GC concurrent-root-region-scan-end, 0.0545027 secs]:并发根区域扫描结束,持续时间为0.0545027秒。
2023-06-04T10:28:52.941+0800: 24397.602: [GC concurrent-mark-start]:开始并发标记过程。
2023-06-04T10:28:53.198+0800: 24397.859: [GC concurrent-mark-end, 0.2565503 secs]:并发标记过程结束,持续时间为0.2565503秒。
2023-06-04T10:28:53.199+0800: 24397.860: [GC remark]: G1执行remark阶段。
2023-06-04T10:28:53.199+0800: 24397.860: [Finalize Marking, 0.0004169 secs]:标记finalize队列中待处理对象,持续时间为0.0004169秒。
2023-06-04T10:28:53.199+0800: 24397.861: [GC ref-proc]: 进行引用处理。
2023-06-04T10:28:53.199+0800: 24397.861: [SoftReference, 9247 refs, 0.0035753 secs]:处理软引用,持续时间为0.0035753秒。
2023-06-04T10:28:53.203+0800: 24397.864: [WeakReference, 963 refs, 0.0003121 secs]:处理弱引用,持续时间为0.0003121秒。
2023-06-04T10:28:53.203+0800: 24397.865: [FinalReference, 60971 refs, 0.0693649 secs]:处理虚引用,持续时间为0.0693649秒。
2023-06-04T10:28:53.273+0800: 24397.934: [PhantomReference, 49828 refs, 20 refs, 4.5339260 secs]:处理final reference中的phantom引用,持续时间为4.5339260秒。
2023-06-04T10:28:57.807+0800: 24402.468: [JNI Weak Reference, 0.0000755 secs]:处理JNI weak引用,持续时间为0.0000755秒。
2023-06-04T10:28:57.821+0800: 24402.482: [Unloading, 0.0332897 secs]:卸载无用的类,持续时间为0.0332897秒。
[Times: user=4.60 sys=0.31, real=4.67 secs]:垃圾回收的时间信息,user表示用户态CPU时间、sys表示内核态CPU时间、real表示实际运行时间。
2023-06-04T10:28:57.863+0800: 24402.524: [GC cleanup 4850M->4850M(9984M), 0.0031413 secs]:执行cleanup操作,将堆大小从4850M调整为4850M,持续时间为0.0031413秒。
Among them, PhantomReference takes the longest time:
2023-06-04T10:28:53.273+0800: 24397.934: [PhantomReference, 49828 refs, 20 refs, 4.5339260 secs]: Processing the phantom reference in final reference, the duration is 4.5339260 seconds.
Source code tracking
MYSQL driver-related
Note that this source code is based on the currently dependent mysql-connector-java-5.1.30.jar, and the codes of each version have certain differences;
The place where MySQL creates a connection pool is: com.mysql.jdbc.NonRegisteringDriver#connect method:
public Connection connect(String url, Properties info) throws SQLException {
      //...省略部分代码


        Properties props = null;
        if ((props = this.parseURL(url, info)) == null) {
            return null;
        } else if (!"1".equals(props.getProperty("NUM_HOSTS"))) {
            return this.connectFailover(url, info);
        } else {
            try {
                //  获取连接主要在这里
                com.mysql.jdbc.Connection newConn = ConnectionImpl.getInstance(this.host(props), this.port(props), props, this.database(props), url);
                return newConn;
            } catch (SQLException var6) {
                throw var6;
            } catch (Exception var7) {
                SQLException sqlEx = SQLError.createSQLException(Messages.getString("NonRegisteringDriver.17") + var7.toString() + Messages.getString("NonRegisteringDriver.18"), "08001", (ExceptionInterceptor)null);
                sqlEx.initCause(var7);
                throw sqlEx;
            }
        }
    }
The com.mysql.jdbc.ConnectionImpl constructor is relatively long. After completing the parameter construction, at the end, it is found that it calls NonRegisteringDriver.trackConnection(this).
public ConnectionImpl(String hostToConnectTo, int portToConnectTo, Properties info, String databaseToConnectTo, String url) throws SQLException {
    ......
    NonRegisteringDriver.trackConnection(this);
}
The registration of the tracking task is as follows: The function of this MySQL driver source code is to realize the tracking of the MySQL database connection.
public class NonRegisteringDriver {

   //省略部分代码...


   // 连接虚引用指向map的容器声明
  protected static final ConcurrentHashMap<ConnectionPhantomReference, ConnectionPhantomReference> connectionPhantomRefs = new ConcurrentHashMap();


  // 将连接放入追踪容器中
   protected static void trackConnection(com.mysql.jdbc.Connection newConn) {
        ConnectionPhantomReference phantomRef = new ConnectionPhantomReference((ConnectionImpl)newConn, refQueue);
        connectionPhantomRefs.put(phantomRef, phantomRef);
    }


     //省略部分代码...
   }
The first line of code declares a ConcurrentHashMap container called connectionPhantomRefs, which is used to store ConnectionPhantomReference instances.
The role of the second method trackConnection is to add the new connection to the connectionPhantomRefs map. It takes a com.mysql.jdbc.Connection object as a parameter, creates a new ConnectionPhantomReference instance, and uses it and the reference queue (refQueue) to add it to the connectionPhantomRefs map.
Collectively, these two code snippets aim to implement a mechanism for tracking connections to a MySQL database through the use of phantom references. Phantom references are used to track objects that have been garbage collected by the JVM, allowing programs to perform specific tasks after objects have been removed from memory.
Connect phantom references to static inner classes
This code is part of the MySQL driver that cleans up the underlying network resources and ensures that they are released when the MySQL connection object is garbage collected.
static class ConnectionPhantomReference extends PhantomReference<ConnectionImpl> {
        private NetworkResources io;


        ConnectionPhantomReference(ConnectionImpl connectionImpl, ReferenceQueue<ConnectionImpl> q) {
            super(connectionImpl, q);


            try {
                this.io = connectionImpl.getIO().getNetworkResources();
            } catch (SQLException var4) {
            }


        }


        void cleanup() {
            if (this.io != null) {
                try {
                    this.io.forceClose();
                } finally {
                    this.io = null;
                }
            }


        }
    }
The ConnectionPhantomReference class in this MySQL driver source code is a static inner class inherited from PhantomReference<ConnectionImpl>, where ConnectionImpl is the implementation class of MySQL connection. The role of this class is to clean up the underlying network resources when the connection object is garbage collected.
The ConnectionPhantomReference constructor accepts a ConnectionImpl object and a reference queue as parameters, and calls the constructor of the parent class PhantomReference to create a phantom reference. It also obtains the network resources associated with the connection by calling the ConnectionImpl's getIO().getNetworkResources() method. If the fetch fails, no exception is thrown.
The cleanup() method is used to clean up network resources after the connection object has been garbage collected. It checks if the io property is null, and if not, calls the forceClose() method to force close the underlying network resource, eventually setting the io property to null. The whole process ensures that when the connection object is garbage collected, the underlying network resources are also properly released.
Why does MySQL use phantom references to solve the problem of IO resource recovery?
MySQL uses virtual references to solve the problem of IO resource recycling, mainly because the JDBC connection object cannot guarantee that its underlying network resources will be released immediately when the connection is closed. This can lead to prolonged occupancy of underlying network resources, eventually leading to degraded application performance or resource exhaustion.
The benefit of using phantom references is that it allows the program to perform specific tasks after the object has been removed from memory. The MySQL driver uses the reference queue mechanism provided by Java to add the virtual reference of the JDBC connection object to the queue. Once the connection object is garbage collected, the JVM enqueues it for further processing. At this time, the MySQL driver monitors the reference queue and cleans up the underlying network resources to ensure that these resources are correctly released when the connection object is garbage collected, thereby avoiding the problem of long-term occupation of the underlying network resources.
The advantage of using phantom references is that finer memory management and resource recovery can be achieved, improving the reliability and performance of applications.
So how does MySQL perform the final IO resource recovery? Is it using a scheduled task or an asynchronous daemon thread?
MySQL uses an asynchronous daemon thread to clean up the underlying network resources when performing the final IO resource recovery.
After the MySQL driver adds the virtual reference of the JDBC connection object to the reference queue, it will create a dedicated daemon thread to monitor the reference queue. When the connection object is garbage collected and added to the reference queue, the daemon thread will obtain the phantom reference of the connection object from the reference queue, and perform connection-related underlying network resource cleaning work in the background thread.
Specifically, the daemon thread obtains a set of virtual references from the reference queue in each iteration, and calls the cleanup() method of the virtual references to clean up the underlying network resources. If it is cleaned up successfully, it is removed from the mapping table; otherwise, the phantom reference is kept for the next iteration.
Since the cleanup operation is performed in a background thread, it does not block the application's main thread. At the same time, the use of asynchronous daemon threads can also avoid performance overhead and unnecessary CPU usage that may be caused by scheduled tasks.
MySQL uses asynchronous daemon threads to perform IO resource reclamation work, which ensures that underlying network resources are released in a timely manner without negatively impacting application performance.
The following is the relevant code of the daemon thread that performs IO resource reclamation in the MySQL driver:
public class NonRegisteringDriver implements java.sql.Driver {

//省略代码...


//在MySQL driver中守护线程创建及启动...
static {
    AbandonedConnectionCleanupThread referenceThread = new AbandonedConnectionCleanupThread();
    referenceThread.setDaemon(true);
    referenceThread.start();
  }

  //省略代码...
}


public class AbandonedConnectionCleanupThread extends Thread {
  private static boolean running = true;
  private static Thread threadRef = null;


  public AbandonedConnectionCleanupThread() {
    super("Abandoned connection cleanup thread");
  }


  public void run() {
    threadRef = this;
    while (running) {
      try {
        Reference<? extends ConnectionImpl> ref = NonRegisteringDriver.refQueue.remove(100);
        if (ref != null) {
          try {
            ((ConnectionPhantomReference) ref).cleanup();
          } finally {
            NonRegisteringDriver.connectionPhantomRefs.remove(ref);
          }
        }


      } catch (Exception ex) {
        // no where to really log this if we're static
      }
    }
  }


  public static void shutdown() throws InterruptedException {
    running = false;
    if (threadRef != null) {
      threadRef.interrupt();
      threadRef.join();
      threadRef = null;
    }
  }


}
This code is a class AbandonedConnectionCleanupThread in the MySQL driver, which inherits from Java's Thread class. Its function is to regularly clean up the underlying network resources of the connection object to prevent resource leaks and memory overflows. In the run() method of this class, the loop checks whether there are phantom references that need to be cleaned up. If it exists, call the cleanup() method to clean up the underlying network resource associated with the phantom reference, and delete the phantom reference from the NonRegisteringDriver.connectionPhantomRefs map.
In the MySQL driver, the key and value of the connectionPhantomRefs mapping table are objects of the ConnectionPhantomReference type, that is, the same object is used as the key and value.
The main reason for this is that when a virtual reference is added to the reference queue, the corresponding virtual reference needs to be deleted from the mapping table. If a virtual reference object is used as a key, then when deleting a virtual reference, it is necessary to traverse the entire mapping table to find the virtual reference object and delete it, which will cause unnecessary performance overhead.
On the contrary, if the virtual reference object is used as the value, then only the virtual reference object itself needs to be used to delete the entry in the mapping table, which can improve the deletion efficiency. In the trackConnection() method, create a new ConnectionPhantomReference object and store it as a key and value in the connectionPhantomRefs map. In this way, when the virtual reference is added to the reference queue, it is only necessary to delete the virtual reference object itself from the mapping table without traversing the entire mapping table.
In short, using the same object as the key and value of the mapping table can delete entries in the mapping table more efficiently, improving performance and efficiency.
PS: Introduction to java.lang.ref.ReferenceQueue#remove(long)
The function of the java.lang.ref.ReferenceQueue#remove(long) method is to remove the reference object that has been recycled from the queue. If there is no element in the queue, the method will wait until an element is added or after a specified time returns null.
The parameter of this method is the timeout time in milliseconds. If no elements are enqueued within the specified timeout, the method returns null. If the timeout is 0, the method returns immediately and does not wait for any elements to be enqueued.
Normally, programs do not need to call this method. The Java virtual machine automatically calls this method to dispose of objects that have been recycled. Only in specific cases, such as manual memory management, you need to call this method manually.
The main function of using java.lang.ref.ReferenceQueue here is to obtain the reference queue that has been recycled through remove(timeout) after the Connection is recycled by the garbage collector, and then perform post-processing.
infer
Because there are tens of thousands of objects in the static member variable of NonRegisteringDriver: connectionPhantomRefs, it proves that a large number of database connection instances have accumulated during this period and entered the following life cycle:
Create --> Idle ---> Recycle;
Doubt 1:
Because the previous connection idle time is db.minEvictableIdleTimeMillis=180000 (3 minutes), it may be the key to the problem. The normal MySQL connection idle time defaults to 8 hours.
Doubt 2:
In addition, because the application has multiple data sources, and part of the data is divided into databases, resulting in a large number of connections to the database and uneven access requests, this leads to the creation of a large number of database connection pools during peak periods, and the creation of a large number of database connection pools during low peak periods. was recycled again. There are more and more objects in com.mysql.jdbc.NonRegisteringDriver#connectionPhantomRefs, and most of them enter the old age, requiring fullGC or G1 mixedGC to recycle.
4. Solutions
Solution 1: Adjust JVM parameters
Although the root of the problem is that the MySQL link is invalid, the phantom reference takes a long time in the remark stage of gc. But there are also problems with our G1 parameter configuration: the adjustment of parameter 1 is the key to reducing the GC time this time.
Parameter 1: ParallelRefProcEnabled (parallel reference processing is enabled)
After checking the application, it is confirmed that the G1GC parameter configuration is improper, and ParallelRefProcEnabled (parallel reference processing) is not enabled. JDK8 needs to be enabled manually, and JDK9+ has been enabled by default. Causes the G1 Final Remark stage to use single-thread marking (when G1 is mixed with GC, the STW is about 2~3 seconds);
solution:
After enabling the ParallelRefProcEnabled (parallel reference processing) function, ParallelGCThreads=8 enables 8 thread marks;
Parameter 2: ParallelGCThreads (number of parallel GC threads)
The ParallelGCThreads parameter is a parameter used to specify the number of parallel garbage collection threads for the G1 garbage collector. Unlike other Java garbage collectors, the G1 garbage collector can execute multiple garbage collection threads at the same time to speed up garbage collection.
In Java 8, by default, the ParallelGCThreads parameter of the G1 garbage collector is set to the same value as the number of CPU cores, up to a maximum of 8. If your machine has more CPU cores, you can improve the efficiency of parallel garbage collection by manually tuning this parameter. For example, if your machine has 8 cores, you can set ParallelGCThreads to 8 or higher.
It should be noted that a too high ParallelGCThreads value may cause processor contention and context switching, thereby affecting the performance of the application. Therefore, when making adjustments, it should be tested and optimized according to machine specifications and actual loads to find the best parameter configuration. It is recommended to keep the default value and make appropriate adjustments after the feedback of the actual measurement results.
In addition, you can also use the -XX:+UseDynamicNumberOfGCThreads parameter to let G1 automatically adapt to the number of parallel threads. In this way, the number of threads will automatically increase or decrease according to the system load, resulting in better performance
solution:
The machine has 8 cores, and only 6C is configured at the beginning, so the number of parallel GC threads is increased to 8, or not configured, and the default is 8 cores;
Parameter 3: G1MixedGCLiveThresholdPercent (G1 mixed garbage collector survival threshold percentage)
G1MixedGCLiveThresholdPercent is a parameter used to control the mixed garbage collection of the G1 garbage collector, which determines when the mixed garbage collector is executed. This value means that when the percentage of surviving objects in an area marked as old region reaches this threshold, it will be recycled by G1 mixed GC;
If the value is set too low, it may cause frequent mixed garbage collections, which will affect the performance of the application; if it is set too high, it may cause garbage in the old generation to increase, resulting in high heap memory usage , a single STW extension.
Default: 85%;
solution:
Because the previous setting was 80, this time it is adjusted to 60. Although the frequency of mixed GC triggers is increased, because there are fewer objects at this time, the time required is also shortened;
Parameter 4: MaxTenuringThreshold (the maximum age at which the object is promoted to the old age)
MaxTenuringThreshold is a parameter used to control the time threshold for objects to survive in the Survivor area, which specifies how many times the object can be promoted to the old age after Minor GC. Specifically, if an object has survived in the Survivor area for a long enough time (that is, after enough Minor GCs), it will be moved to the old generation.
In Java 8, by default, the MaxTenuringThreshold parameter is set to 15, that is, the object must survive 15 Minor GCs in the Survivor area before it can be promoted to the old age. If it is set to 0, it means that all objects can be promoted to the old generation at the first Minor GC; if it is set to a larger value, it means that only objects with a longer survival time can be promoted to the old generation .
It should be noted that if the MaxTenuringThreshold parameter is set too small, it may cause frequent promotion and recycling operations, thereby affecting the performance of the application; if it is set too large, it may cause insufficient space in the Survivor area, Thus forcing a Full GC operation will also affect the performance of the application.
It is recommended to test and optimize in real application scenarios to find the best MaxTenuringThreshold value. Typically, this value should be set between 8-15 and should be tuned based on your application's memory usage and GC logs.
solution:
Because it was set to 5 in the previous period, it is adjusted to 15 this time, or it does not need to be configured, and the default is 15;
Adjusted JVM parameters
-Xms9984m  -Xmx9984m  -XX:MaxMetaspaceSize=512m -XX:MetaspaceSize=512m  -XX:MaxDirectMemorySize=512m  -XX:ParallelGCThreads=8  -XX:CICompilerCount=4  -
XX:ConcGCThreads=4 -server -XX:+UnlockExperimentalVMOptions -XX:+UseG1GC -XX:SurvivorRatio=10 -XX:InitiatingHeapOccupancyPercent=45 -XX:G1ReservePercent=20 -
XX:G1MixedGCLiveThresholdPercent=60 -XX:MaxGCPauseMillis=100 -XX:+ExplicitGCInvokesConcurrent -XX:+ParallelRefProcEnabled -XX:+PrintGCDetails -XX:+PrintGCDateStamps -XX:+PrintReferenceGC  -
XX:+PrintHeapAtGC -Xloggc:/export/Logs/app/tomcat7-gc.log
Solution 2: Optimizing the virtual reference problem of MySQL
Adjust connection pool parameters
In many connection pools, a parameter configuration error was found. There is a database with db.minEvictableIdleTimeMillis=180000 (3 minutes). Properly increase the idle time of the connection to 30Min;
Adjusting the minIdle parameter of the DBCP connection pool to reduce the number of idle threads (when the entire connection is not active) can also play a certain role;
However, this method does not cure the root cause, because false references are still being produced.
Optimize MySQL driver phantom reference
A. Reflective brute force cleanup
Phantom references are often used as a bottom-up strategy to prevent users from forgetting to release resources and cause memory leaks (it is often useful for database connection management codes that do not use connection pools, such as Java beginners). We use DBCP or other pooling technologies to handle the release of resources rigorously. We can directly delete the phantom references in the connectionPhantomRefs in the middle of the connectionPhantomRefs without using the bottom line strategy, making the objects unreachable and directly reclaiming them during GC, thereby reducing the processing time of PhantomReferences.
// 每两小时清理 connectionPhantomRefs,减少对 mixed GC 的影响
SCHEDULED_EXECUTOR.scheduleAtFixedRate(() -> {
  try {
    Field connectionPhantomRefs = NonRegisteringDriver.class.getDeclaredField("connectionPhantomRefs");
    connectionPhantomRefs.setAccessible(true);
    Map map = (Map) connectionPhantomRefs.get(NonRegisteringDriver.class);
    if (map.size() > 50) {
      map.clear();
    }
  } catch (Exception e) {
    log.error("connectionPhantomRefs clear error!", e);
  }
}, 2, 2, TimeUnit.HOURS);
The above code regularly clears the NonRegisteringDriver static variable connectionPhantomRefs through reflection, that is, it is trusted that DBCP will automatically and rigorously handle resource release when the connection is recycled. The built-in security protection of the MySQL driver is cleared at regular intervals, which is equivalent to disabling this function.
Special note: Plan A has no security issues and can be adopted with confidence;
B. Upgrade MySQL jdbc driver to 8.0.22+, enable disableAbandonedConnectionCleanup
Oracle should have received feedback from a large number of developers and realized that this feature may cause serious overlong GC problems. In higher versions, this unnecessary tailing feature can be selectively turned off through configuration. The code of mysql-connector-java version (8.0.22+) has a new processing method for the phantom reference of the database connection, which adds a switch to manually turn off this function.
Its version 8.0.22 introduces to add this parameter to solve the problem related to JVM phantom reference, but it is not enabled by default and needs to be manually enabled:
https://dev.mysql.com/doc/relnotes/connector-j/8.0/en/news-8-0-22.html


When using Connector/J, the AbandonedConnectionCleanupThread thread can now be disabled completely by setting the new system property com.mysql.cj.disableAbandonedConnectionCleanup to true when configuring the JVM. The feature is for well-behaving applications that always close all connections they create. Thanks to Andrey Turbanov for contributing to the new feature. (Bug #30304764, Bug #96870)
With this configuration in place, it is possible to set properties on the startup parameters:
java -jar app.jar -Dcom.mysql.cj.disableAbandonedConnectionCleanup=trueOr set the property in code:
System.setProperty(PropertyDefinitions.SYSP_disableAbandonedConnectionCleanup,"true");When com.mysql.cj.disableAbandonedConnectionCleanup=true, phantom references will not be generated when generating database connections, and have no effect on GC.
Whether to upgrade the MySQL driver version depends on the actual situation. The above A/B solutions can solve this problem.
V. Summary
G1 parameter tuning summary
ParallelGCThreads is mainly for concurrently marking related threads. It will also be STW when processing itself. It is best to occupy all CPU cores. If the machine has 8 cores, it is best to set this value to 8;
ConcGCThreads is the number of concurrent marking threads. When marking, the business thread can not be STW, and some cores can be used, and the remaining cores are used to run business threads; here we configure it as half of the number of CPU cores4;
MaxGCPauseMillis is just an expected value (the GC will guarantee it as much as possible), and it cannot be strictly followed, especially in the marking phase, it will be affected by the number of heap memory objects, so you should not rely too much on this value to feel the actual time of STW; as our configuration 100ms, there are more chances of actually appearing 3~4 seconds;
ParallelRefProcEnabled If the various information you search reminds you that this switch is enabled by default, then you should pay special attention; this function is disabled by default in JDK8 version, and it is enabled by default after JDK9+. Therefore, JDK8 needs to be opened manually. To be on the safe side, configure this value regardless of the version;
The G1 garbage collector basically does not appear fullGC, and completes garbage collection in youngGC and mixedGC (the frequency of mixedGC is not high). If fullGC occurs, you should check for exceptions instead.
This article does not analyze the process and principle of the G1 garbage collector in detail, please refer to other articles for understanding;
Appendix: Official Oracle JDK8 G1 parameter tuning official document
Summary of MySQL virtual reference problems
If the MySQL link driver is below version 8.0.22, it can only actively clean up this unnecessary tailing function through reflection (generally mature database connection pool functions can safely release link-related resources).
MySQL driver version 8.0.22+, you can manually disable this function through configuration;
Result description
After the above adjustments (after the MySQL phantom reference problem is solved), the gc time can be well controlled within 100ms, with an average time-consuming of 26ms. The frequency of mixed gc is greatly reduced, mainly for youngGC.
References:
[1] Online Problem Analysis Series: Analysis and Solution of Database Connection Pool Memory Leakage
[2] com.mysql.jdbc.NonRegisteringDriver memory leak
[3] Online problem handling case 1: unexpected database connection pool
[4] Detailed explanation and tuning of G1 collector
[5] infoq-Tips for Tuning the Garbage First Garbage Collector
[6] Java Garbage Collection handbook
[7] PPPHUANG-JVM optimization stepping on the pit
[8] PPPHUANG- time-consuming optimization and source code analysis of phantom reference GC in MySQL driver
-end-