Case 1: When the content on the coordinates is text
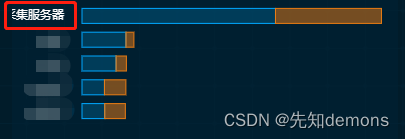
For a horizontal histogram like the one above, if the content of the y-coordinate axis is too long, the display will be incomplete.
Because the data is transmitted from the backend, some will be very long and some will be relatively short. If you just adjust the grid blindly, there will be too much white space before the short data, and the layout will be unreasonable. At this time, you need to use some other attributes.
Solution:
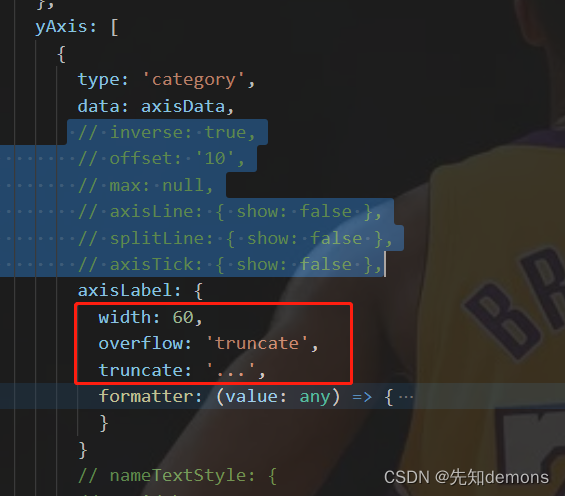
Add the following attribute configuration to axisLabel in yAxis:
Notes:
width: 60,//将内容的宽度固定
overflow: 'truncate',//超出的部分截断
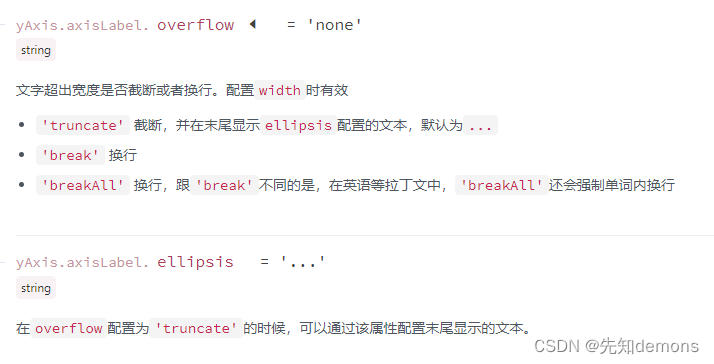
truncate: '...',//截断的部分用...代替Attach a screenshot of the official document:
Case 2: If the ordinate is a number

As shown in the figure, the data on the left will be incomplete
1. First, you can configure grid self-adaptation
grid: {
            top: "15%",
            left: "2%",
            right: "2%",
            bottom: "2%",
            containLabel: true
          },
After this setting, the numbers will be displayed in full:
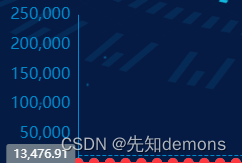
But new requirements come again. If the data is particularly large, the data on the left will occupy a wider and wider position, resulting in an unsightly layout, so we can deal with this number
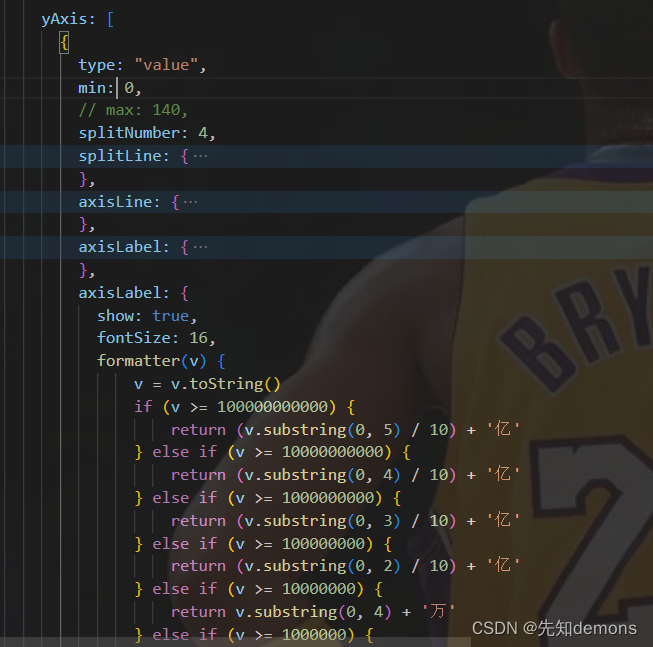
Configure the formatter in the axisLabel attribute of yAxis
formatter(v) {
                    v = v.toString()
                    if (v >= 100000000000) {
                        return (v.substring(0, 5) / 10) + '亿'
                    } else if (v >= 10000000000) {
                        return (v.substring(0, 4) / 10) + '亿'
                    } else if (v >= 1000000000) {
                        return (v.substring(0, 3) / 10) + '亿'
                    } else if (v >= 100000000) {
                        return (v.substring(0, 2) / 10) + '亿'
                    } else if (v >= 10000000) {
                        return v.substring(0, 4) + '万'
                    } else if (v >= 1000000) {
                        return v.substring(0, 3) + '万'
                    } else if (v >= 100000) {
                        return v.substring(0, 2) + '万'
                    } else if (v >= 10000) {
                        return (v.substring(0, 2) / 10) + '万'
                    } else if (v >= 1000) {
                        return v
                    } else {
                        return v
                    }
                },
The effect after this setting is as follows:
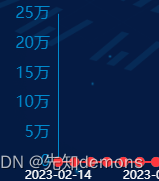
The advantage of this setting is that the left side will not once expand the left side width of the table because the data is too large