hello, i'm edamame. This series uses the most streamlined codes and cases to take you quickly to get started with quantification, and only talks about the most dry goods. Friends who want to learn quantification but don’t know how to get started, hurry up and read it!
Review of the previous issue: Three-minute introduction to quantification (1): Market data acquisition & drawing of candlestick charts
This issue continues to introduce commonly used Tushare transaction data interfaces. Maodou will update this series every weekend. It is recommended that you collect it for easy learning.
1. Introduction of Tushare Pro
In the previous issue, I introduced the Tushare database to you. Tushare is a free and open source python financial data interface package. Since the Tushare database has been upgraded to the Tushare Pro version, if you want to use more data interfaces, you need to use the Tushare Pro account.
1. Account registration
First, we go to the official website to register a Tushare Pro account: https://tushare.pro/

Click on the upper right corner to register, fill in the mobile phone number, password, and verification code, and it will be done soon!
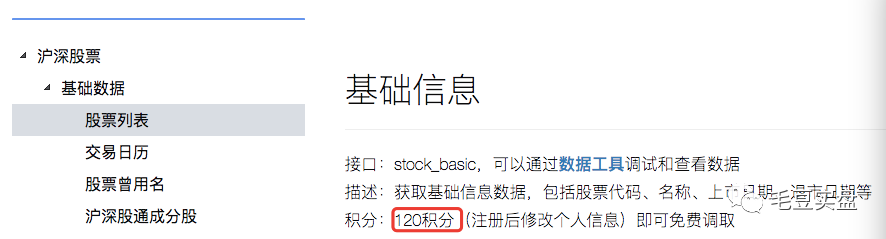
2. Tushare points
Tushare points are the authority to access data. After the registration is completed, there will be 100 points. After completing the personal information, you can get 20 points. In this way, we will have 120 basic points. After having points, we can call some data interfaces. Different data interfaces require different points, which are described in detail in the official API documentation. For example, to obtain a stock list, only 120 points are required:
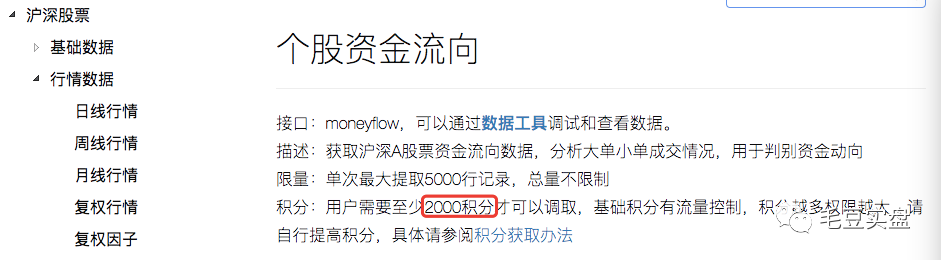
The interface to obtain the capital flow of individual stocks requires 2000 credits:
Points can be obtained by participating in community maintenance, contributing code, etc. For details, please refer to the official document: https://tushare.pro/document/1?doc_id=13
3. API call method
Before retrieving data, token authentication is required. After successful registration of each account, there will be a token. Click on the personal home page in the upper right corner - interface TOKEN to view:

After getting the token, we can go back to the jupyter notebook for authentication:
import tushare as ts
pro = ts.pro_api('your token')
After the authentication is successful, the data can be retrieved normally. For example, let's take the basic stock list as an example:
#查询当前所有正常上市交易的股票列表
data = pro.stock_basic(exchange='', list_status='L', fields='ts_code,symbol,name,area,industry,list_date')
data.head()
returns as follows:
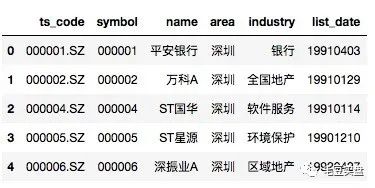
So far, we have successfully obtained the data through the API provided by Tushare Pro. Next, let's take a look at other commonly used interfaces provided by Tushare Pro.
2. Common data interface
Here Maodou selects 12 most commonly used data interfaces, through these interfaces, it is enough to meet more than 90% of the data needs! Let me introduce you one by one.
1. Get the stock list
Interface: stock_basic
Data category: basic data
usage frequency:*****
Example usage:
Get the current list of all stocks:
#查询当前所有正常上市交易的股票列表
data = pro.stock_basic(exchange='', list_status='L', fields='ts_code,symbol,name,area,industry,list_date')
data.head()Return result: Same as above
This is the most basic and commonly used interface, and only on this basis can subsequent stock selection be carried out.
2. Get the trading calendar
Interface: trade_cal
Data category: basic data
usage frequency:*****
Example usage:
Get a calendar of deals from this year:
df = pro.trade_cal(exchange='', start_date='20230101', end_date='20230512')
df.head(15)
returns as follows:
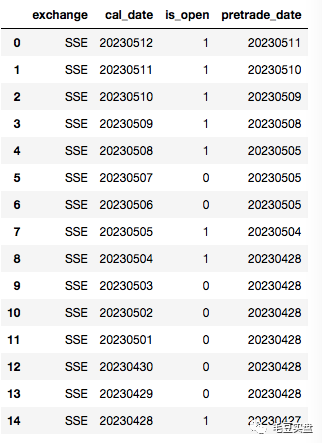
If is_open is 1, it means the market is open, when is_open is 0, it means the market is closed, and pretrade_date means the date of the previous trading day.
Filter out all trading days from this year:
trade_date_list=df.loc[df['is_open']==1].cal_date.tolist()
print(trade_date_list)
returns as follows:

This interface is the same as the interface for obtaining the stock list, and it is also the most basic and commonly used interface.
3. Get an alternate list
Interface: bak_basic
Data category: basic data
usage frequency:*****
Example usage:
Get basic information about Cambridge Tech:
df = pro.bak_basic(trade_date='20230512', ts_code='603083.SH',fields='trade_date,ts_code,name,industry,area,total_share,float_share,pe,pb,list_date')
returns as follows:

If you do not pass the ts_code parameter, it defaults to all tags:
df = pro.bak_basic(trade_date='20230512',fields='trade_date,ts_code,name,industry,area,total_share,float_share,pe,pb,list_date')
df.head()
returns as follows:
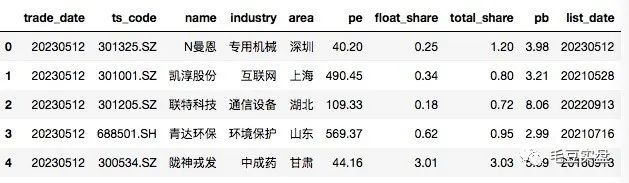
The basic information of the stock is here, a very practical interface. For example, if you want to obtain information about a certain stock’s industry, region, total share capital, tradable share capital, price-earnings ratio, price-to-book ratio, listing date, etc., you only need this interface to get it all done!
4. Obtain daily market data
interface: daily
Data category: market data
usage frequency:*****
Example usage:
Get the market data of Cambridge Technology this year:
df = pro.daily(ts_code='603083.SH', start_date='20230101', end_date='20230512')
df.head()
returns as follows:
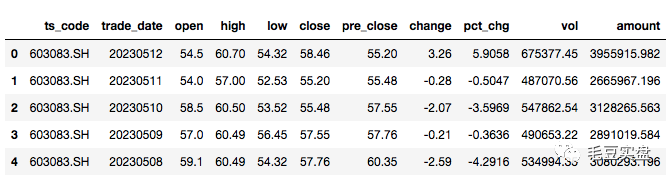
Including the opening price, closing price, highest price, lowest price, yesterday's closing price, change amount, change rate, transaction volume, and transaction value of the transaction date.
Get market data for multiple stocks:
df = pro.daily(ts_code='603083.SH,601949.SH', start_date='20230101', end_date='20230512')
df.head()
returns as follows:
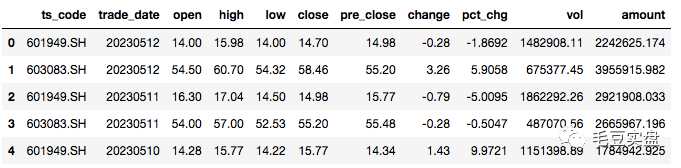
If you do not pass the ts_code parameter, it will default to all tags.
This interface has basically the same function as the original get_hist_data interface, and it is also a necessary data interface.
5. Get Daily Metrics
Interface: daily_basic
Data category: market data
usage frequency:*****
Example usage:
Get Cambridge Tech's metrics for May 12, 2023:
df = pro.daily_basic(ts_code='603083.SH', trade_date='20230512', fields='ts_code,trade_date,turnover_rate,turnover_rate_f,volume_ratio,pe,pb,total_mv,circ_mv')
This interface can be regarded as an upgraded version of bak_basic. In addition to data such as price-earnings ratio, price-to-book ratio, circulating market value, and total market value, it also returns the volume ratio and turnover rate. You don’t need to calculate it yourself, which is very practical! The downside is that it requires extra credits.
6. Obtain the capital flow information of individual stocks
Interface: moneyflow
Data category: market data
usage frequency:***
Example usage:
Get the capital flow information of Cambridge Science and Technology since the beginning of this year:
df = pro.moneyflow(ts_code='603083.SH', start_date='20230101', end_date='20230512')
Get the capital flow information of all stocks on May 12, 2023:
df = pro.moneyflow(trade_date='20230512')
Capital flow is a personalized indicator, not a general indicator. It mainly depends on whether it is needed in one's own strategy. This interface also requires additional credits.
7. Obtain the daily limit price
Interface: stk_limit
Data category: market data
usage frequency:****
Example usage:
Get the price limit of Cambridge Technology on May 12, 2023:
df = pro.stk_limit(ts_code='603083.SH',trade_date='20230512')
If you do not pass the ts_code parameter, it will default to all tags.
This interface is mostly used when setting trading conditions, such as board buying, limit selling, etc. Additional points are required.
8. Obtain financial indicator data
Interface: fina_indicator
Data Category: Financial Data
usage frequency:***
Example usage:
Get Cambridge Tech's financial data for the year:
df = pro.fina_indicator(ts_code='603083.SH', start_date='20230101', end_date='20230512')
Returns all financial indicator data, which is very complete. Additional points are required.
9. Obtain margin trading and securities lending transaction data
Interface: margin, margin_detail
Data category: market reference data
usage frequency:****
Example usage:
Get 2023.5.12 margin financing and securities lending transaction data:
df = pro.margin(trade_date='20180802')
Return financing balance, financing purchase amount, financing repayment amount, securities lending balance, securities lending balance, etc.
10. Get daily chip distribution
Interface: cyq_chips
Data Category: Featured Data
usage frequency:***
Example usage:
View the 2023.5.12 Cambridge technology chip distribution data:
df = pro.cyq_chips(ts_code='603083.SH', trade_date='20230512')
df.head()
returns as follows:
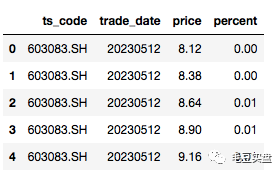
price is the cost price, and percent is the percentage.
Very pleasant interface! It is more troublesome to count the chip distribution by yourself. If you need to write strategies related to chip distribution, this interface is very practical.
11. Obtain price limit data
Interface: limit_list_d
Data Category: Featured Data
usage frequency:****
Example usage:
Check the 2023.5.12 daily limit data:
df = pro.limit_list_d(trade_date='20230512', limit_type='U')
df.head()
limit_type is optional U daily limit D lower limit Z fried board.
returns as follows:
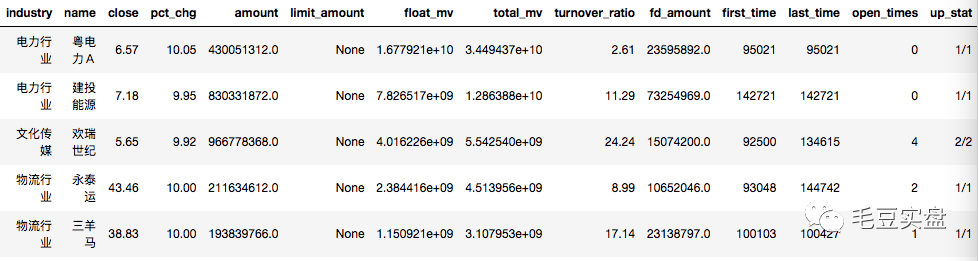
Return closing price, turnover, turnover rate, circulating market capitalization, total market capitalization, closed order amount, first closing time, final closing time, number of bombings, number of consecutive boards, etc., even within a few days. There are statistics. It is also a very good interface, friends who do short-term must not miss it!
12. Get Flush concept/industry information
Interface: ths_index, ths_member, ths_daily
Data Category: Index Data
usage frequency:***
Example usage:
Find out which sectors the Flush has and how many constituent stocks each sector has:
df = pro.ths_index()
View the constituent stocks of the webcast sector (885788):
df = pro.ths_member(ts_code='885788.TI')View the market data of the webcast section (885788) on May 12, 2023:
df = pro.ths_daily(ts_code='885788.TI', trade_date='20230512', fields='ts_code,trade_date,open,close,high,low,pct_change')If you want to do industry/concept sector research, you need to use these interfaces, which are clear and concise. Similar to this, there are related interfaces of Shenwan Industry.
In addition to stock data, Tushare Pro also provides futures, options, foreign exchange, bonds and other data, and even movie box office data, which is very comprehensive! The edamame will not be shown here one by one. Interested friends can go to the official website of tushare to learn more interesting data interfaces. If you have any market data you want to view, you can directly query it in the official API document: https:// tushare.pro/document/2
The above is all the content of today’s dry goods. Maodou will update this series every weekend, and will continue to share with you the real situation of the Whirlwind Charge quantitative strategy every trading day. Welcome everyone to like and follow.
Backtest: Whirlwind Charge Strategy Description
Firm Offer: April Strategic Data Publicity & Frequently Asked Questions