An article to get "ANR in Android"
What is ANR
It is the timeout monitoring of the system through the interacting components and user interaction to determine whether the application process is stuck or responds too slowly. Generally speaking, it is the design idea of watchdog in many systems.
Give an example to help you understand ANR
Question: Will ANR occur when calling the sleep method in the Activity's onCreate method?
Most people may think that ANR will occur as long as time-consuming operations are done on the main thread, so is this really the case?
Calling Thread.sleep(20 * 1000) in the Activity's onCreate method to let the main thread sleep for 20 seconds will cause the application ANR? Write a Demo to test it.
public class MainActivity extends AppCompatActivity {


    @Override
    protected void onCreate(Bundle savedInstanceState) {


        super.onCreate(savedInstanceState);
        setContentView(R.layout.activity_main);
        try {


            Log.d("ANR","开始sleep");
            Thread.sleep(20*1000);
            Log.d("ANR","结束sleep");

        } catch (InterruptedException e) {


            e.printStackTrace();
        }
    }
}
As above code, run the program, the result is no ANR occurs in the application, and the log is printed normally after sleeping for 60 seconds.

see it! see it! Lie flat for 20 seconds and then continue.
Let's run it again, with a difference from last time. We are in sleep 20, triggering a return event.

see it! see it! ANR crashed!
Brothers: From the above results, we know that in fact, in the main thread sleep method or doing time-consuming operations, ANR may not necessarily be generated. The root cause of ANR is that the application cannot
respond to user operations within a certain period of time. Because the main thread is occupied. Smart brothers should already know why, yes, it is the Handler And Looper of our main thread. There is no way to process the next Message.
The cause of ANR
- Service Timeout: For example, if the foreground service is not executed within 20s, the Timeout time of the background service is 10 times that of the foreground service, 200s;
- BroadcastQueue Timeout: For example, the foreground broadcast is not executed within 10s, and the background is 60s
- ContentProvider Timeout: content provider, timeout 10s after publish;
- InputDispatching Timeout: The input event dispatch timeout is 5s, including button and touch events.
//ActiveServices.java
// How long we wait for a service to finish executing.
static final int SERVICE_BACKGROUND_TIMEOUT = SERVICE_TIMEOUT * 10;
// How long the startForegroundService() grace period is to get around to
// calling startForeground() before we ANR + stop it.
static final int SERVICE_START_FOREGROUND_TIMEOUT = 10*1000;

//ActivityManagerService.java
// How long we allow a receiver to run before giving up on it.
static final int BROADCAST_FG_TIMEOUT = 10*1000;
static final int BROADCAST_BG_TIMEOUT = 60*1000;
// How long we wait until we timeout on key dispatching.
static final int KEY_DISPATCHING_TIMEOUT = 5*1000;
ANR monitoring means
Method 1: Monitor the trace folder
The permission problem is only applicable to
Android M (6.0) versions before Android 6, and the application side cannot directly monitor whether ANR occurs by monitoring the data/anr/trace file.
Method 2: Use the Looper of our main thread
Let's take a look at our Looper process
public static void loop() {


    for (;;) {


        //1、取消息
        Message msg = queue.next(); // might block
        ...
        //2、消息处理前回调
        if (logging != null) {


            logging.println(">>>>> Dispatching to " + msg.target + " " +
                    msg.callback + ": " + msg.what);
        }
        ...

        //3、消息开始处理
        msg.target.dispatchMessage(msg);// 分发处理消息
        ...

        //4、消息处理完回调
        if (logging != null) {


            logging.println("<<<<< Finished to " + msg.target + " " + msg.callback);
        }
    }
    ...
}
The smart brothers have already thought of it: we can use annotations 2 and 4 to get the time we process the message. So as to judge our ANR situation.
We only need to call Looper.getMainLooper().setMessageLogging(printer) to get the time before and after Handler processes a message from the callback.
It should be noted that dispatchMessage has already been called and popped out of the stack after the stuttering is detected. At this time, the stack of the main thread does not contain the stuttering code.
Therefore, it is necessary to open a thread in the background, obtain the stack of the main thread regularly, use the time point as the key and the stack information as the value, and save it in the Map. When a freeze occurs, just retrieve the stack information during the freeze period.
However, this solution is only suitable for offline use for the following reasons:
- logging.println("<<<<< Finished to " + msg.target + " " + msg.callback); There is string concatenation, frequent calls will create a large number of objects, causing memory jitter.
- The background thread frequently obtains the main thread stack, which has a certain impact on performance, and obtaining the main thread stack will suspend the operation of the main thread.
Method 3: Monitor SIGQUIT signal
This kind of scheme is the real monitoring ANR, which is used by matrix and xCrash. It has been tested on apps such as National App WeChat, and the stability and reliability can be guaranteed.
The ANR process is basically completed in the system_server system process. It is difficult for us to monitor the behavior of the system process. If we want to monitor this matter, we have to start from the boundary between the system process and the application process to see if there is any operable place on the boundary.
Now, let's sort out the entire ANR process:
- After the system monitors that ANR occurs in the app, it collects some related process pids (including the process in which ANR occurs), and prepares to dump the stack of these processes to generate an ANR Trace file
- The system starts to send the SIGQUIT signal to these processes, and the process starts to dump the stack after receiving the SIGQUIT signal. The
WeChat team analyzes the flow diagram of ANR:
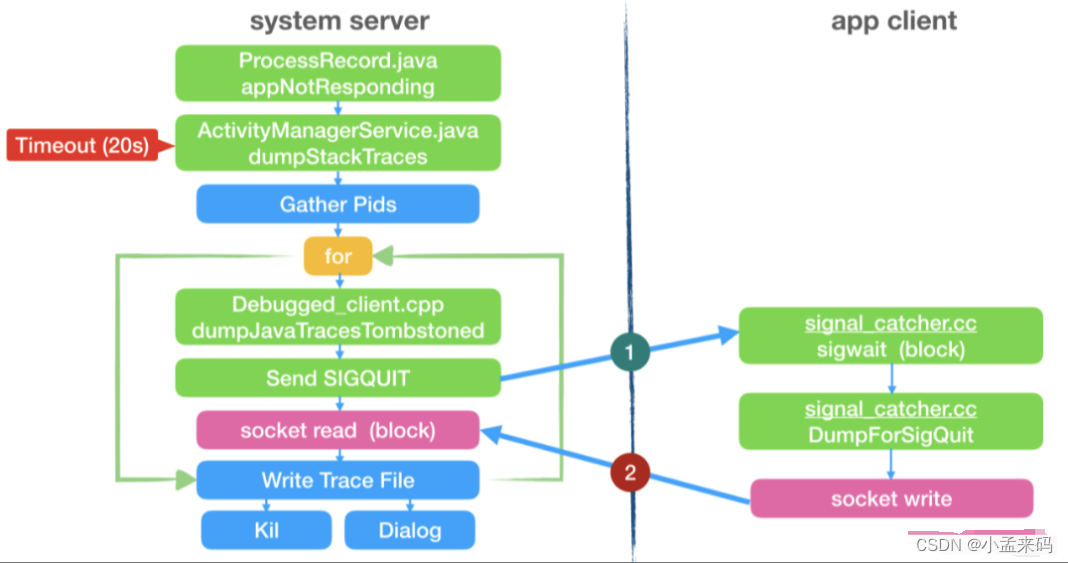
You can see that in the entire process after ANR occurs in a process, only the dump stack behavior will occur when ANR occurs In the process, other processes are all processed in the system process, and we cannot perceive it. This process starts from receiving the SIGQUIT signal and ends with using socket to write Trace. Then continue to return to the system process to complete the remaining ANR process. We can make a fuss about these two boundaries.
ANR log Traces.txt
First, the traces.txt file is located in the /data/anr/ directory, you can copy it to the sd card directory to view it through the following adb command.
Analyzing traces files to locate ANR is mostly applicable offline, of course we can put our traces.txt online. But we need to do this:
1. When the monitoring thread finds that the main thread is stuck, it actively sends a SIGNAL_QUIT signal to the system.
2. Wait for the /data/anr/traces.txt file to be generated.
3. Submit the file after it is generated.
It seems feasible, but there are two problems:
1. The traces.txt contains all the thread information, which needs to be manually filtered and analyzed after uploading.
2. Many high-version systems require root privileges to read the /data/anr directory

Traces file analysis
Get the trace file and analyze it in detail:
----- pid 7761 at 2022-11-02 07:02:26 -----
Cmd line: com.xfhy.watchsignaldemo
Build fingerprint: 'HUAWEI/LYA-AL00/HWLYA:10/HUAWEILYA-AL00/10.1.0.163C00:user/release-keys'
ABI: 'arm64'
Build type: optimized
Zygote loaded classes=11918 post zygote classes=729
Dumping registered class loaders
#0 dalvik.system.PathClassLoader: [], parent #1
#1 java.lang.BootClassLoader: [], no parent
#2 dalvik.system.PathClassLoader: [/system/app/FeatureFramework/FeatureFramework.apk], no parent
#3 dalvik.system.PathClassLoader: [/data/app/com.xfhy.watchsignaldemo-4tkKMWojrpHAf-Q3iecaHQ==/base.apk:/data/app/com.xfhy.watchsignaldemo-4tkKMWojrpHAf-Q3iecaHQ==/base.apk!classes2.dex:/data/app/com.xfhy.watchsignaldemo-4tkKMWojrpHAf-Q3iecaHQ==/base.apk!classes4.dex:/data/app/com.xfhy.watchsignaldemo-4tkKMWojrpHAf-Q3iecaHQ==/base.apk!classes3.dex], parent #1
Done dumping class loaders
Intern table: 44132 strong; 436 weak
JNI: CheckJNI is off; globals=681 (plus 67 weak)
Libraries: /data/app/com.xfhy.watchsignaldemo-4tkKMWojrpHAf-Q3iecaHQ==/lib/arm64/libwatchsignaldemo.so libandroid.so libcompiler_rt.so libhitrace_jni.so libhiview_jni.so libhwapsimpl_jni.so libiAwareSdk_jni.so libimonitor_jni.so libjavacore.so libjavacrypto.so libjnigraphics.so libmedia_jni.so libopenjdk.so libsoundpool.so libwebviewchromium_loader.so (15)
//已分配堆内存大小26M,其中2442kb医用,总分配74512个对象
Heap: 90% free, 2442KB/26MB; 74512 objects

Total number of allocations 120222 //进程创建到现在一共创建了多少对象
Total bytes allocated 10MB         //进程创建到现在一共申请了多少内存
Total bytes freed 8173KB           //进程创建到现在一共释放了多少内存
Free memory 23MB                   //不扩展堆的情况下可用的内存
Free memory until GC 23MB          //GC前的可用内存
Free memory until OOME 381MB       //OOM之前的可用内存,这个值很小的话,说明已经处于内存紧张状态,app可能是占用了过多的内存
Total memory 26MB                  //当前总内存(已用+可用)
Max memory 384MB                   //进程最多能申请的内存

.....//省略GC相关信息


//当前进程共17个线程
DALVIK THREADS (17):

//Signal Catcher线程调用栈
"Signal Catcher" daemon prio=5 tid=4 Runnable
  | group="system" sCount=0 dsCount=0 flags=0 obj=0x18c84570 self=0x7252417800
  | sysTid=7772 nice=0 cgrp=default sched=0/0 handle=0x725354ad50
  | state=R schedstat=( 16273959 1085938 5 ) utm=0 stm=1 core=4 HZ=100
  | stack=0x7253454000-0x7253456000 stackSize=991KB
  | held mutexes= "mutator lock"(shared held)
  native: #00 pc 000000000042f8e8  /apex/com.android.runtime/lib64/libart.so (art::DumpNativeStack(std::__1::basic_ostream<char, std::__1::char_traits<char>>&, int, BacktraceMap*, char const*, art::ArtMethod*, void*, bool)+140)
  native: #01 pc 0000000000523590  /apex/com.android.runtime/lib64/libart.so (art::Thread::DumpStack(std::__1::basic_ostream<char, std::__1::char_traits<char>>&, bool, BacktraceMap*, bool) const+508)
  native: #02 pc 000000000053e75c  /apex/com.android.runtime/lib64/libart.so (art::DumpCheckpoint::Run(art::Thread*)+844)
  native: #03 pc 000000000053735c  /apex/com.android.runtime/lib64/libart.so (art::ThreadList::RunCheckpoint(art::Closure*, art::Closure*)+504)
  .....
  (no managed stack frames)

"main" prio=5 tid=1 Sleeping
  | group="main" sCount=1 dsCount=0 flags=1 obj=0x73907540 self=0x725f010800
  | sysTid=7761 nice=-10 cgrp=default sched=1073741825/2 handle=0x72e60080d0
  | state=S schedstat=( 281909898 5919799 311 ) utm=20 stm=7 core=4 HZ=100
  | stack=0x7fca180000-0x7fca182000 stackSize=8192KB
  | held mutexes=
  at java.lang.Thread.sleep(Native method)
  - sleeping on <0x00f895d9> (a java.lang.Object)
  at java.lang.Thread.sleep(Thread.java:443)
  - locked <0x00f895d9> (a java.lang.Object)
  at java.lang.Thread.sleep(Thread.java:359)
  at android.os.SystemClock.sleep(SystemClock.java:131)
  at com.xfhy.watchsignaldemo.MainActivity.makeAnr(MainActivity.kt:35)
  ... //此处省略剩余的N个线程
Detailed interpretation of the trace parameter:
"Signal Catcher" daemon prio=5 tid=4 Runnable
  | group="system" sCount=0 dsCount=0 flags=0 obj=0x18c84570 self=0x7252417800
  | sysTid=7772 nice=0 cgrp=default sched=0/0 handle=0x725354ad50
  | state=R schedstat=( 16273959 1085938 5 ) utm=0 stm=1 core=4 HZ=100
  | stack=0x7253454000-0x7253456000 stackSize=991KB
  | held mutexes= "mutator lock"(shared held)
Signal Catcher" daemon prio=5 tid=4 Runnable
- "Signal Catcher" daemon: thread name, daemon means daemon thread
- prio: thread priority
- tid: thread internal id
- Thread state: Runnable
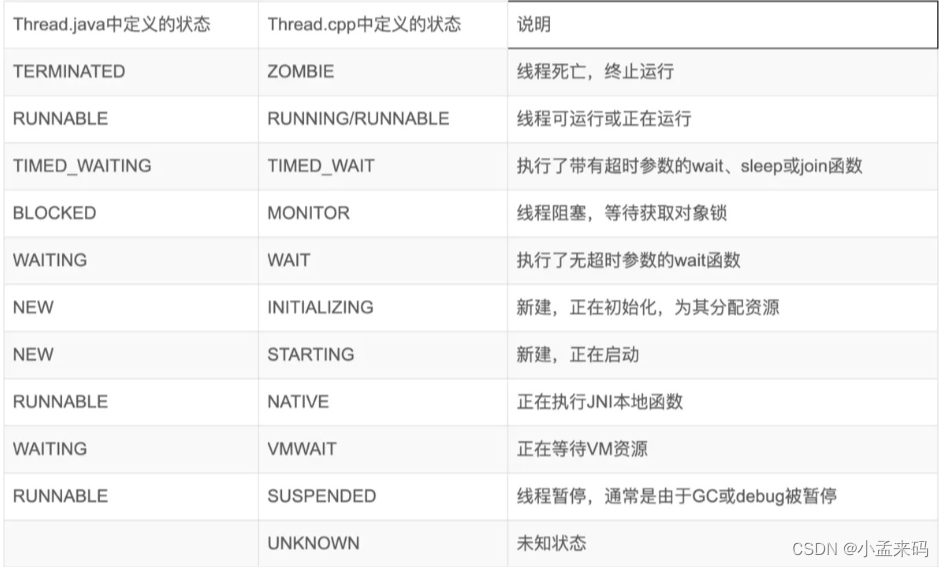
Generally speaking: the main thread is in the state of BLOCK, WAITING, and TIMEWAITING, which is basically ANR caused by function blocking. If the main thread is normal, you should check the CPU load and memory environment.
Several analysis cases:
1. The problem of good positioning (simple case)
First see the Loacat log:
07-22 21:39:17.019 819-851/? E/ActivityManager: ANR in com.xxxx.performance (com.xxxx.performance/.view.home.activity.MainActivity)
PID: 7398
Reason: Input dispatching timed out (com.xxxx.performance/com.xxxx.performance.view.home.activity.MainActivity, Waiting to send non-key event because the touched window has not finished processing certain input events that were delivered to it over 500.0ms ago.  Wait queue length: 29.  Wait queue head age: 8579.3ms.)
Load: 18.22 / 18.1 / 18.18
CPU usage from 0ms to 8653ms later:
124% 7398/com.xxxx.performance: 118% user + 6.5% kernel / faults: 4962 minor 7 major
82% 819/system_server: 28% user + 53% kernel / faults: 10555 minor 11 major
23% 4402/adbd: 1% user + 22% kernel
10% 996/com.android.systemui: 4.6% user + 6.2% kernel / faults: 4677 minor 1 major
4.6% 2215/com.android.phone: 1.5% user + 3.1% kernel / faults: 5411 minor
6.3% 6268/perfd: 3.4% user + 2.8% kernel / faults: 134 minor
0.5% 1149/com.miui.whetstone: 0.1% user + 0.3% kernel / faults: 3016 minor 1 major
0.2% 2097/com.xiaomi.finddevice: 0.1% user + 0.1% kernel / faults: 2256 minor
0.6% 2143/com.miui.daemon: 0.2% user + 0.3% kernel / faults: 2798 minor
1.2% 1076/com.xiaomi.xmsf: 0.6% user + 0.6% kernel / faults: 2802 minor
......
From the first line of the log, you can see the application package name and class name where the error occurred, here is
ANR in com.xxxx.performance (com.xxxx.performance/.view.home.activity.MainActivity)。
Then see that the process number PID is 7398. The Reason for ANR is Input dispatching timed out, which is the first one mentioned above. Further down is the CPU usage log of active processes.
Just looking at the logs in Logcat can only see these information. I probably know that there is a problem in MainActivity, but I still can’t clearly locate the line of code where ANR occurred. If you want to get further error information, you can only view it generated during the ANR process. The stack information file traces.txt is up.
Information in traces.txt:
DALVIK THREADS (42):
"main" prio=5 tid=1 Native
| group="main" sCount=1 dsCount=0 obj=0x75ceafb8 self=0x55933ae7e0
| sysTid=7398 nice=0 cgrp=default sched=0/0 handle=0x7f7ddae0f0
| state=S schedstat=( 101485399944 3411372871 31344 ) utm=9936 stm=212 core=1 HZ=100
| stack=0x7fc8d40000-0x7fc8d42000 stackSize=8MB
| held mutexes=
kernel: __switch_to+0x74/0x8c
kernel: futex_wait_queue_me+0xcc/0x158
kernel: futex_wait+0x120/0x20c
kernel: do_futex+0x184/0xa48
kernel: SyS_futex+0x88/0x19c
kernel: cpu_switch_to+0x48/0x4c
native: #00 pc 00017750  /system/lib64/libc.so (syscall+28)
native: #01 pc 000d1584  /system/lib64/libart.so (_ZN3art17ConditionVariable4WaitEPNS_6ThreadE+140)
native: #02 pc 00388098  /system/lib64/libart.so (_ZN3artL12GoToRunnableEPNS_6ThreadE+1068)
native: #03 pc 000a5db8  /system/lib64/libart.so (_ZN3art12JniMethodEndEjPNS_6ThreadE+24)
native: #04 pc 000280e4  /data/dalvik-cache/arm64/system@framework@boot.oat (Java_android_graphics_Paint_native_1init__+156)
at android.graphics.Paint.native_init(Native method)
at android.graphics.Paint.<init>(Paint.java:435)
at android.graphics.Paint.<init>(Paint.java:425)
at android.text.TextPaint.<init>(TextPaint.java:49)
at android.text.Layout.<init>(Layout.java:160)
at android.text.StaticLayout.<init>(StaticLayout.java:111)
at android.text.StaticLayout.<init>(StaticLayout.java:87)
at android.text.StaticLayout.<init>(StaticLayout.java:66)
at android.widget.TextView.makeSingleLayout(TextView.java:6543)
at android.widget.TextView.makeNewLayout(TextView.java:6383)
at android.widget.TextView.checkForRelayout(TextView.java:7096)
at android.widget.TextView.setText(TextView.java:4082)
at android.widget.TextView.setText(TextView.java:3940)
at android.widget.TextView.setText(TextView.java:3915)
at com.xxxx.performance.view.home.fragment.AttendanceCheckInFragment.onNowTimeSuccess(AttendanceCheckInFragment.java:887)
at com.xxxx.performance.presenter.attendance.AttendanceFragmentPresenter$6.onNext(AttendanceFragmentPresenter.java:214)
at com.xxxx.performance.presenter.attendance.AttendanceFragmentPresenter$6.onNext(AttendanceFragmentPresenter.java:205)
at io.reactivex.internal.operators.observable.ObservableObserveOn$ObserveOnObserver.drainNormal(ObservableObserveOn.java:198)
at io.reactivex.internal.operators.observable.ObservableObserveOn$ObserveOnObserver.run(ObservableObserveOn.java:250)
at io.reactivex.android.schedulers.HandlerScheduler$ScheduledRunnable.run(HandlerScheduler.java:109)
......
......
Let's start from the beginning and see the meaning of each field:
Thread name: main
thread priority: prio=5
Thread lock ID: tid=1
Thread status: Native
thread group name: group=“main”
The number of times the thread is suspended: sCount=1
The number of times the thread is suspended by the debugger: dsCount=0
thread java object address: obj=0x75ceafb8
thread itself Native object address: self=0x55933ae7e0
############################ ########
Thread scheduling information:
Kernel thread ID in Linux system: sysTid=7398 is the same as the process number of the main thread
Thread scheduling priority: nice=0
Thread scheduling group: cgrp=default
Thread scheduling strategy and priority : sched=0/0
thread processing function address: handle=0x7f7ddae0f0
##################################### ##
Thread context information:
thread scheduling status: state=S thread
execution time in CPU, thread waiting time, thread execution time slice length: schedstat=(1014853999443411372871 31344)
thread scheduling time value in user mode: utm =9936
The scheduling time value of the thread in the kernel state: stm=212
The CPU core serial number that finally executes this thread: core=1
#########################################
Thread stack information:
stack address and size: stack =0x7fc8d40000-0x7fc8d42000 stackSize=8MB
Finally see this line in the stack information:
at com.xxxx.performance.view.home.fragment.AttendanceCheckInFragment.onNowTimeSuccess(AttendanceCheckInFragment.java:887)
Here we can clearly see that the problem occurred in line 887 of AttendanceCheckInFragment, and then it is easy to find the cause of ANR in the corresponding code line.
Two, poor positioning
The main thread is blocked by a lock
fun makeAnr(view: View) {


    val obj1 = Any()
    val obj2 = Any()

    //搞个死锁,相互等待

    thread(name = "卧槽") {


        synchronized(obj1) {


            SystemClock.sleep(100)
            synchronized(obj2) {


            }
        }
    }

    synchronized(obj2) {


        SystemClock.sleep(100)
        synchronized(obj1) {


        }
    }
}
"main" prio=5 tid=1 Blocked
  | group="main" sCount=1 dsCount=0 flags=1 obj=0x73907540 self=0x725f010800
  | sysTid=19900 nice=-10 cgrp=default sched=0/0 handle=0x72e60080d0
  | state=S schedstat=( 542745832 9516666 182 ) utm=48 stm=5 core=4 HZ=100
  | stack=0x7fca180000-0x7fca182000 stackSize=8192KB
  | held mutexes=
  at com.xfhy.watchsignaldemo.MainActivity.makeAnr(MainActivity.kt:59)
  - waiting to lock <0x0c6f8c52> (a java.lang.Object) held by thread 22   //注释1
  - locked <0x01abeb23> (a java.lang.Object)
  at java.lang.reflect.Method.invoke(Native method)
  at androidx.appcompat.app.AppCompatViewInflater$DeclaredOnClickListener.onClick(AppCompatViewInflater.java:441)
  at android.view.View.performClick(View.java:7317)
  at com.google.android.material.button.MaterialButton.performClick(MaterialButton.java:1219)
  at android.view.View.performClickInternal(View.java:7291)
  at android.view.View.access$3600(View.java:838)
  at android.view.View$PerformClick.run(View.java:28247)
  at android.os.Handler.handleCallback(Handler.java:900)
  at android.os.Handler.dispatchMessage(Handler.java:103)
  at android.os.Looper.loop(Looper.java:219)
  at android.app.ActivityThread.main(ActivityThread.java:8668)
  at java.lang.reflect.Method.invoke(Native method)
  at com.android.internal.os.RuntimeInit$MethodAndArgsCaller.run(RuntimeInit.java:513)
  at com.android.internal.os.ZygoteInit.main(ZygoteInit.java:1109)

"卧槽" prio=5 tid=22 Blocked  //注释2
  | group="main" sCount=1 dsCount=0 flags=1 obj=0x12c8a118 self=0x71d625f800
  | sysTid=20611 nice=0 cgrp=default sched=0/0 handle=0x71d4513d50
  | state=S schedstat=( 486459 0 3 ) utm=0 stm=0 core=4 HZ=100
  | stack=0x71d4411000-0x71d4413000 stackSize=1039KB
  | held mutexes=
  at com.xfhy.watchsignaldemo.MainActivity$makeAnr$1.invoke(MainActivity.kt:52)
  - waiting to lock <0x01abeb23> (a java.lang.Object) held by thread 1
  - locked <0x0c6f8c52> (a java.lang.Object)
  at com.xfhy.watchsignaldemo.MainActivity$makeAnr$1.invoke(MainActivity.kt:49)
  at kotlin.concurrent.ThreadsKt$thread$thread$1.run(Thread.kt:30)

......
Notice the following lines:
"main" prio=5 tid=1 Blocked
  - waiting to lock <0x0c6f8c52> (a java.lang.Object) held by thread 22
  - locked <0x01abeb23> (a java.lang.Object)

"卧槽" prio=5 tid=22 Blocked
  - waiting to lock <0x01abeb23> (a java.lang.Object) held by thread 1
  - locked <0x0c6f8c52> (a java.lang.Object)
The tid of the main thread is 1, the thread status is Blocked, and it is waiting for the Object 0x0c6f8c52, which is held by the thread 22, and the main thread currently holds the lock of 0x01abeb23. And the tid of the trough is 22, which is also in the Blocked state. The lock it wants to request and the existing lock are just opposite to the main thread. In this case, the reason for ANR is found: thread 22 holds a lock and has not released it, and the main thread waits for the lock to time out. In the online environment, the common scenario of ANR due to locks is SharePreference writing.
CPU is preempted
CPU usage from 0ms to 10625ms later (2020-03-09 14:38:31.633 to 2020-03-09 14:38:42.257):
  543% 2045/com.test.demo: 54% user + 89% kernel / faults: 4608 minor 1 major //注意看这里
  99% 674/android.hardware.camera.provider@2.4-service: 81% user + 18% kernel / faults: 403 minor
  24% 32589/com.wang.test: 22% user + 1.4% kernel / faults: 7432 minor 1 major
  ......
It can be seen that the process occupies up to 543% of the CPU, occupying most of the CPU resources, because it causes ANR, which has nothing to do with our app.
Memory tension causes ANR
If the CPU and stack of an ANR log are normal, it can be considered that the memory is tight. Look at the memory-related part of the ANR log. You can also search for onTrimMemory in the log. If there are related logs near the time of dumping the ANR log, the memory may be tight.
10-31  E Runtime : onTrimMemory level:80,pid:com.xxx.xxx:Launcher0
10-31  E Runtime : onTrimMemory level:80,pid:com.xxx.xxx:Launcher0
10-31  E Runtime : onTrimMemory level:80,pid:com.xxx.xxx:Launcher0
10-31  E Runtime : onTrimMemory level:80,pid:com.xxx.xxx:Launcher0
10-31  E Runtime : onTrimMemory level:80,pid:com.xxx.xxx:Launcher0
System service timeout causes ANR
"main" prio=5 tid=1 Native
  | group="main" sCount=1 dsCount=0 flags=1 obj=0x727851e8 self=0x78d7060e00
  | sysTid=4894 nice=0 cgrp=default sched=0/0 handle=0x795cc1e9a8
  | state=S schedstat=( 8292806752 1621087524 7167 ) utm=707 stm=122 core=5 HZ=100
  | stack=0x7febb64000-0x7febb66000 stackSize=8MB
  | held mutexes=
  kernel: __switch_to+0x90/0xc4
  kernel: binder_thread_read+0xbd8/0x144c
  kernel: binder_ioctl_write_read.constprop.58+0x20c/0x348
  kernel: binder_ioctl+0x5d4/0x88c
  kernel: do_vfs_ioctl+0xb8/0xb1c
  kernel: SyS_ioctl+0x84/0x98
  kernel: cpu_switch_to+0x34c/0x22c0
  native: #00 pc 000000000007a2ac  /system/lib64/libc.so (__ioctl+4)
  native: #01 pc 00000000000276ec  /system/lib64/libc.so (ioctl+132)
  native: #02 pc 00000000000557d4  /system/lib64/libbinder.so (android::IPCThreadState::talkWithDriver(bool)+252)
  native: #03 pc 0000000000056494  /system/lib64/libbinder.so (android::IPCThreadState::waitForResponse(android::Parcel*, int*)+60)
  native: #04 pc 00000000000562d0  /system/lib64/libbinder.so (android::IPCThreadState::transact(int, unsigned int, android::Parcel const&, android::Parcel*, unsigned int)+216)
  native: #05 pc 000000000004ce1c  /system/lib64/libbinder.so (android::BpBinder::transact(unsigned int, android::Parcel const&, android::Parcel*, unsigned int)+72)
  native: #06 pc 00000000001281c8  /system/lib64/libandroid_runtime.so (???)
  native: #07 pc 0000000000947ed4  /system/framework/arm64/boot-framework.oat (Java_android_os_BinderProxy_transactNative__ILandroid_os_Parcel_2Landroid_os_Parcel_2I+196)
  at android.os.BinderProxy.transactNative(Native method) ————————————————关键行!!!
  at android.os.BinderProxy.transact(Binder.java:804)
  at android.net.IConnectivityManager$Stub$Proxy.getActiveNetworkInfo(IConnectivityManager.java:1204)—关键行!
  at android.net.ConnectivityManager.getActiveNetworkInfo(ConnectivityManager.java:800)
  at com.xiaomi.NetworkUtils.getNetworkInfo(NetworkUtils.java:2)
  at com.xiaomi.frameworkbase.utils.NetworkUtils.getNetWorkType(NetworkUtils.java:1)
  at com.xiaomi.frameworkbase.utils.NetworkUtils.isWifiConnected(NetworkUtils.java:1)
From the log stack, it can be seen that ANR occurred to obtain network information: getActiveNetworkInfo. The services of the system are all Binder mechanisms (16 threads), and the service capabilities are also limited. It is possible that the system services do not respond for a long time and cause ANR. If other applications occupy all Binder threads, the current application can only wait. You can search further: blockUntilThreadAvailable keyword:
at android.os.Binder.blockUntilThreadAvailable(Native method)
If the stack of a certain thread contains this word, you can further look at its stack to determine what system service is called. This kind of ANR is also a problem of the system environment. If this problem occurs frequently on a certain type of mobile phone, the application layer can consider an avoidance strategy.
Summarize
Most of the students may focus on business needs, and may not pay much attention to ANR issues, or directly rely on third parties, such as Bugly, but, in the interview, the interviewer will basically not ask you about the use of these tools. So let's learn it.