Front:
Frequently used search functions within browsers and IDEs
method:
Break the breakpoint in the unfamiliar method
and then debug and run, so that according to your operation, plus there is a breakpoint in the method, as long as you execute that method, you can know which step you are executing. .
Then in the next step, you can also observe the number of the variable value, and for example, if the return value is a class, you can actually see the attribute value inside the class.
Reading code is to follow the operation logic to read.
In this way, some core codes are read in a logical order, and non-core codes do not need to be read.
Instead of reading thousands of lines of code from the beginning to the end, it is difficult to understand.
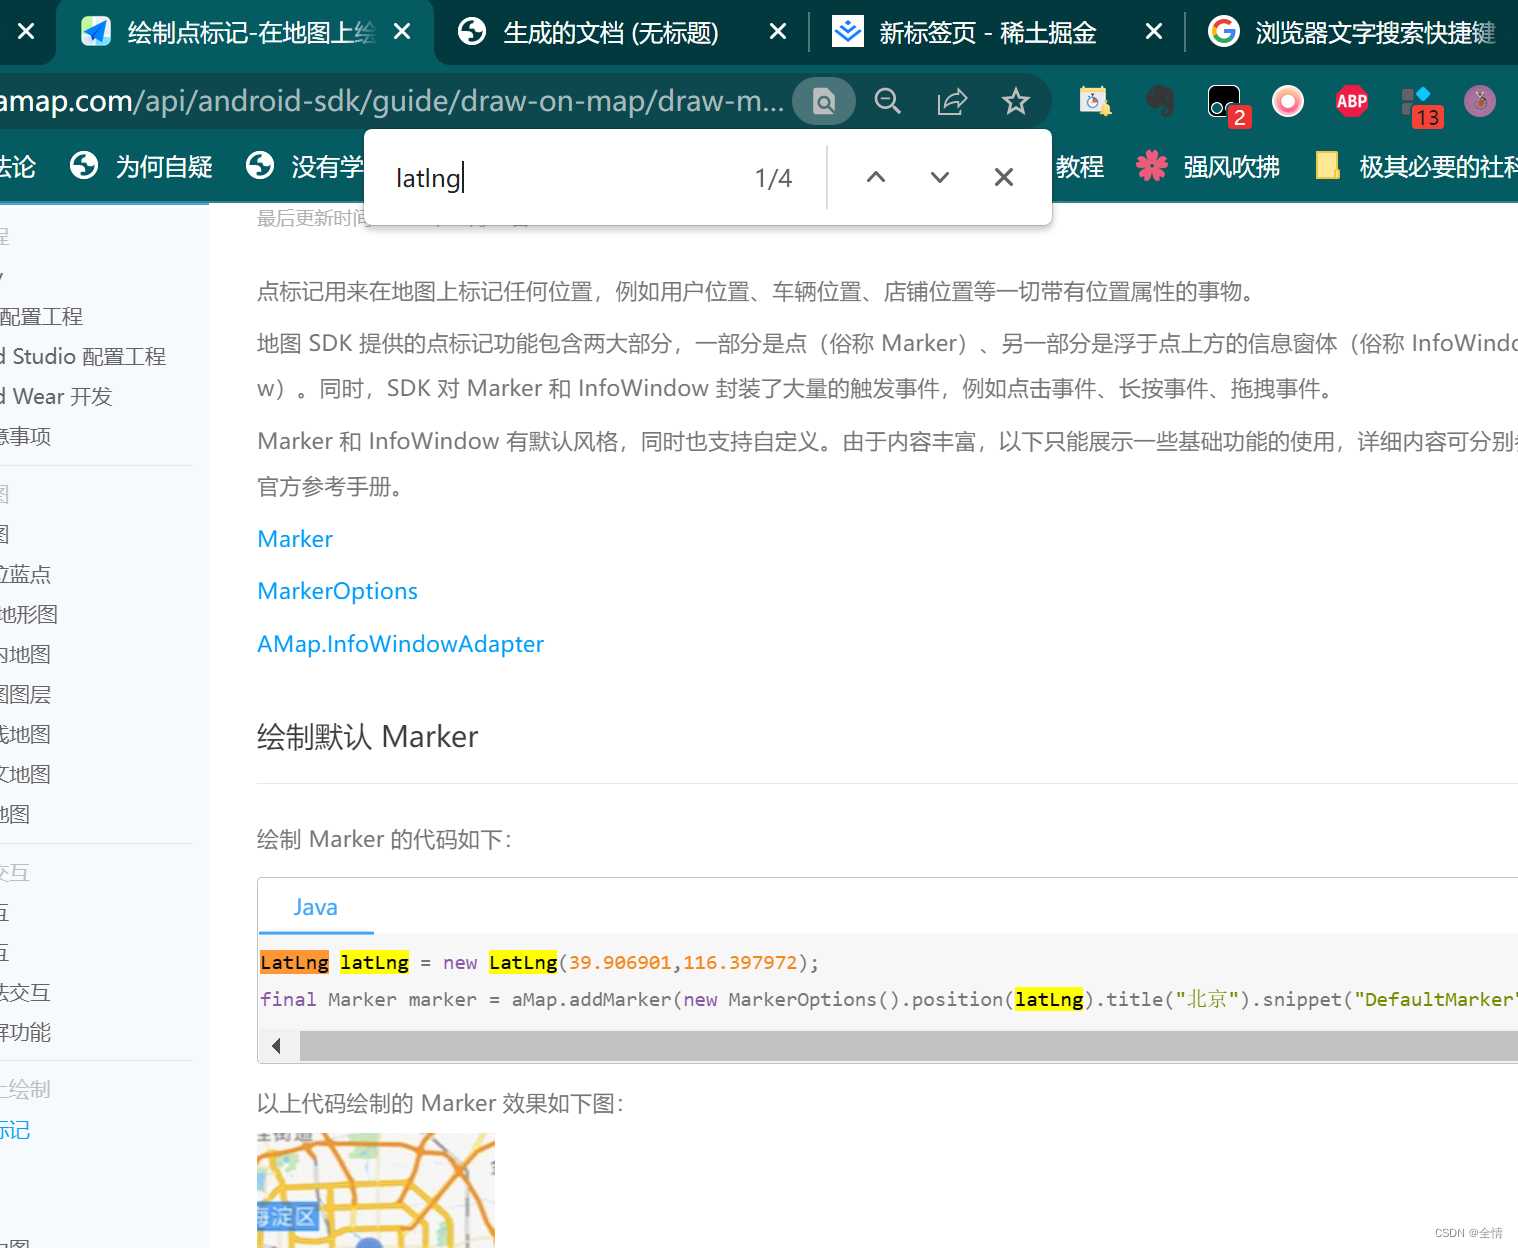
In addition, I read the Gaode api documentation today:
many things may have undergone update iterations
, and the package has become larger and larger, but the development documentation may not be updated.
In addition, no one has defined or stipulated that development documents must be comprehensive enough.
So even if many classes are not written in the development document, even if the name of the development document is to view all classes,
there is no or no.
I can only say to read the code by myself.
Reading code, writing code, and debugging code are the basic skills that cannot be escaped in the end.
In addition, if the variable name is irregular, we look at the method, it always has a get set method, we look at the method name
as debugging tutorial
This kind of hands-on thing, I feel that one-on-one will be very efficient. After consulting for more than ten minutes, I figured out the situation that I couldn't debug before. In the past, I used to read text tutorials for debugging, and there was always something I didn't understand.
The most efficient method is still: read the text tutorial for a quick start - practice by yourself and find that the tutorial is not easy to handle - ask someone for advice
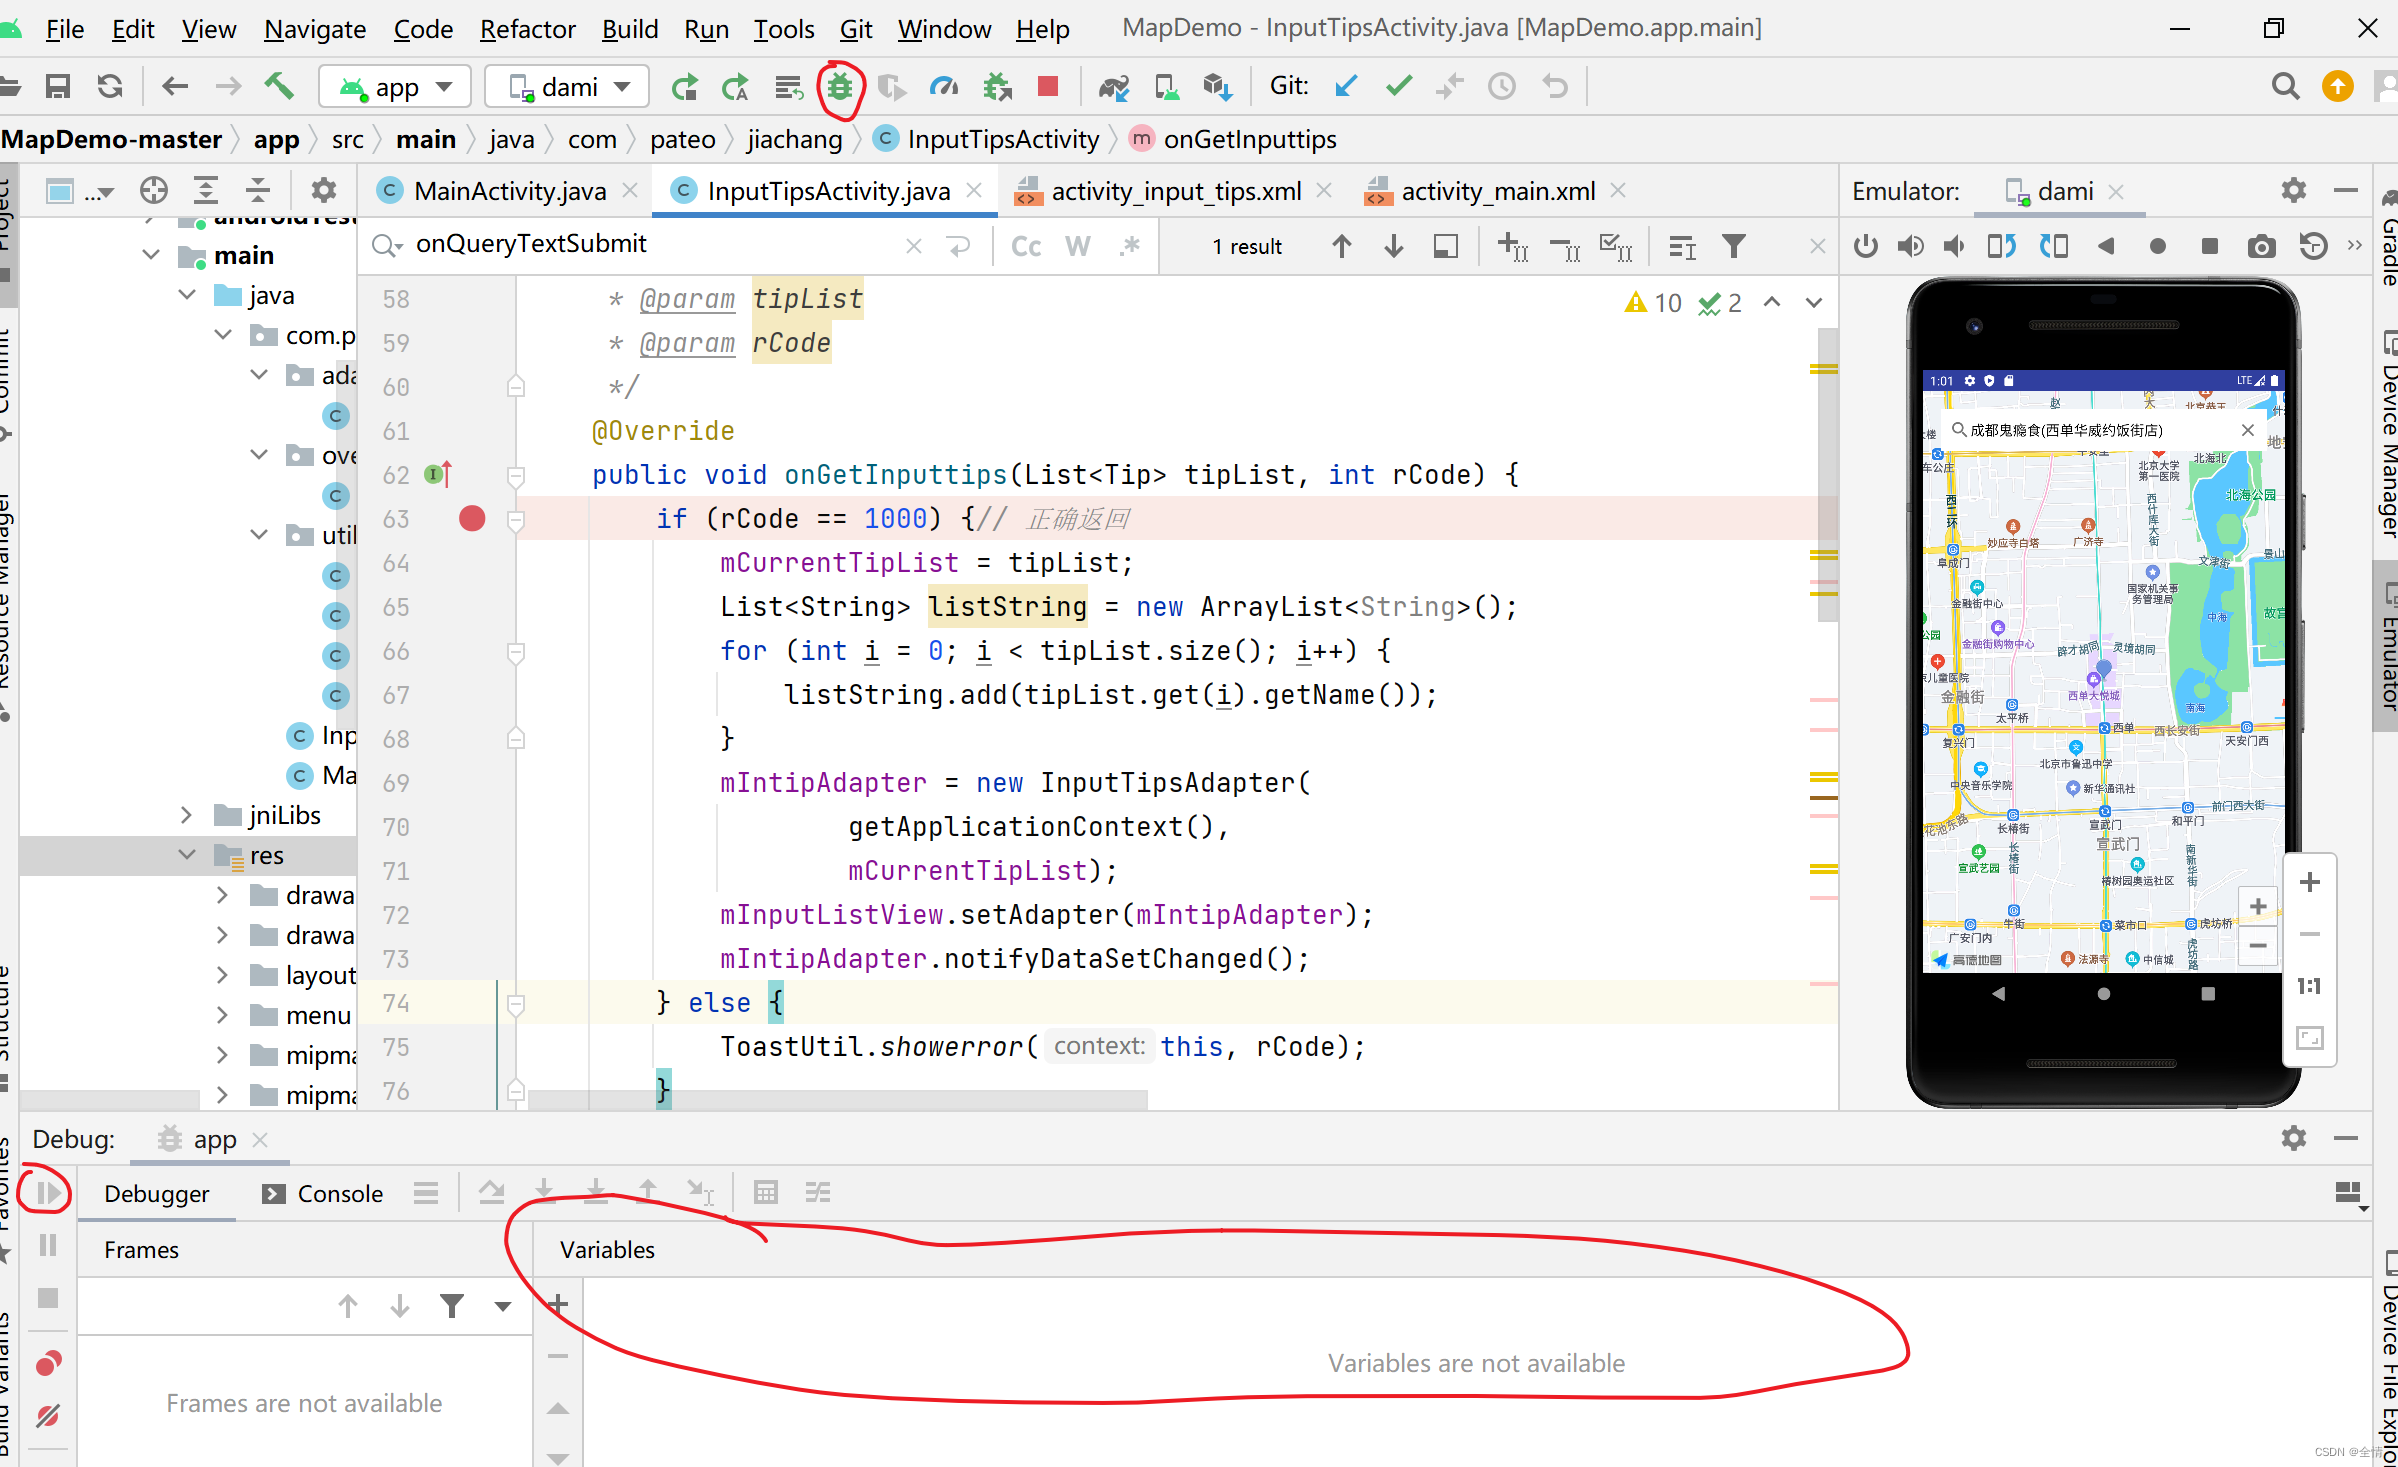
Debugging breakpoints at a certain method
will stop at this place during the running of the program:
we can put a breakpoint inside the method we don’t know, and then operate the program, so that we can observe which method will be in Stop when operating which step, so as to observe its effect.
Generally, after hitting a breakpoint, it will take you to continue running in the lower left corner, so that the program will continue to execute, and you can operate it until the part you are operating is used in the next breakpoint in a certain function, and it will continue to run again. pause.
If it is, it will run like a normal program until the next breakpoint. If there is no breakpoint next, it will run to the end.
Breakpoint, observe, continue to run (operate the program), next breakpoint, observe again, and
repeat like this. After running the program, read the code, in fact, you have finished reading the core code
As for a certain breakpoint, if you click step over, you will not enter and click the next step, but the statement that does not meet the conditions will not be enforced: eg:
breakpoint
:
if (I am handsome) { } else{ } Then even if the next step is to click on the statement in else, it will not actually be executed.
Until the return, there is no way to go to the next step, or until the end of the curly braces.
If this function happens to be a callback, the next step will be to enter its initiator to continue execution, which will lead to opening many classes (stuck in layer by layer, and may be executed endlessly).
So generally after the observation of the point is finished, point to continue running, let it run to the next breakpoint, and then observe new data.
Not only can it be observed in variable, but also a certain variable can be observed by lightly moving the mouse.
In addition, the break point is sometimes too troublesome, and we often write to the place where the bug may occur through the log to observe the output,
similar to the print output, so that the observation is more direct.