foreword
The Temperature Vegetation Dryness Index (TVDI) is a method for inversion of surface soil moisture in vegetation-covered areas based on optical and thermal infrared remote sensing channel data. As the Temperature Vegetation Drought Index (TVDI), which is related to both Normalized Difference Vegetation Index (NDVI) and Land Surface Temperature (LST), can be used for drought monitoring, especially for monitoring the relative drought degree of the whole area at a certain period in a specific year, and can be used for research Spatial variation characteristics of drought degree.
1. Calculation formula
The formula of temperature vegetation drought index is as follows:
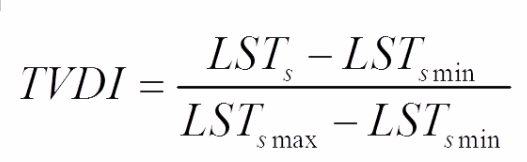
Among them, the wet edge equation:
LSTsmin = a * NDVI + bDry side equation:
LSTsmax = c * NDVI + dThe value range of TVDI is [0, 1].
The larger the value of TVDI, the lower the soil moisture, and the smaller the TVDI, the higher the soil moisture.
2. Dry and wet edge fitting
In the process of calculating the TVDI index, it is necessary to fit the dry edge equation and the wet edge equation, and the user needs to set the parameters by himself, which is a relatively important calculation step. The key to fitting is how to find the corresponding data of two sets of effective NDVI (equivalent to independent variable X) and LST (equivalent to dependent variable Y). This article will give a detailed description of the fitting process of dry and wet edges.
According to the input NDVI and LST data, with NDVI as the abscissa and LST as the ordinate, the scatter diagram of NDVI-LST can be obtained. According to the scatter diagram of NDVI-LST, the maximum and minimum values of LST corresponding to each NDVI value can be obtained, which is the dry edge and wet edge we require. Specific steps are as follows:
1) Divide NDVI into 100 equal parts, which are 0~0.01, 0.01~0.02, ,,,, 0.99~1.0 (can be modified according to specific circumstances);
2) Find the index of the NDVI value in each range in the NDVI image, and then obtain the grid value of the corresponding LST data according to these indices, and find the maximum and minimum values of the LST grid value in each range;
3) Calculate the maximum value and minimum value of the 100 LST grid values respectively, and then the scatter diagram of the dry and wet edges corresponding to NDVI-LST can be obtained, as shown in the figure below;
4) Set the effective value range of NDVI (usually 0.2~0.8), select the value within the effective range for linear fitting, and obtain the dry and wet edge equation.

3. Python implements TVDI calculation
The TVDI model is of great significance to drought monitoring, but the current GIS and remote sensing software lack tools for calculating TVDI. To implement this model requires programming, which is very troublesome. Someone used ENVI/IDL to calculate TVDI and developed a TVDI calculation patch, but it is very inflexible to use, and sometimes unknown errors may occur, causing a lot of trouble to users.
Therefore, this blog implements the calculation of TVDI based on the Python language. I have put the detailed code in the resource library ( https://download.csdn.net/download/u010329292/87682401 ), everyone can support it ~ thank you.