Article directory
Previous: [Paper Reading] Intensive Reading of Timing Action Detection Series Papers (2017)
4. Cascaded Boundary Regression for Temporal Action Detection
The purpose of the thesis - to solve the problem
- The proposal obtained by the sliding window may contain the salient features of the action, but may not contain the complete action .
Contribution - Innovation
- A new two-stage action detection network is proposed, which uses Cascaded Boundary Regression (CBR) for cascaded progressive boundary regression.
Implementation process
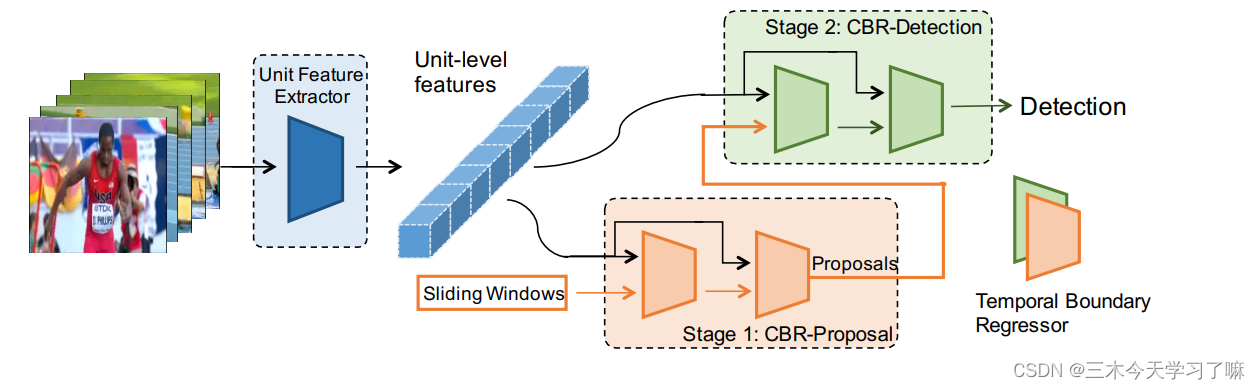
Propose a two-stage CBR network, input the action segment snippet, and the one-stage proposal network outputs the offset of the boundary regression (start/end time) and the action score of the segment (ignoring the action category) . If the score is higher than the threshold, it will be corrected. The last fragment is input into the two-stage detection network , and the specific action score under n+1 types of actions and the boundary offset corresponding to n types of actions are output. A concatenated asymptotic regression is performed on the bounds of the candidate boxes in both stages.
detailed method
-
Feature Extraction:
Crop the video into multiple non-overlapping units (units), and use C3D and dual-stream networks to extract features from the corresponding segments. A clip (clip) consists of multiple units, and these units are called internal units; the units before and after the clip that are used for boundary regression are called context units, which are important for temporal boundary inference . Intrinsic features and semantic features are respectively pooled from unit-level features through the mean pooling operation P.

where || stands for vector concatenation. Videos are scanned through a multi-scale temporal sliding window. A temporal sliding window is modeled by two parameters: window length l_i and window overlap o_i . Note that while segments at multiple scales will overlap in time, segment-level features are computed from unit-level features, which are computed only once. -
Temporal Coordinate Regression:
For boundary regression, previous work mainly used parameterized coordinates offsets , that is, first parameterized the center position and length of the candidate frame (from which the boundary coordinates of the candidate frame can be derived) , and then express the specific offset based on the center and length coordinates. For example,
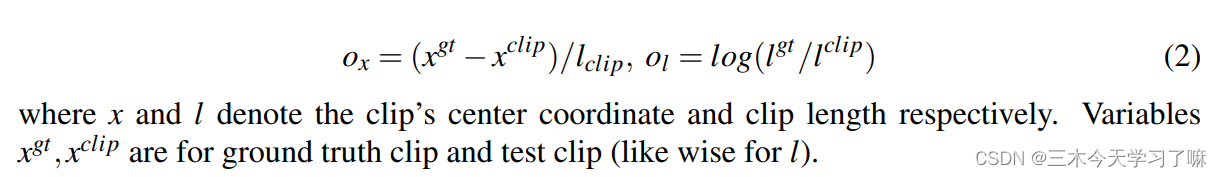
the idea of this article is to directly perform the regression of specific coordinates. Since the marking unit of GT is usually seconds, first multiply by FPS to calculate the frame corresponding to the start/end time, and then determine the unit index corresponding to the start/end time through the unit length and rounding operation, and then perform fine coordinate regression: s_clip
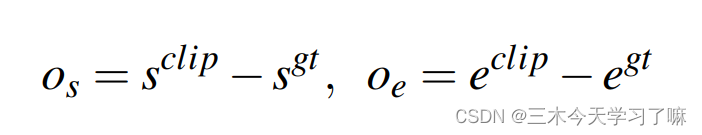
and e_clip can be a unit-level label or a frame-level label, and the paper chooses the former at the end. The intuition behind unit-level coordinate regression is that since the underlying unit-level feature is extracted to encode Nu frames, this feature may not be discriminative enough to regress frame-level coordinates. Cell-level coordinate regression is easier to learn than frame-level regression, despite its coarser bounds. -
Two-Stage Proposal and Detection Pipeline:
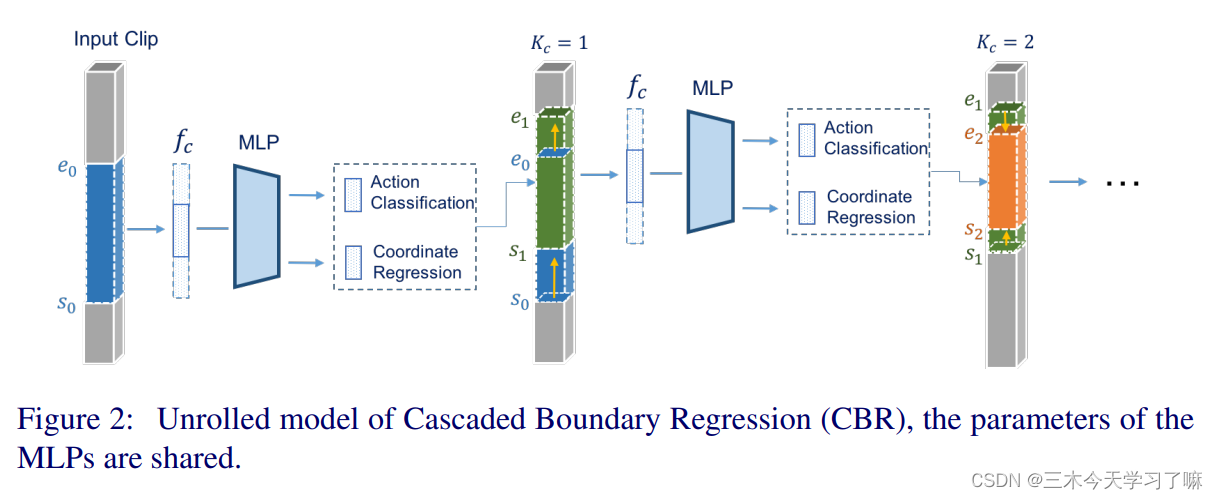
In the two stages of proposal and detection, boundary regression is performed in a cascaded manner: the output boundary is used as feedback and then fed back to the network for further correction. (Iterative thinking) As shown in the figure, each correction process consists of K regressions, the final box is the result of K corrections, and the final action score is also the product of K scores. The two-stage networks are trained separately, but network parameters are shared within each stage for simplicity .
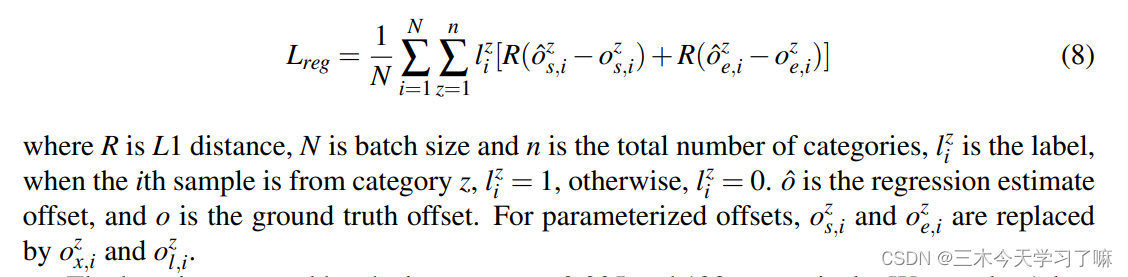
Loss Function:

where L_cls is the classification loss, which is the standard cross-entropy loss. For the proposal network, L_cls is the binary classification cross-entropy loss; for the detection network, L_cls is the standard multi-class cross-entropy loss. L_reg is used for time coordinate regression, and λ is a hyperparameter, which is set empirically. The regression loss is:
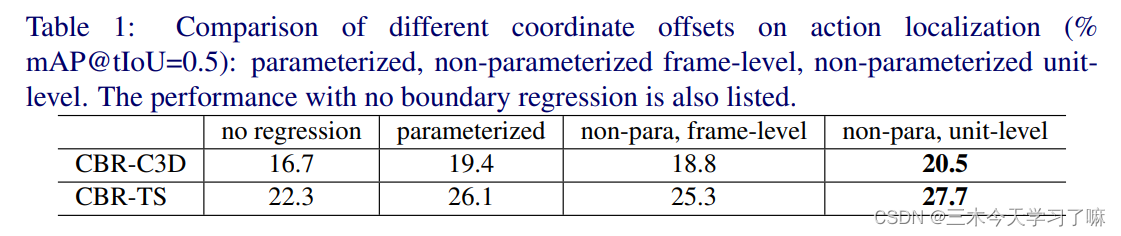
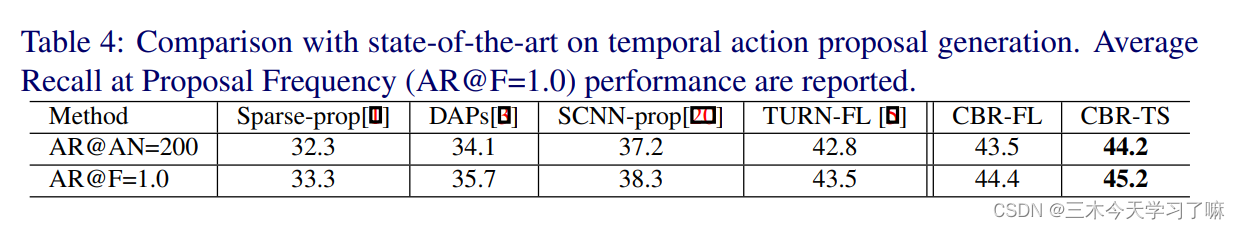
the experimental results show that the direct regression of the coordinates is better than the parameterized regression (the author believes that this is because the length of the video is not as easy to scale as the target in the image); the regression based on unit-level is better than the regression based on frame -level regression (the author believes that the frame-level coordinates may contain unnecessary information); using the features extracted by the dual-stream network as input is better than the C3D network.
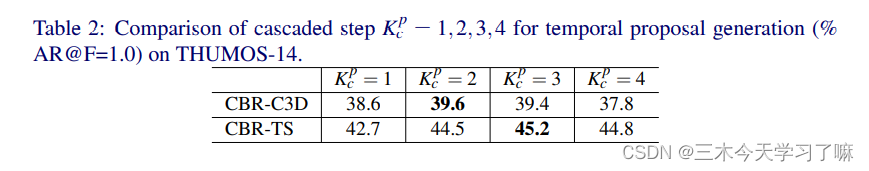
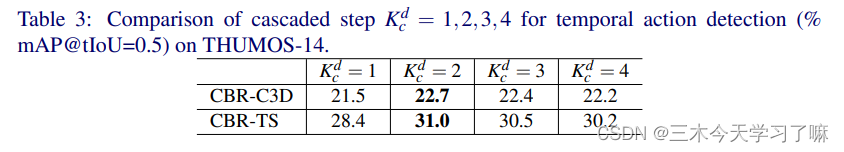
At the same time, for the number of internal regressions of the CBR module, the optimal value is different in different stages and different features, and the more the better. However, the experiment also showed some defects. For different data sets, parameters such as the scale of the sliding window and the number of internal regressions of CBR need to be adjusted manually.
The handcrafted features are too obvious, and the network generalizes poorly to different datasets.
5. R-C3D: Region Convolutional 3D Network for Temporal Activity Detection
The purpose of the thesis - to solve the problem
- Current methods rely on the generation of external proposals or exhaustive sliding windows (Temporal Aaction Proposal), resulting in computational inefficiency.
- Deep features such as VGG, ResNet, and C3D are learned separately in image/video classification tasks. Such off-the-shelf representations may be suboptimal for localizing activities in different video domains , leading to poor performance. (i.e. poor migration)
Contribution - Innovation
- An end-to-end 3D region convolutional network model (Region Convolutional 3D Network, R-C3D), which combines the candidate box generation and classification stages , and can detect activities of arbitrary length;
- Fast detection speed (5x faster than current methods) is achieved by sharing fully convolutional C3D features between the proposal generation and classification parts of the network ;
In general, the author believes that TAP (Temporal Aaction Proposal) and classification should not be separated, so an end-to-end network is set up to learn two parts of knowledge at the same time; the author believes that the feature extraction method of 2D convolution lacks timing information, so 3D convolution is used to hope Learn new connections.
Implementation process
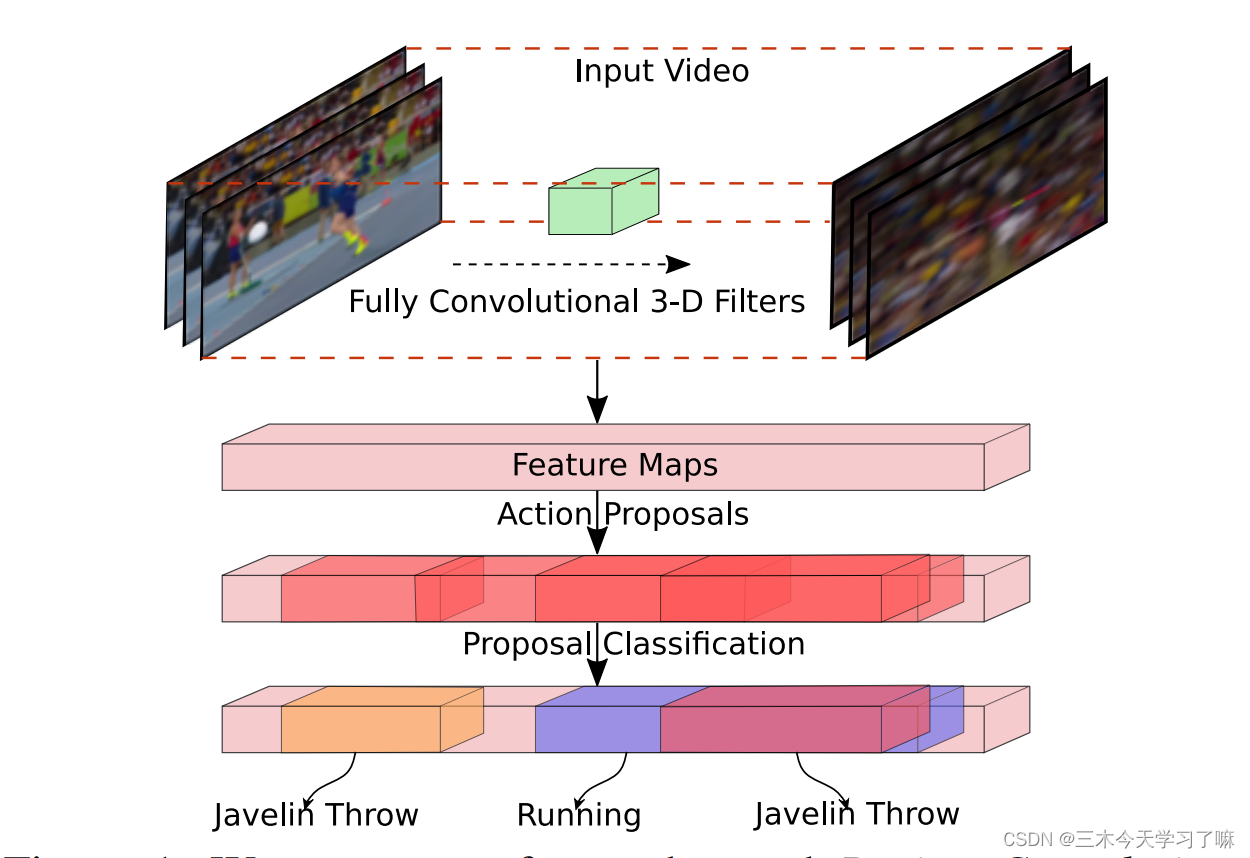
The network encodes frames with fully convolutional 3D filters, proposes activity proposals, and then classifies and refines them based on aggregate features within their boundaries.
detailed method
As shown in the figure below, it is mainly divided into three parts: 3D convolution feature extraction module, candidate frame generation module, action frame correction and classification module.
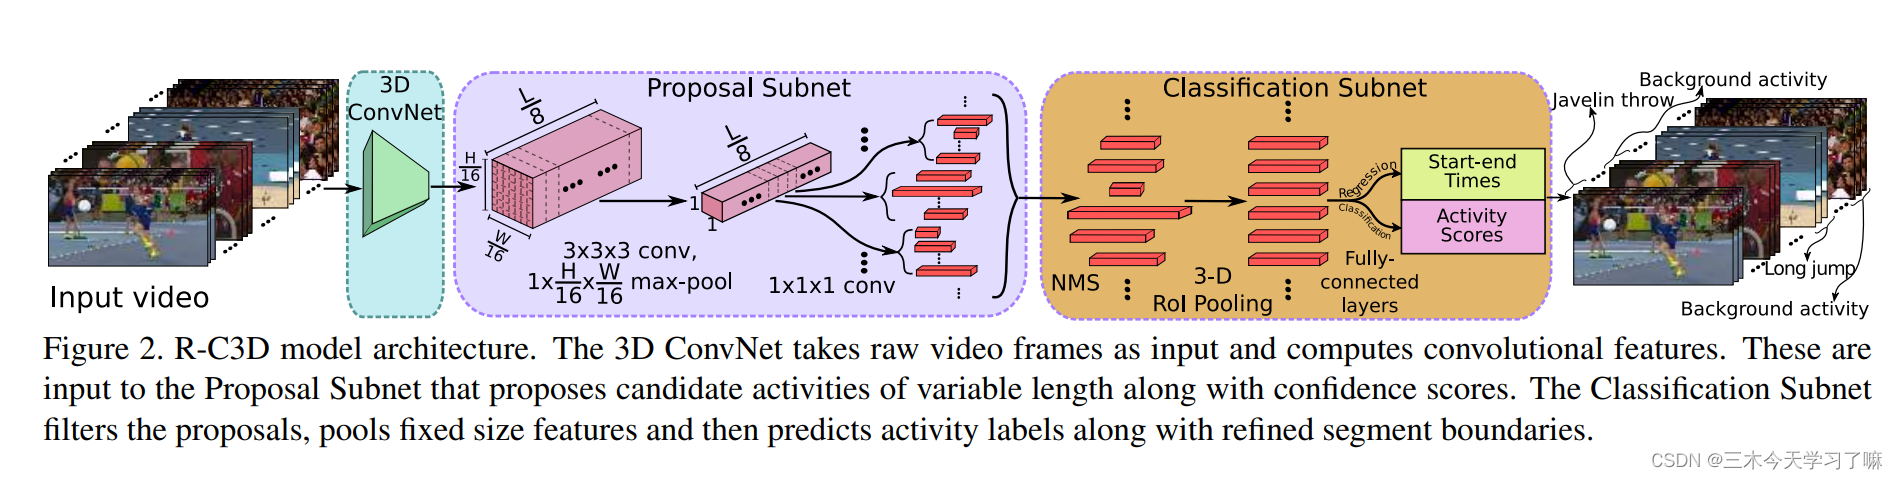
Temporal Proposal Subnet:
- For a video input of 3* L* H* W dimension, pass it through the convolutional layer (conv1a-conv5b) of the 3D ConvNet network proposed by C3D to get 512*(L/8)* (H/16)* (W/ 16) Dimensional output. The input video duration L only depends on the memory.
- In the Proposal Subnet part, candidate boxes are generated based on the anchor idea. Specifically, for an input of 512*(L/8)* (H/16)* (W/16) dimension, a 3* 3* 3 3D convolutional layer and a 1*(H/16)* ( W/16) 3D maximum pooling layer , get 512* (L/8)* 1* 1-dimensional output, and then use K pre-defined anchors at each time point, and finally get (L/8) * K candidate segments of 512 dimensions.
- Mark the fragments with IoU>0.7 or the largest IoU as positive samples containing actions, mark the fragments with IoU less than 0.3 as background negative samples, and select 1:1 positive and negative samples for training.
Activity Classification Subnet:
-
In the Classification Subnet section, first perform greedy NMS operations on the fragments obtained in the previous step;
-
Then perform 3DRoI pooling operation on the obtained fragments of any length (approximately Faster R-CNN, cut and pool the input of any dimension to obtain the output of specific dimension, the specific input is the feature of 3D ConvNet under the specific fragment area) .
-
Finally, a fully connected layer is connected after the features of a specific size to perform category judgment and boundary regression respectively.
-
Mark the clips with IoU>0.5 or the largest IoU as their action categories, mark the clips with IoU less than 0.5 as background negative samples, and select 1:3 positive and negative samples for training
Optimization:
- The softmax loss function is used for classification, and the Smooth L1 loss function is used for boundary regression, and the two are jointly optimized. The input of the boundary regression points to the difference between the anchor box and the ground truth box in the center position and duration.
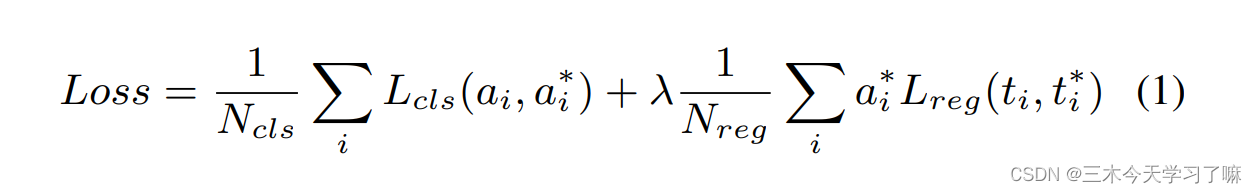
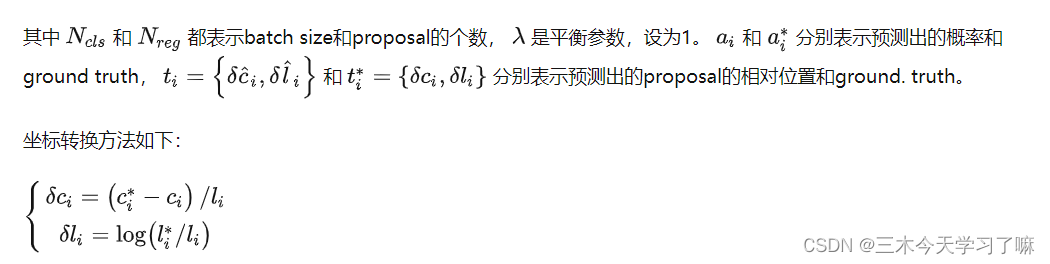
λ is the loss trade-off parameter, set to 1 value. The above loss function applies to both the temporal proposal subnetwork and the activity classification subnetwork.
In Temporal Proposal Subnet, the binary classification loss L-cls predicts whether a proposal contains an activity, while the regression loss L-reg optimizes the relative displacement between candidate boxes and ground truth. Loss is independent of activity class.
For the Activity Classification Subnet, the multi-class classification loss L-cls predicts the specific activity category of the candidate box, and the number of categories is the number of activities plus the number of backgrounds. The regression loss L-reg optimizes the relative displacement between the activity and ground truth. All four losses for the two subnetworks are jointly optimized.
Supplement:
Note that the boundary regression results of the two subnets both use the relative position form of the center and length. In order to obtain the real start and end time, it is necessary to use the inverse transformation of the coordinate transformation formula described above.
6. Single Shot Temporal Action Detection
Thesis notes written by the author himself
The purpose of the thesis - to solve the problem
- The existing model, the detection network and the recognition network need to be trained separately. Ideally, joint training can be performed to obtain the optimal model .
- The detection network requires additional computation time to generate proposals .
- The proposal boundary generated by using the sliding window is usually not accurate enough , and the sliding window method needs to determine the window size in advance, which can only handle fixed-length segments , and cannot be flexibly applied to variable-length segments.
Contribution - Innovation
- The Single Shot Action Detector (SSAD) network proposed in the paper, in order to better encode the spatial and temporal information in the video, uses multiple action recognition models (action classifiers) to extract multi-granularity features.
- The SSAD network is a one-stage network. It does not need to generate a prediction proposal first, and directly predicts the timing boundary and confidence of the action.
Implementation process
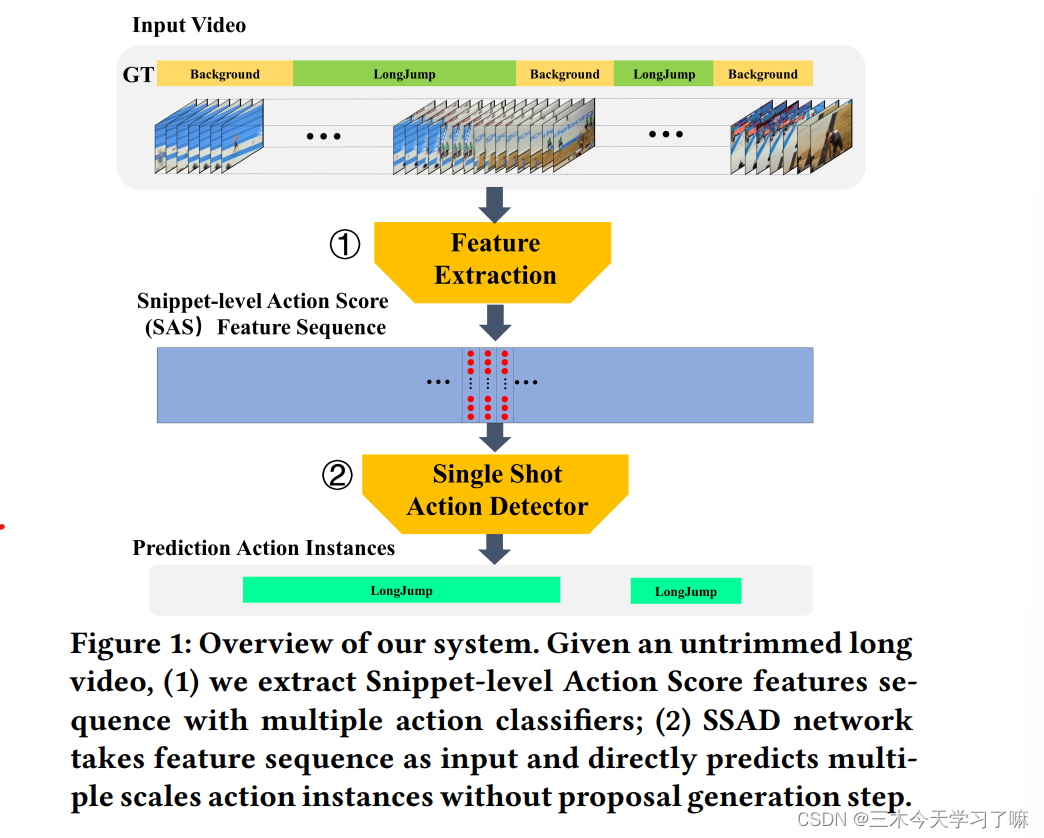
Given an uncropped long video, extract the Snippet-level Action Score (SAS) feature sequence through multiple action classifiers, input the feature into the SSAD network and directly output multi-size action instances (starting moment + category).
detailed method
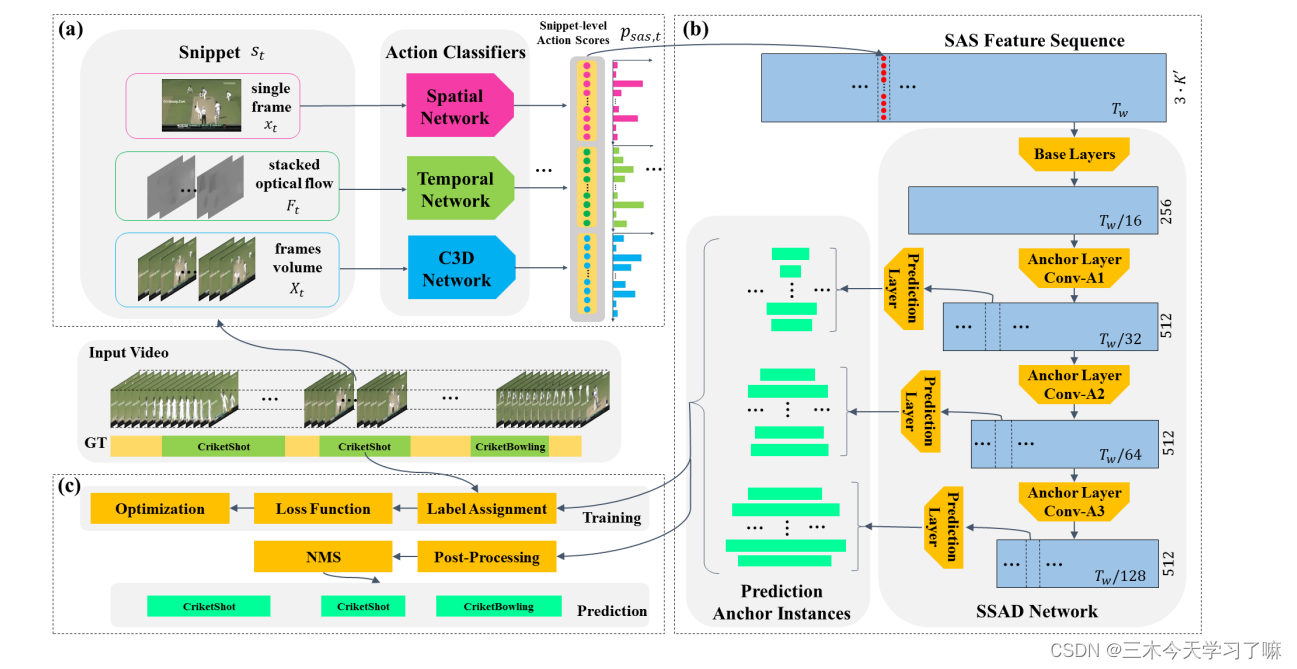
(a) Feature extraction:
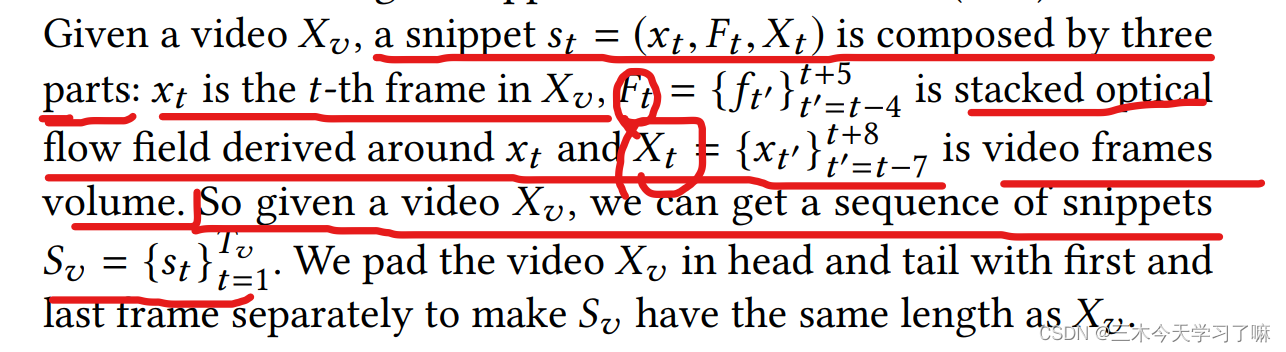
For videos of different lengths, first use a specific length window to cut videos of equal length, and then convert them into snippets . The tth segment includes the image information of the tth frame, the optical flow information of 8 frames centered on the tth frame, and the 16 frames of video information centered on the tth frame. (Padding is performed on equal-length videos so that the number of snippets is the same as the number of equal-length video frames)
Then use multiple action classification models (spatial flow and time flow of the dual-stream network, C3D network) to extract multi-granularity features, the t-th frame and the corresponding optical flow information enter the Spatial and Temporal branches of the dual-stream network, and continuous video information enters C3D network. For each segment, three independent classifiers give the probability of the segment corresponding to K+1 class (K class action + background), and then perform a simple concatenate operation on the result to construct the SAS feature (Snippet-level Action Score) . For a video with a duration of T, the extracted feature size is T* 3* (K+1).
(b) The SSAD network consists of three submodules:
(1) The role of Base layers is to shorten the length of the feature sequence and increase the receptive field of each position in the feature sequence.
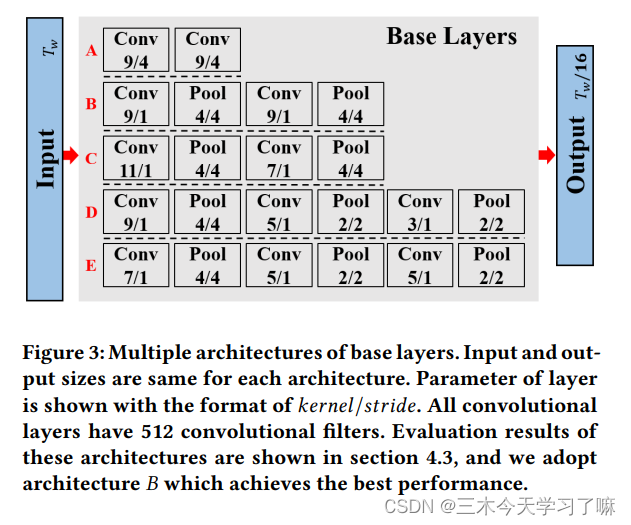
In the base layer, two consecutive conv(9/1)+pool(4/4) operations are performed, Output features of size (T/16)*256;
(2) The Anchor layer gradually reduces the feature dimension, so that the network can predict on multiple scales.
The output anchor feature map sizes of the anchor layers are (Tw /32 × 512), (Tw /64 × 512) and (Tw /128 × 512) respectively. Multiple anchor layers gradually reduce the temporal dimension of feature maps, enabling SSAD to obtain prediction results from multi-resolution feature maps.
The lower anchor feature maps have higher resolution and smaller receptive fields than the upper anchor feature maps. So we let the lower anchor layer detect short action instances and the upper anchor layer detect long action instances.
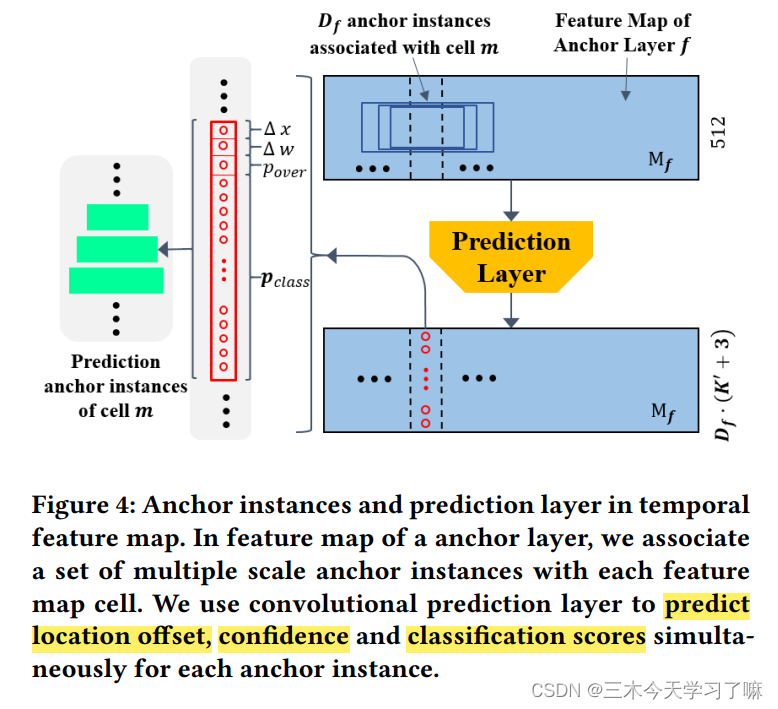
(3) The prediction layer generates class probabilities, position offsets and overlap scores for these anchored action instances.
(c) Training and Prediction:
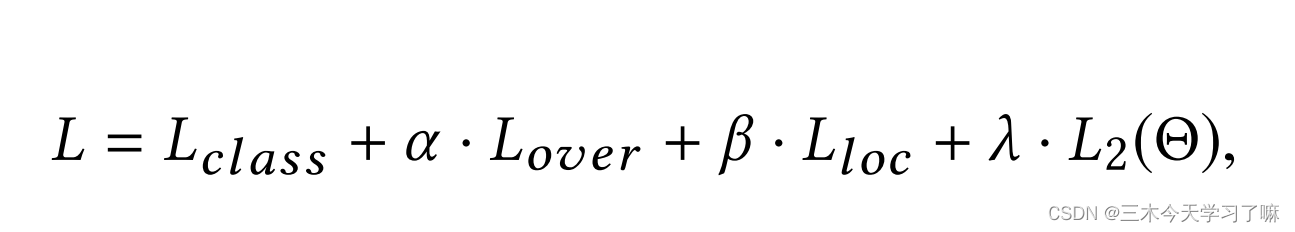
Training: The training goal of the SSAD network is to solve a multi-task optimization problem. The overall loss function includes the following parts, softmax-based action classification loss, MSE-based overlap loss, Smooth L1-based boundary regression loss and L2 regularization loss, where overlap is for subsequent NMS operations; prediction and post-processing: continue
to use The data preparation method in the aforementioned training process is used to prepare the test data, but there are two changes: (1) The overlap rate of the window is reduced to 25% to improve the prediction speed and reduce redundant prediction; (2) During the prediction process, Windows without annotations are not deleted, but all windows are retained, because the deletion operation is actually a leak of annotation information.
After obtaining all the prediction action instances of a video, this paper uses NMS (non-maximization suppression) to deduplicate overlapping predictions. In order to obtain the final temporal action detection results.
Feature encoding methods such as Fisher Vector [38] and VAE [24] are widely used
in action recognition task to improve performance.
Feature encoding methods such as Fisher Vector [38] and VAE [24] are widely used in action recognition task, to improve performance. Where I need to study in the future