Explanation: This is a machine learning practical project (with data + code + documentation + video explanation). If you need data + code + documentation + video explanation, you can go directly to the end of the article to get it.
1. Project background
Ant Colony Optimization (ACO) is a new bionic evolutionary algorithm derived from the natural biological world, adopted by Italian scholars M. Dorigo, V. Maniezzo and A. Colorni in the early 1990s. A population-based heuristic random search algorithm that simulates the collective path-finding behavior of ants in nature". Ants have the ability to find the shortest path from the nest to the food source without any prompts, and can change with the environment, Adaptively search for new paths and produce new choices. The fundamental reason is that when ants are looking for food, they can release a special secretion—pheromone (also known as pheromone) on the path they walk, and then As time goes by, the substance will gradually volatilize, and the probability that the subsequent ants choose this path is proportional to the intensity of the pheromone on this path at that time. When more and more ants pass through a path, the pheromone left by it will also More and more, the probability of ants choosing this path is higher, which increases the intensity of pheromone on this path. And the pheromone with high intensity will attract more ants, thus forming a positive feedback mechanism. Through this positive feedback mechanism, ants can eventually find the shortest path.
This project uses the ACO ant colony optimization algorithm to find the optimal parameter value to optimize the Catboost regression model.
2. Data acquisition
The modeling data for this time comes from the Internet (compiled by the author of this project), and the statistics of the data items are as follows:
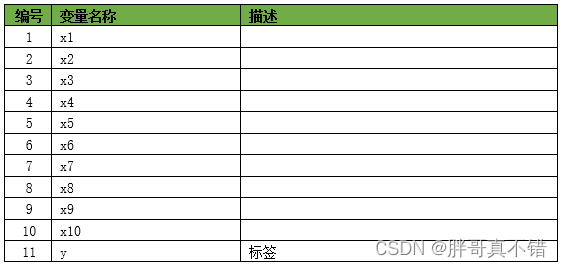
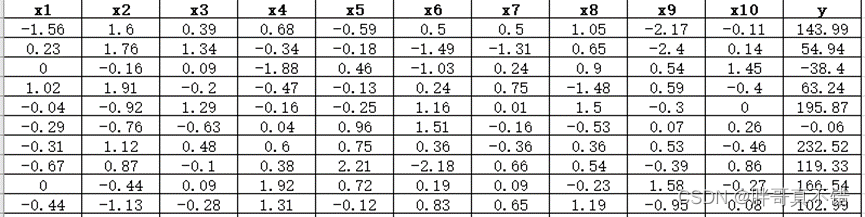
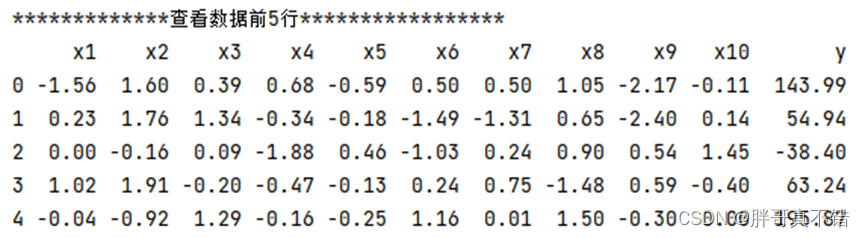
The data details are as follows (partial display):
3. Data preprocessing
3.1 View data with Pandas tools
Use the head() method of the Pandas tool to view the first five rows of data:
key code:
3.2 Data missing view
Use the info() method of the Pandas tool to view data information:
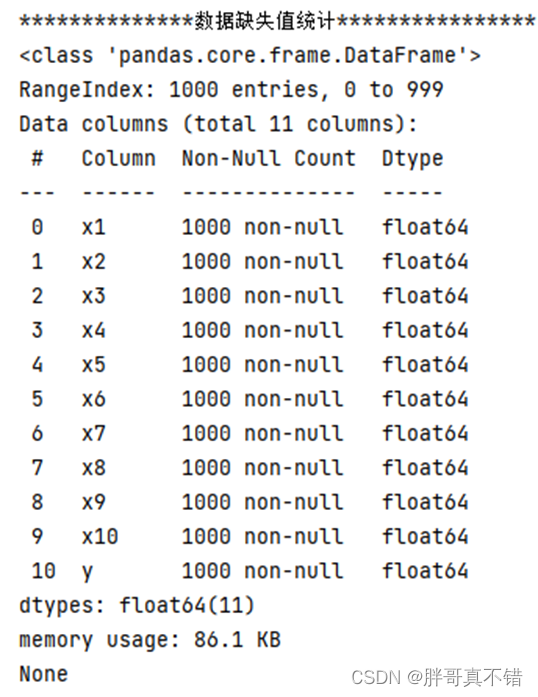
As can be seen from the above figure, there are a total of 11 variables, and there are no missing values in the data, with a total of 1000 data.
key code:
3.3 Data descriptive statistics
Use the describe() method of the Pandas tool to view the mean, standard deviation, minimum, quantile, and maximum of the data.

The key code is as follows:
4. Exploratory Data Analysis
4.1 Histogram of y variables
Use the hist() method of the Matplotlib tool to draw a histogram:

As can be seen from the figure above, the y variable is mainly concentrated between -400 and 400.
4.2 Correlation analysis

As can be seen from the figure above, the larger the value, the stronger the correlation. A positive value is a positive correlation, and a negative value is a negative correlation.
5. Feature Engineering
5.1 Establish feature data and label data
The key code is as follows:

5.2 Dataset splitting
Use the train_test_split() method to divide according to 80% training set and 20% test set. The key code is as follows:

6. Build the ACO ant colony optimization algorithm to optimize the CATBOOST regression model
Mainly use the ACO ant colony optimization algorithm to optimize the CATBOOST regression algorithm for target classification.
6.1 Optimal parameters found by ACO ant colony optimization algorithm
key code:
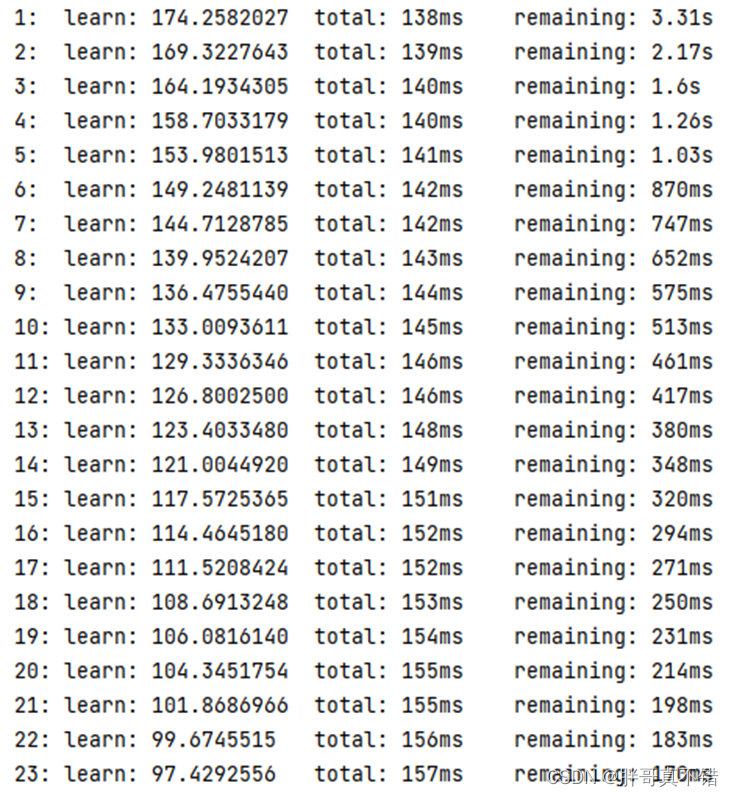
Process data for each iteration:
 Optimal parameters:
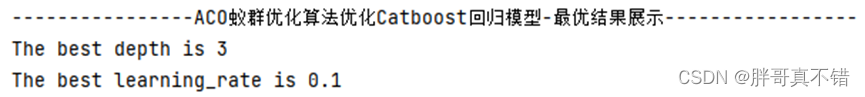
6.2 Optimal parameter value construction model

7. Model Evaluation
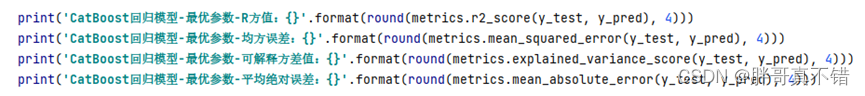
7.1 Evaluation indicators and results
The evaluation indicators mainly include explainable variance value, mean absolute error, mean square error, R square value and so on.

It can be seen from the above table that the R square is 0.9827, which means that the model works well.
The key code is as follows:
 7.2 Comparison chart of actual value and predicted value
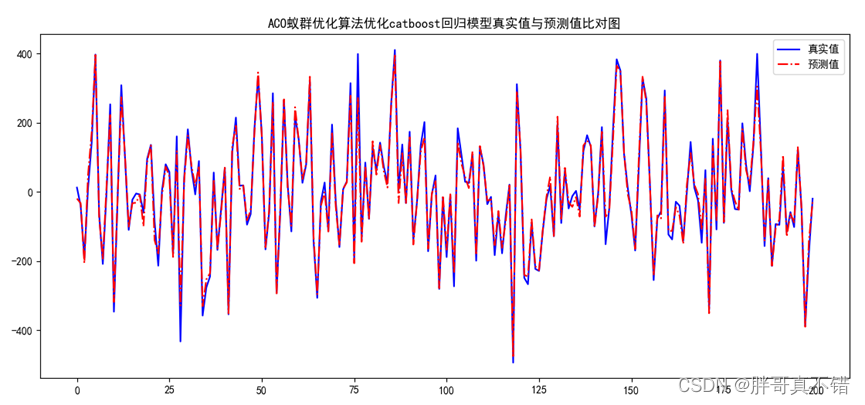
From the above figure, it can be seen that the fluctuations of the actual value and the predicted value are basically the same, and the model fitting effect is good.
8. Conclusion and Outlook
To sum up, this paper uses the ACO ant colony optimization algorithm to find the optimal parameter values of the CATBOOST regression algorithm to build a regression model, which finally proves that the model we proposed works well. This model can be used for forecasting of everyday products.
# ====定义惩罚项函数======
def calc_e(X):
    """计算蚂蚁的惩罚项,X 的维度是 size * 2 """
    ee = 0
    """计算第一个约束的惩罚项"""
    e1 = X[0] + X[1] - 6
    ee += max(0, e1)
    """计算第二个约束的惩罚项"""
    e2 = 3 * X[0] - 2 * X[1] - 5
    ee += max(0, e2)
    return ee


# ******************************************************************************

# 本次机器学习项目实战所需的资料,项目资源如下:

# 项目说明:

# 链接:https://pan.baidu.com/s/1c6mQ_1YaDINFEttQymp2UQ

# 提取码:thgk

# ******************************************************************************


# ===定义子代和父辈之间的选择操作函数====
def update_best(parent, parent_fitness, parent_e, child, child_fitness, child_e, X_train, X_test, y_train, y_test):
    """
        针对不同问题,合理选择惩罚项的阈值。本例中阈值为0.1
        :param parent: 父辈个体
        :param parent_fitness:父辈适应度值
        :param parent_e    :父辈惩罚项
        :param child:  子代个体
        :param child_fitness 子代适应度值
        :param child_e  :子代惩罚项
        :return: 父辈 和子代中较优者、适应度、惩罚项
        """

    if abs(parent[0]) > 0:  # 判断取值
        depth = int(abs(parent[0])) + 3  # 赋值
    else:
        depth = int(abs(parent[0])) + 5  # 赋值

    if abs(parent[1]) > 0:  # 判断取值
        learning_rate = (int(abs(parent[1])) + 1) / 10  # 赋值
    else:
        learning_rate = (int(abs(parent[1])) + 1) / 10  # 赋值
For more project practice, see the list of machine learning project practice collections:
List of actual combat collections of machine learning projects