Technology stack:
Flask framework, Selenium crawler, machine learning, multiple linear regression prediction model, LayUI framework, Echarts visual large screen, Taobao data collection
The core content of this topic is the basic needs of the data analysis platform as the background, and the platform is built according to the pre-designed ideas. After using Selenium crawler technology to crawl the data and clean it with Pandas, import the data into MySQL, use data visualization technology to visually display the data, and also use the multiple linear regression algorithm in machine learning to predict product sales, and Import background to view or use in background management. Finally, the platform uses black-box testing to conduct functional tests on data management and background management. The test results are in line with expectations and the platform can operate normally.
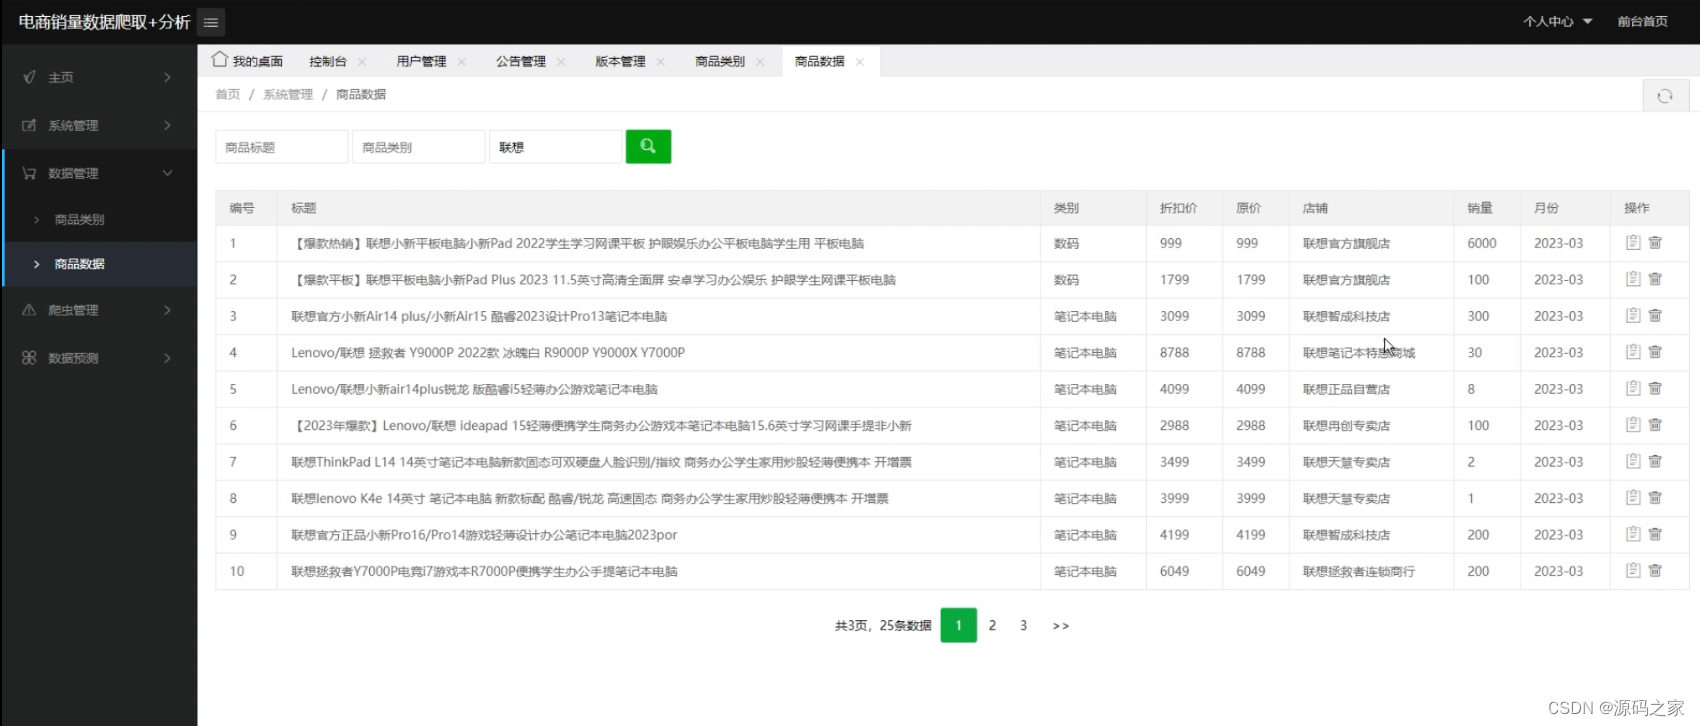
The main purpose of the data management module is to collect, clean, analyze, visualize, and predict data. And store the obtained data in the database, call it in the database when different data are needed in different modules of sales forecast, data visualization, and background management, and then render to the corresponding interface.
(1) Data acquisition module design
Data collection is the basis of data analysis. Data collection takes Taobao e-commerce as the crawling target, uses selenium crawler technology to crawl product-related data, and divides them into different product categories. For null values and abnormal values, use Python's Numpy library and Pandas Database, remove dirty data and empty data in the data, normalize the data, analyze different indicators, and then store the data in the database. Take out data as needed to provide data for subsequent data visualization and machine learning.
Common data sources are divided into four categories: open data sources, crawlers, log collection, and sensors. This paper adopts the method of crawler crawling to realize data collection. Selenium is an automated testing tool, which can imitate human behavior after opening the browser, and directly extract various information on the web page.
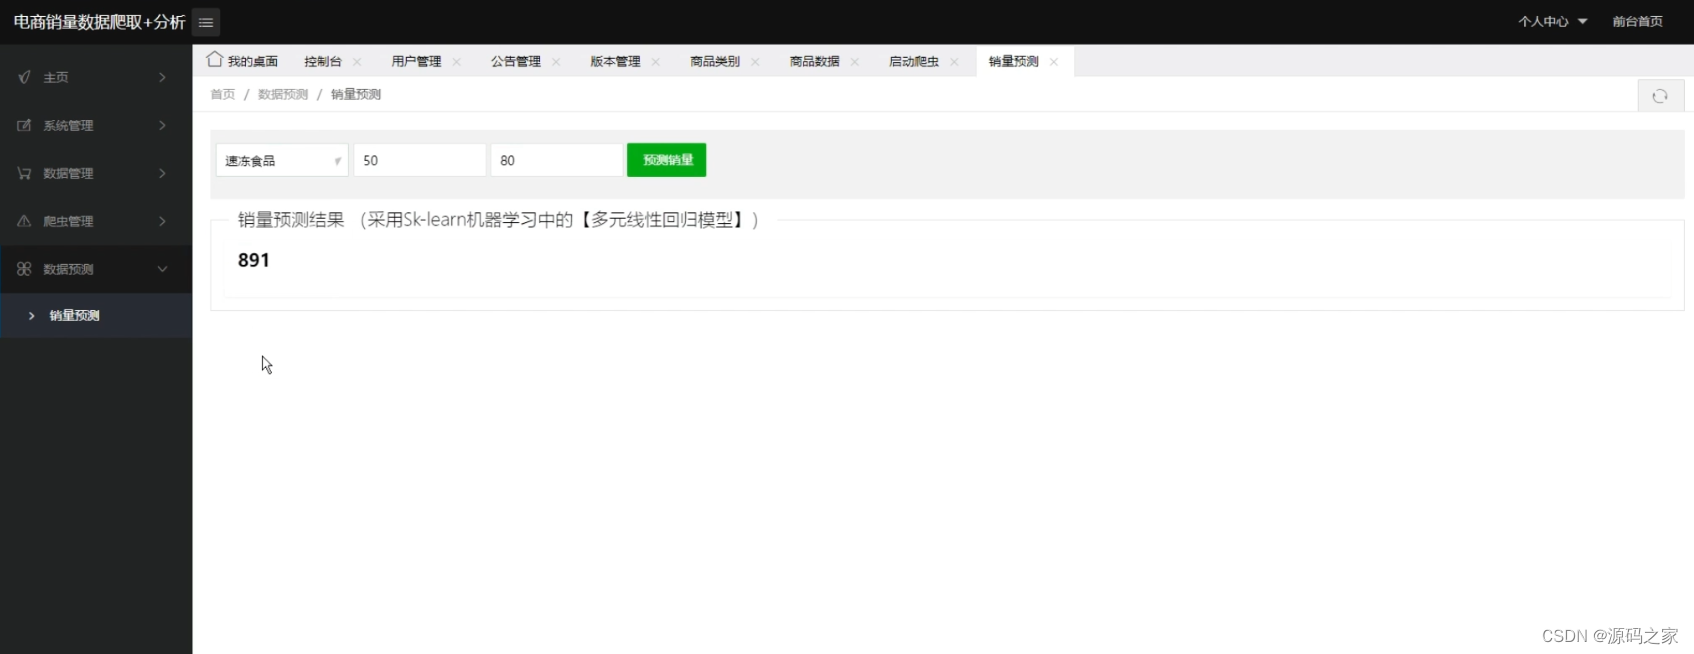
(2) Data prediction module design
Accurate sales forecast can effectively reduce the profit loss caused by inventory overstock or inventory shortage, help managers to better formulate marketing strategies and improve customer satisfaction levels, so that community e-commerce can establish long-term competitive advantages. The data prediction part needs to analyze the data in advance, understand the basic characteristics of the data, preprocess it according to the characteristics of the data, and convert the data into the format required by machine learning. Using the machine learning multiple linear regression algorithm to build a prediction model, we can divide the training set, verification set and test set based on the data pool. The training set data is used for the training of the model, so that the model can learn the mapping relationship between the feature value and the target variable. The performance of the model is evaluated by minimizing the loss function. After selecting the correct algorithm, you can try to adjust the hyperparameters to improve it to obtain better performance; finally, apply the model after evaluating it on the test set.
(3) Data visualization module design
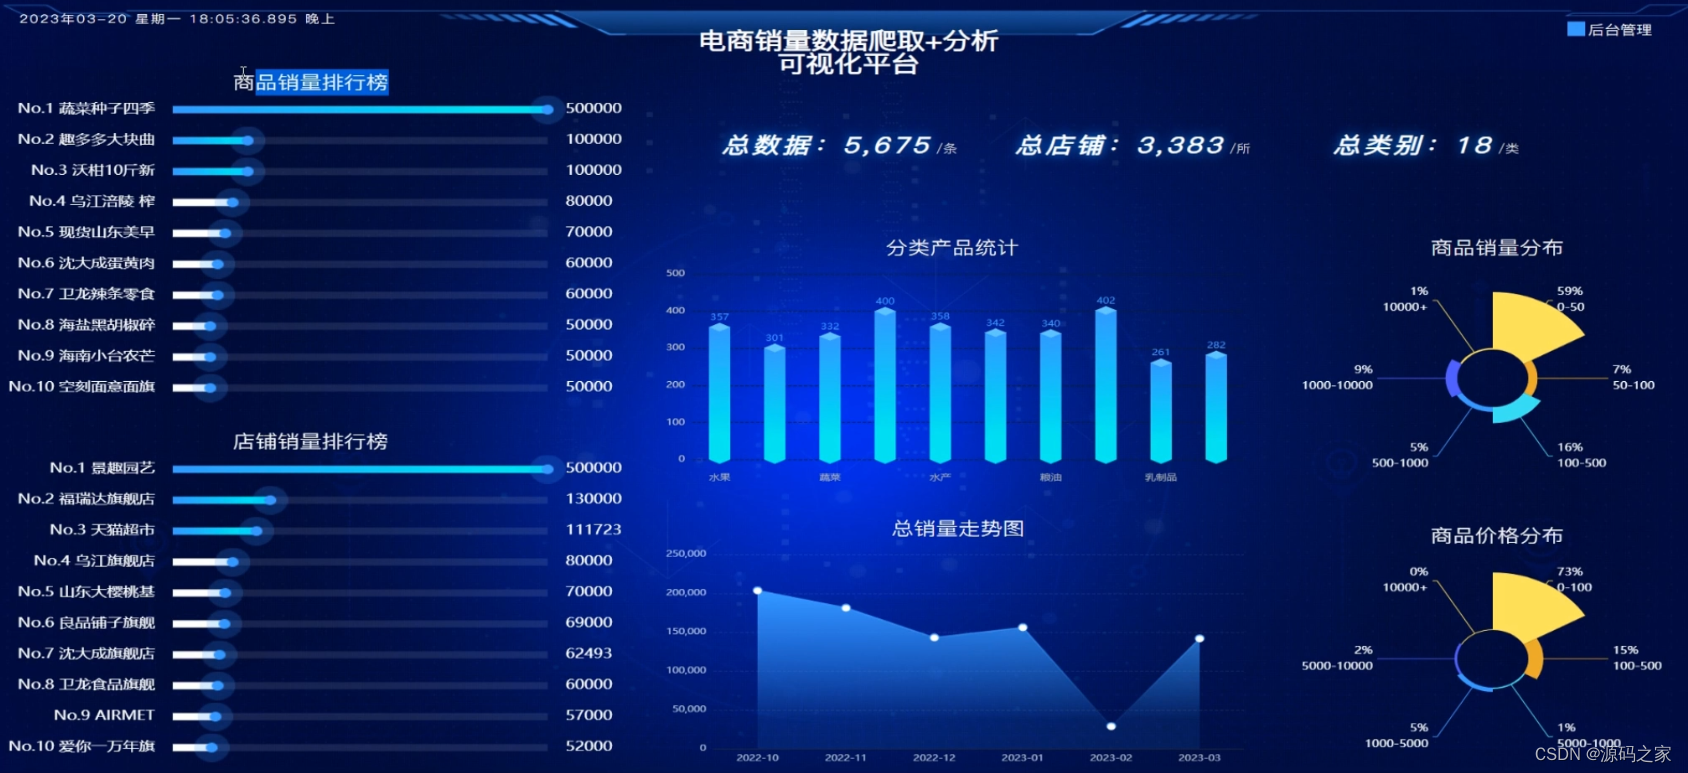
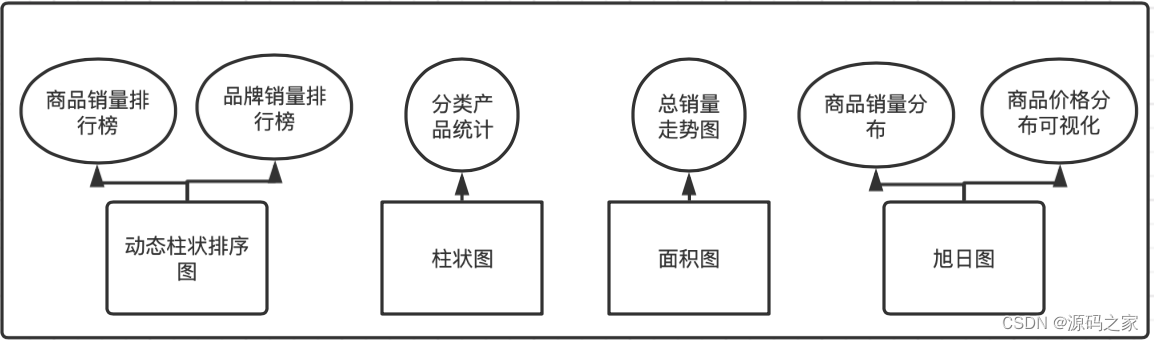
The visualization is divided into historical commodity sales rankings, brand sales rankings, classified product statistics, total sales trend charts, commodity sales distribution, and commodity price distribution visualization. Commodity sales rankings and brand sales rankings crawl Taobao sales and product names, brand sales and brand names. According to the characteristics of the data and the characteristics of the data visualization chart, a dynamic column sorting chart is selected in echarts to see the products more intuitively. Sales data and brand sales data; classified product statistical charts are classified according to the commodity data crawled by Taobao, and the number of product categories is counted, and the histogram is selected according to the characteristics of the number of product categories to display; crawl and monthly sales For statistics, we use the area map to render at this time, and the change of sales can be seen through the change of area; according to the distribution of product sales and commodity price distribution, we use the sun map to render. The visual display page should summarize the data displayed by the community e-commerce data analysis platform, and should include: total number of stores, total data volume, and total categories.
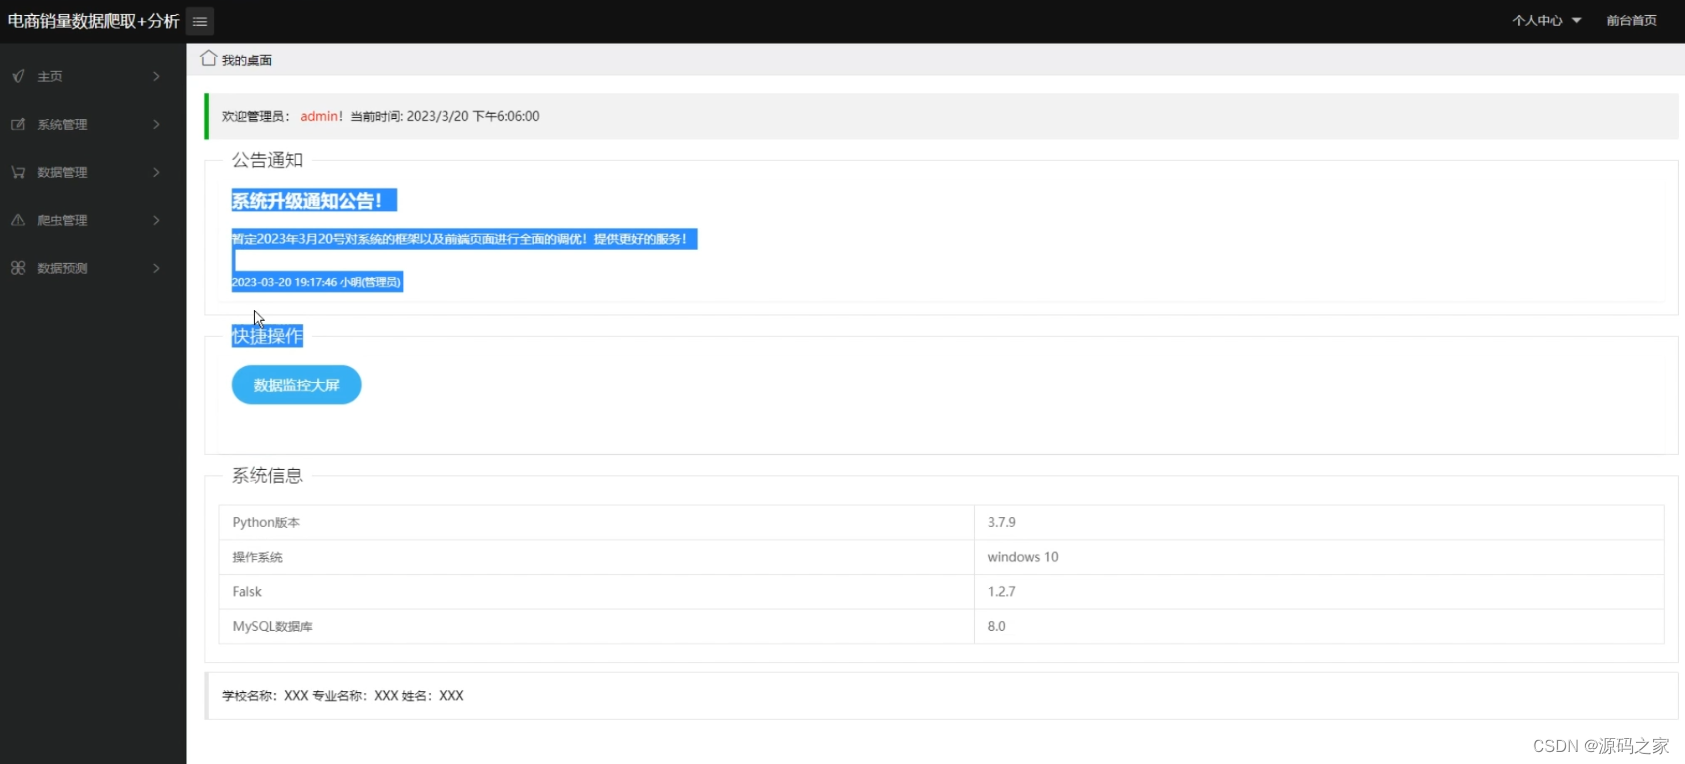
In order to facilitate administrators and users to enter the corresponding background management, a background management button is set to jump. If you have not logged in, you will jump to the login page. If you have already logged in, you will directly jump to the background management page.
Project source code part:

For the large amount of data generated by community e-commerce, the data analysis platform is used to deeply mine the data to find out its value to enterprises and users. Community e-commerce enterprises can use these data and make relevant decisions based on the current epidemic situation and product sales. Decision-making and marketing strategies occupy a favorable position in today's blowout-like influx of community e-commerce platforms.
In the face of complicated commodity data and the unstable economic market of the current epidemic situation, by crawling community e-commerce data, and using a multiple linear regression algorithm that is consistent with the data characteristics to predict sales, and then use simple data visualization to display the community The e-commerce data analysis platform solves the problems of data collection, data storage, data analysis, data visualization and platform management in one stop. Not only community e-commerce, but also other industries such as finance, mining, and media can build similar data analysis platforms to analyze commodity data, give priority to obtaining the added value behind data information, and strengthen corporate competitiveness.
The main work of the paper is as follows:
First, the current situation of the community e-commerce platform is analyzed.
Second, conduct an in-depth analysis of the Hong Kong technology used in this platform, rationally use Flask, Bootstrap, and Lay-UI frameworks, analyze the internal framework and basic principles, and introduce and analyze Ajax, Echarts, Selenium, and machine learning at the same time.
Third, analyzed the system design of the entire platform, focused on the design of the two core sections of the system - data crawling and sales forecasting, and then built the entire system step by step.
Fourth, perform functional and non-functional testing of the platform.
Project source code sharing, mutual learning and mutual progress~