1. The scatter3() method displays
Although the code is simple, but by analogy, the effect is different
x=[4229042.63 4230585.02 4231384.96 4231773.63 4233028.58 4233296.71 4235869.68 4236288.29];
y=[431695.4 441585.8 432745.6 436933.7 428734.4 431946.3 428705.0 432999.5];
z=[1.019 1.023 1.011 1.022 1.020 1.022 1.022 1.023];

scatter3(x,y,z)
Running effect diagram
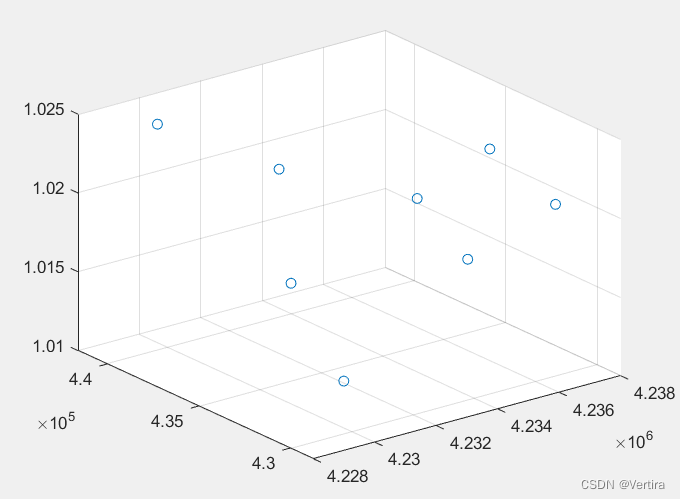
Note: x, y, z must be equal-length pairs (that is, three equal-length vectors)
Two, plot3 method display
clc
clear
close all

x=[4229042.63 4230585.02 4231384.96 4231773.63 4233028.58 4233296.71 4235869.68 4236288.29];
y=[431695.4 441585.8 432745.6 436933.7 428734.4 431946.3 428705.0 432999.5];
z=[1.019 1.023 1.011 1.022 1.020 1.022 1.022 1.023];
plot3(x,y,z,'b.','MarkerSize',5);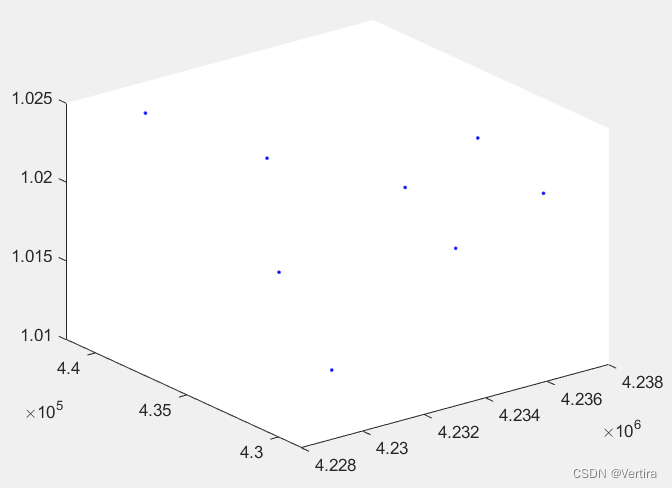
Welcome to like, collect and pay attention
reference link
MATLAB three-dimensional scatter diagram drawing (scatter3, plot3) (bbsmax.com)