Point cloud median, mean, Gaussian filtering
Introduce the filter function
smoothdata: 对含噪数据进行平滑处理
B = smoothdata(___,method) 为上述任一语法指定平滑处理方法。例如,B = smoothdata(A,'sgolay') 使用 Savitzky-golay 滤波器对 A 中的数据进行平滑处理。
Method- smoothing method
"movmean"(默认)|'movmedian'|'gaussian'|'lowess'|'loess'|'rlowess'|'rloess'|'sgolay'
- 'movmean' - Moving average within each window of A, useful for reducing periodic trends in data.
- 'movmedian' - Moving median for each window of A. This method is useful for reducing periodic regions in the data when outliers are present.
- 'gaussian' — Gaussian-weighted moving average within each window of A
- 'lowess' - Linear regression within each window of A. This method can be computationally expensive but reduces discontinuities
- 'loess' - Quadratic regression within each window of A. This method is slightly more computationally expensive than 'lowess'.
- 'rlowess' — Robust linear regression within each window of A. This method is more computationally expensive than lowess' method, but it is more robust to outliers
- 'rloess' - Robust quadratic regression within each window of A. This method is more computationally expensive than the loess method, but it is more robust to outliers
- 'sgolay' — Savitzky-Golay filter that performs smoothing based on a quadratic polynomial fitted over each window of A. This method may be more efficient than other methods when the data changes rapidly.
clc;clear all;close all;
%点云按高程进行赋色
%首先按照Z轴方向求取所在点云的高程极值(包括高程最大值与最小值),然后将高程归一化到0~255范围内,最后采用matlab中的colormap颜色染函数进行赋色并保存渲染结果到点云。
%读取点云
filename='E:\程序库\点云\规则点云\bunny.pcd';
ptCloud=pcread(filename);
x=ptCloud.Location(:,1);
y=ptCloud.Location(:,2)
z=ptCloud.Location(:,3)
zMIN=ptCloud.ZLimits(2)
zMAX=ptCloud.ZLimits(1)
color=hsv(256);
%hsv:以三列数组形式返回 hsv 颜色图,其中包含的行数与当前图窗的颜色图相同。如果不存在图窗,则行数等于默认长度 256。数组中的每一行包含一种特定颜色的红、绿、蓝强度。强度介于 [0,1] 范围内。
pccolor=zeros(length(z),3);%返回当前点云的颜色图
for i =1:length(z)
index=floor(255*(z(i)-zMIN)/(zMAX-zMIN))+1;%将高程归一化到[0,255]
pccolor(i,:)=color(index,:);%将高度为index的对应的hsv颜色图赋值给点云的颜色图。
end
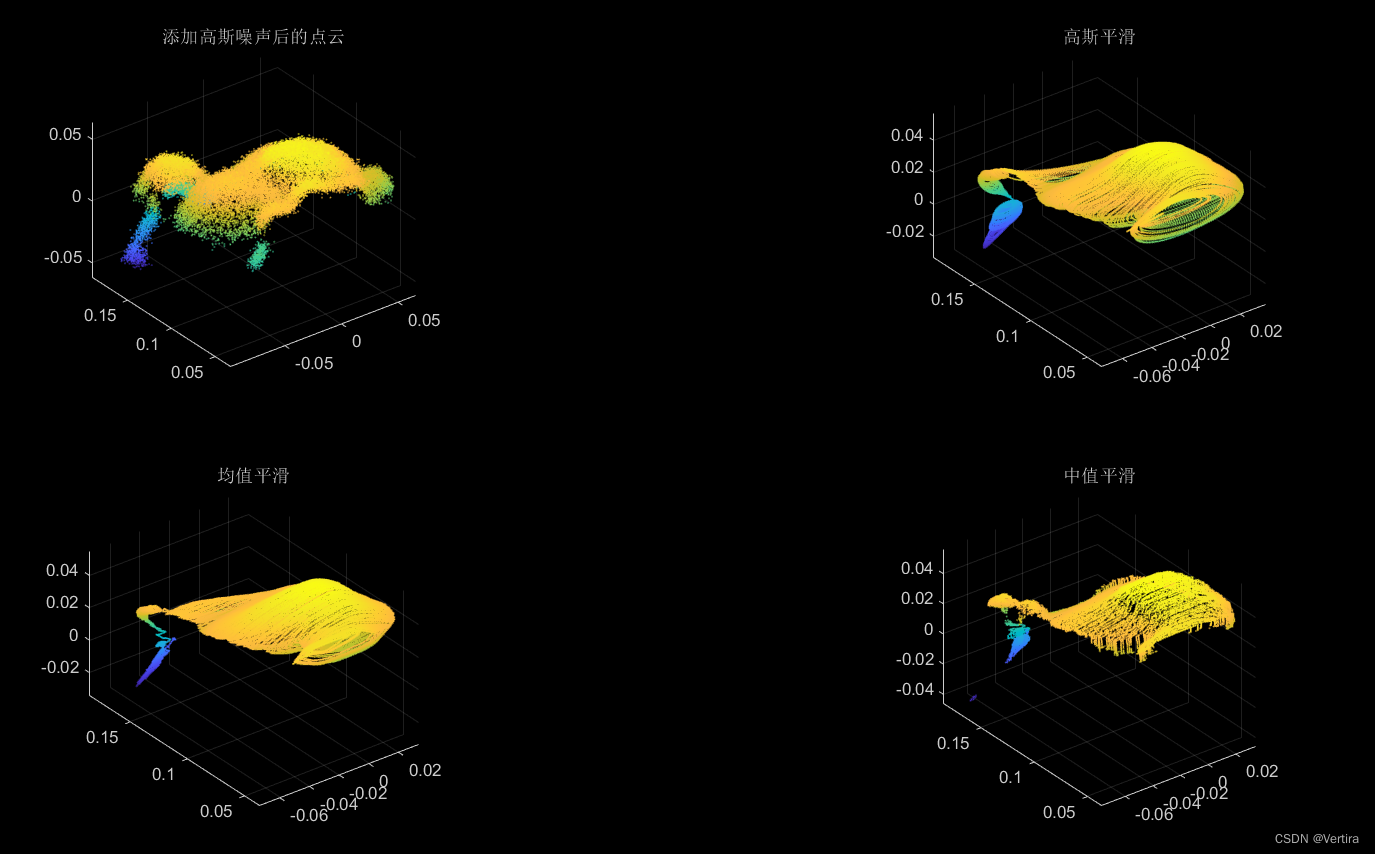
%添加高斯噪声,均值为0,标准差为0.002
noise=normrnd(0,0.002,size(ptCloud.Location));
addgaussian=ptCloud.Location+noise;
%高斯平滑
pt_gaussiansmooth=smoothdata(addgaussian,'gaussian');
%均值平滑
pt_movmeansmooth=smoothdata(addgaussian,'movmean');
%中值平滑
pt_movmediansmooth=smoothdata(addgaussian,'movmedian');
%可视化原始点云
figure;subplot(221);pcshow(filename);title('原始点云');
%可视化高程赋色后的点云
ptColor2 = pointCloud(ptCloud.Location,"Color",pccolor);
subplot(222);pcshow(ptColor2);title('高程赋色后的点云');
colorbar;%显示颜色带
%可视化添加高斯噪声后的点云
subplot(2,2,[3,4]);pcshow(addgaussian);title('添加高斯噪声后的点云')
figure;subplot(221);pcshow(addgaussian);title('添加高斯噪声后的点云')
subplot(222);pcshow(pt_gaussiansmooth);title('高斯平滑');
subplot(223);pcshow(pt_movmeansmooth);title('均值平滑');
subplot(224);pcshow(pt_movmediansmooth);title('中值平滑');