This article mainly introduces the application of numpy in digital image processing, including: matrix creation, matrix conversion, basic operations, matrix operations, element acquisition, reading and displaying images, simple drawing,
Article directory
three important properties
A.dtype, A.shape, A.ndim
First write a function to read a gray or color image
def show(img):
    if img.ndim == 2:
        plt.imshow(img, cmap='gray')
    else:
        plt.imshow(cv.cvtColor(img,cv.COLOR_RGB2BGR)) #通道转换
    plt.plot()
apple = cv.imread('./pic/apple.jpg')
show(apple)
![[External link picture transfer failed, the source site may have an anti-leeching mechanism, it is recommended to save the picture and upload it directly (img-Y20Yri5W-1661935440262)(output_60_0.png)]](https://img-blog.csdnimg.cn/c8f31a83618349b88bd6016583c4b185.png)
apple = cv.imread('./pic/apple.jpg',0) #0表示读成灰度图
show(apple)
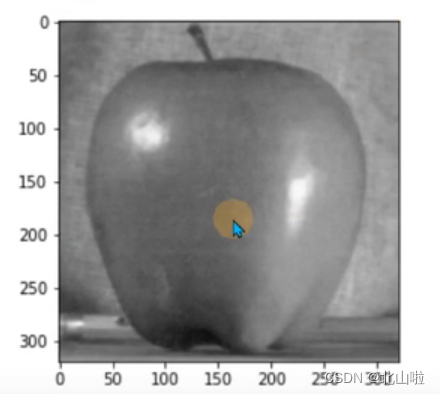
create matrix
np.array([[1]])
np.uint8([1])
np.arange(2,10,2)
np.linspace(0, 2*pi, 100)
A = np.zeros((4,3), dtype=np.uint8)
B = np.ones((2,2), dtype=np.float32)
I = np.eye(4)
I2 = np.identity(6)
C = np.random.randint(0, 10, (4,4))
matrix transformation
A.reshape()
A.flatten(), A.ravel()
A.T
A.transpose()
np.hstack([A, B])
Maximum, minimum, average
A.max()
A.min()
A.mean()
np.max()
np.min()
np.mean()
computation
np.power(A, 2)
np.sqrt()
np.log(), np.log2(), np.log10()
A.dot(x)
Image reading and display
cv.imread(path)   #读取图片
cv.imwrite(path, img)  #显示在硬盘上

# cv.namedWindow('image')  显示图片
cv.imshow("roi", img)
cv.waitKey(0)
cv.destroyAllWindows()

plt.imshow(img)
plt.show()
simple drawing
plt.plot(x,y)
plt.hist(array)
import numpy as np
Three properties that are important in matrices
A = np.random.randint(0,9,(3,3))
print('A.dtype =', A.dtype)
print('A.ndim =', A.shape)
print('A.ndim =', A.ndim)

A1 = A.reshape((1,9))
print(A1) # 有几个方括号,就有几个维度

A1 = A1.astype(np.float32)
A.dtype = int32
A.ndim = (3, 3)
A.ndim = 2
[[2 2 0 7 8 1 5 7 4]]
matrix creation
np.array([[1]])
np.uint8([1])
np.arange(2,10,2)
np.linspace(0, 2*pi, 100)
np.zeros((4,3), dtype=np.uint8)
np.ones((2,2), dtype=np.float32)
np.eye(4)
np.identity(6)
np.random.randint(0, 10, (4,4))
Let's use these simple and practical functions
x = np.array([1,2,3],dtype=float)  # dtype:指点数据类型
print(x)
print(x.dtype)
[1. 2. 3.]
float64
y = np.uint8([1,1,1])
print(y)
print(y.dtype)
[1 1 1]
uint8
np.arange(2,10,2) #step表示步长,且可为小数
array([2, 4, 6, 8])
np.linspace(0,10,11) #num表示创建的个数
array([ 0., 1., 2., 3., 4., 5., 6., 7., 8., 9., 10.])
Create a matrix of all 0s
np.zeros((2,3),dtype = int)
array([[0, 0, 0],
       [0, 0, 0]])
Create a matrix of all 1s
np.ones((3,3),dtype=np.float32)
array([[1., 1., 1.],
       [1., 1., 1.],
       [1., 1., 1.]], dtype=float32)
Create the identity matrix
np.identity(4)
array([[1., 0., 0., 0.],
       [0., 1., 0., 0.],
       [0., 0., 1., 0.],
       [0., 0., 0., 1.]])
Create random numbers
np.random.randint(0,256,(10,10),dtype=np.uint8) # uint8是指无符号整型,uint8类型取值范围:0到255
array([[ 38, 240, 221, 175, 205,  32, 142, 207, 183, 215],
       [ 23, 200, 108, 171, 101, 213, 182, 141, 220, 144],
       [103, 112, 187,  29,  20, 107, 173, 236, 192, 160],
       [ 76, 196,  71,   3, 217, 169,   7, 127,  74, 223],
       [ 15,  75, 177, 181, 175,  17, 148,  82,  48, 246],
       [228,  41, 161, 228,   5, 154, 205,   0, 103,   5],
       [240, 227, 231, 217, 213, 218,  28,   0,  90, 156],
       [118, 140,  93, 107,  43,  90,  54,  78, 233, 233],
       [ 92,  16, 111, 253, 137,  87,  55, 166,  72,  63],
       [127,  95, 148,   7,  70,  56,  91,  26, 184, 112]], dtype=uint8)
matrix transformation
A.reshape()

A.flatten(), A.ravel()

A.T

A.transpose()

np.hstack([A, B])
# 创建一个全是1的矩阵
A = np.ones((3,3),dtype=np.uint8)
print(A)
[[1 1 1]
 [1 1 1]
 [1 1 1]]
The reshape function is a very commonly used function in numpy, which modifies the shape of the matrix without changing the value of the matrix
print(A.reshape((1,9)))
print(A.reshape((-1,9)))
[[1 1 1 1 1 1 1 1 1]]
[[1 1 1 1 1 1 1 1 1]]
AT or A.transpose() will this matrix device
B = np.random.randint(0,10,(3,3))
print(B)
print(B.T)
print(B.transpose())
[[4 8 5]
 [0 5 9]
 [3 1 1]]
[[4 0 3]
 [8 5 1]
 [5 9 1]]
[[4 0 3]
 [8 5 1]
 [5 9 1]]
Hstack () is horizontal stretching, derived from horizontal, the word horizontal vstack () is vertical arrangement, derived from vertical vertical
print(np.hstack([A,B]))
[[1 1 1 4 8 5]
 [1 1 1 0 5 9]
 [1 1 1 3 1 1]]
print(np.vstack([A,B]))
[[1 1 1]
 [1 1 1]
 [1 1 1]
 [4 8 5]
 [0 5 9]
 [3 1 1]]
basic operation
# 加减乘除
B = A + 2
C = A / 2

print(A)
print(B)
print(C)
[[1 1 1]
 [1 1 1]
 [1 1 1]]
[[3 3 3]
 [3 3 3]
 [3 3 3]]
[[0.5 0.5 0.5]
 [0.5 0.5 0.5]
 [0.5 0.5 0.5]]
# 平方、开根、对数
B = np.power(A, 0.5)
C = np.sqrt(A)
D = np.log(A)

print(B)
print(C)
print(D)
[[1. 1. 1.]
 [1. 1. 1.]
 [1. 1. 1.]]
[[1. 1. 1.]
 [1. 1. 1.]
 [1. 1. 1.]]
[[0. 0. 0.]
 [0. 0. 0.]
 [0. 0. 0.]]
The focus of axis is direction, not rows and columns. 1 means the horizontal axis, the direction is from left to right; 0 means the vertical axis, the direction is from top to bottom.
# 最大值max、最小值min、平均值mean
ma1 = A.max()
ma2 = np.max(A)

mi1 = A.min(axis=0)
mi2 = np.min(A, axis=0)

me1 = A.mean(axis=1)
me2 = np.mean(A, axis=1)
# 转置
print(A)
print(A.T)
print(A.transpose())
print(np.transpose)
[[1 1 1]
 [1 1 1]
 [1 1 1]]
[[1 1 1]
 [1 1 1]
 [1 1 1]]
[[1 1 1]
 [1 1 1]
 [1 1 1]]
<function transpose at 0x00000193DA314940>
Matrix Operations
x = np.array([1, 1, 2])

z1 = A * x
z2 = A @ x #矩阵乘法
z3 = A.dot(x) #矩阵乘法

print(z1)
print(z2)
print(z3)
[[1 1 2]
 [1 1 2]
 [1 1 2]]
[4 4 4]
[4 4 4]
B = np.ones((3,3), dtype=int)

Z1 = A * B # 逐元素相乘
Z2 = A @ B # 矩阵乘法
Z3 = A.dot(B)

print(Z1)
print(Z2)
print(Z3)
[[1 1 1]
 [1 1 1]
 [1 1 1]]
[[3 3 3]
 [3 3 3]
 [3 3 3]]
[[3 3 3]
 [3 3 3]
 [3 3 3]]
## 补充:矩阵乘法计算技巧
element acquisition
u = np.arange(2, 10, 2)
print(u)
print(u[0], u[1:4])
[2 4 6 8]
2 [4 6 8]
# 获取行
print(A)
print(A[0])
print(A[0, :])
[[1 1 1]
 [1 1 1]
 [1 1 1]]
[1 1 1]
[1 1 1]
# 获取列
print(A[:, 0])
[1 1 1]
E = np.random.randint(0, 10, (5,5), dtype=int)
E
array([[5, 4, 9, 1, 7],
       [9, 8, 6, 2, 1],
       [1, 5, 2, 1, 1],
       [5, 4, 6, 0, 4],
       [4, 1, 4, 2, 5]])
# 获取子矩阵
E1 = E[0:3, 0:3].copy()
print(E1)
[[5 4 9]
 [9 8 6]
 [1 5 2]]
# 获取元素
e1 = E[0][0]
e2 = E[0, 0] #推荐
print(e1, e2)
5 5
# 元素赋值
E1[0,0] = 0
print(E1)
[[0 4 9]
 [9 8 6]
 [1 5 2]]
E1[0,:] = np.array([1,1,1])
print(E1)
[[1 1 1]
 [9 8 6]
 [1 5 2]]
E1 > 2
array([[False, False, False],
       [ True,  True,  True],
       [False,  True, False]])
E1.flatten()
array([1, 1, 1, 9, 8, 6, 1, 5, 2])
read display image
import cv2 as cv
import matplotlib.pyplot as plt
import numpy as np
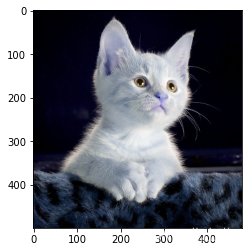
img1 = cv.imread('./pic/cat500x480.jpg')
#print(img1)
cv.imshow("bear", img1)  #'bear'为窗口名字
cv.waitKey(0)  #等待按键响应
cv.destroyAllWindows()
# img1 = cv.cvtColor(img1, cv.COLOR_BGR2RGB) #通道转换
plt.imshow(img1)
plt.show()
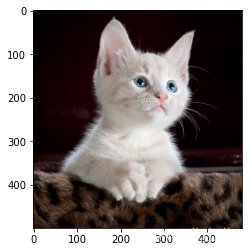
img1 = cv.cvtColor(img1, cv.COLOR_BGR2RGB) #通道转换
plt.imshow(img1)
plt.show()
cv.imread() reads the grayscale image
img2 = cv.imread('./pic/cat500x480.jpg', 0)
plt.imshow(img2) #灰度图会以热力图的方式显示
plt.show()
![[External link picture transfer failed, the source site may have an anti-leeching mechanism, it is recommended to save the picture and upload it directly (img-TuoXKb3b-1661935440260)(output_56_0.png)]](https://img-blog.csdnimg.cn/756fab0bc7054f6eb358dc128fc36f19.png)
img2 = cv.imread('./pic/cat500x480.jpg', 0)
plt.imshow(img2,cmap='gray')
plt.show()
![[External link picture transfer failed, the source site may have an anti-leeching mechanism, it is recommended to save the picture and upload it directly (img-ADRu2mkM-1661935440261)(output_57_0.png)]](https://img-blog.csdnimg.cn/26ab6a47cfe445caaa0d3e672db5049c.png)
print(img1.ndim, img2.ndim)
3 2
We use the constructor show()to judge whether it is a gray image or a color image by judging the dimension of the image, and then output
def show(img):
    if img.ndim == 2:
        plt.imshow(img, cmap='gray')
    else:
        plt.imshow(cv.cvtColor(img,cv.COLOR_RGB2BGR)) #通道转换
    plt.plot()
apple = cv.imread('./pic/apple.jpg')
show(apple)
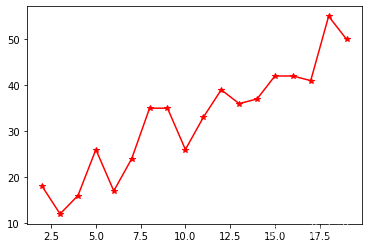
simple drawing
Simple and practical matplotlib to draw mathematical graphics
import numpy as np
import matplotlib.pyplot as plt
x = np.arange(2,20)
y = 2 * x + np.random.randint(5,20,18)
plt.plot(x,y,'*-',color='r')
plt.show()
x = np.linspace(0,1,100)
y1 = np.power(x,0.5)
y2 = x
y3 = np.power(x,1.5)
plt.plot(x,y1,label='0.5')
plt.plot(x,y2,label='1.0')
plt.plot(x,y3,label='1.5')
plt.legend() #显示图例
plt.xlabel('r')
plt.ylabel('s')
plt.grid() #显示网格
plt.xlim([0,1])
plt.ylim([0,1])
plt.show()

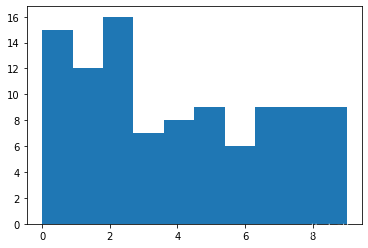
a = np.random.randint(0, 10, 100)
print(a)
[5 7 9 5 1 6 4 0 4 5 0 8 2 0 2 4 8 2 2 2 0 0 2 8 9 7 7 9 0 1 3 8 1 2 2 0 3
 8 2 7 5 9 1 5 4 1 2 8 6 0 7 4 3 1 7 8 6 0 1 4 0 4 6 2 3 0 6 7 9 3 3 9 2 5
 7 8 1 5 9 1 8 1 0 2 5 5 7 1 9 3 2 1 9 2 0 4 6 0 0 2]
plt.hist(a, bins=10)
plt.show()
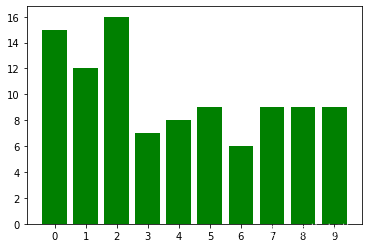
bins = np.arange(-0.5, 10, 1)
plt.hist(a, bins=bins, rwidth=0.8, color='green')
plt.xticks(range(0,10))
plt.show()
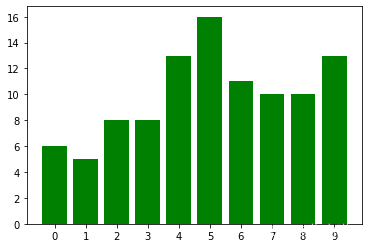
A1 = np.random.randint(0, 10, (10,10))
print(A1)
[[5 8 1 9 0 8 6 9 4 5]
 [4 0 5 5 5 9 6 5 4 9]
 [4 9 4 6 7 8 4 7 2 0]
 [4 0 9 7 5 3 5 5 8 9]
 [6 2 5 4 6 4 8 7 1 2]
 [7 2 0 9 7 2 4 3 5 7]
 [6 5 3 1 3 8 4 6 7 5]
 [3 9 8 2 6 9 8 9 2 4]
 [3 5 7 3 0 4 8 5 9 9]
 [6 1 6 5 7 6 3 2 8 1]]
bins = np.arange(-0.5, 10, 1)
plt.hist(A1.flatten(), bins=bins, rwidth=0.8, color='green')
plt.xticks(range(0,10))
plt.show()
np.arange(-0.5, 10, 1)
array([-0.5, 0.5, 1.5, 2.5, 3.5, 4.5, 5.5, 6.5, 7.5, 8.5, 9.5])