foreword
In front-end development, map display is one of the common requirements. As a well-known map service provider in China, Gaode Map provides rich API functions and is relatively simple to use.
This article will introduce how to use @amap/amap-jsapi-loader in Vue2 to install Amap and display the map.
Preparation
-
First, you need to register an account on the AutoNavi open platform, and create an application to obtain the corresponding application key.
-
Install @amap/amap-jsapi-loader.
npm install @amap/amap-jsapi-loaderuse
// 初始化高德地图
mounted() {
AMapLoader.load({
key: "你的应用 key",
version: "2.0",
plugins: ["AMap.Scale", "AMap.OverView", "AMap.ToolBar", "AMap.MapType"],
Loca: {
version: "2.0",
},
}).then((AMap) => {
this.initMap(AMap);
});
},
methods: {
initMap(AMap) {
this.map = new AMap.Map("mapContainer", {
viewMode: "3D", //开启3D视图,默认为关闭
mapStyle: "amap://styles/darkblue",//主题样式
zoom: 10,
center: [116.397428, 39.90923],
});
},
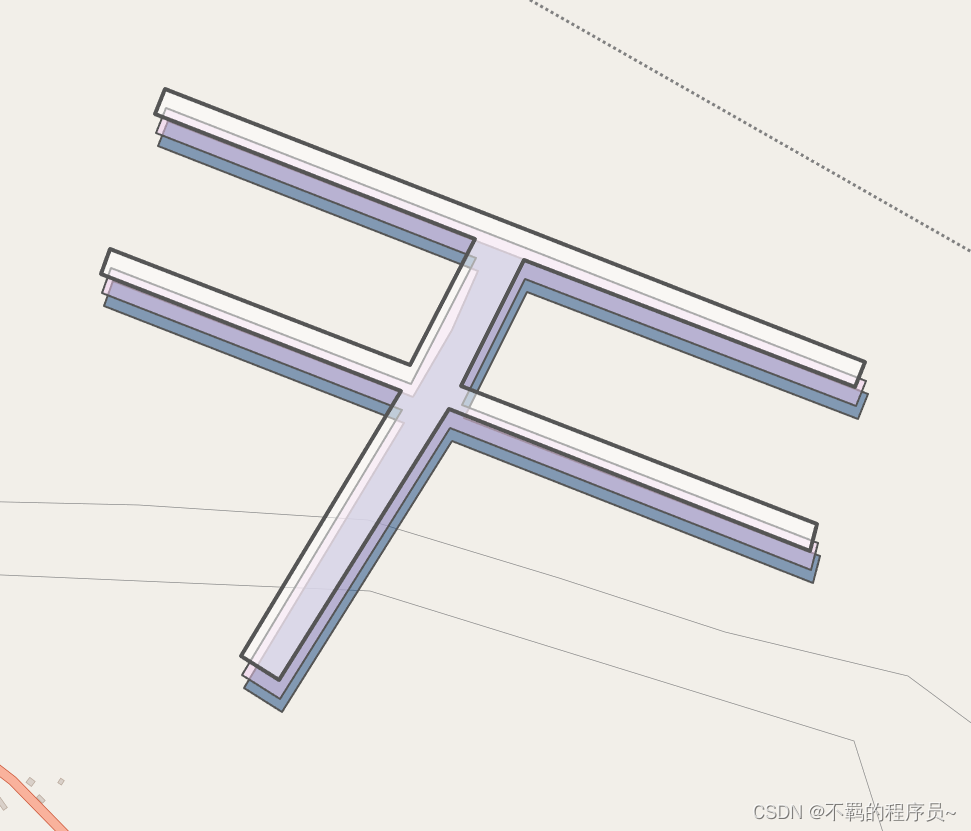
},2D polygon stereo effect
A tool GeoJSON is introduced here .
1. Select the feature type (point, line, surface, etc.) on the map, and use the mouse to draw the shape of the feature on the map.
2. In the right panel, you can see the generated GeoJSON data, including feature type, coordinate information and attribute information.
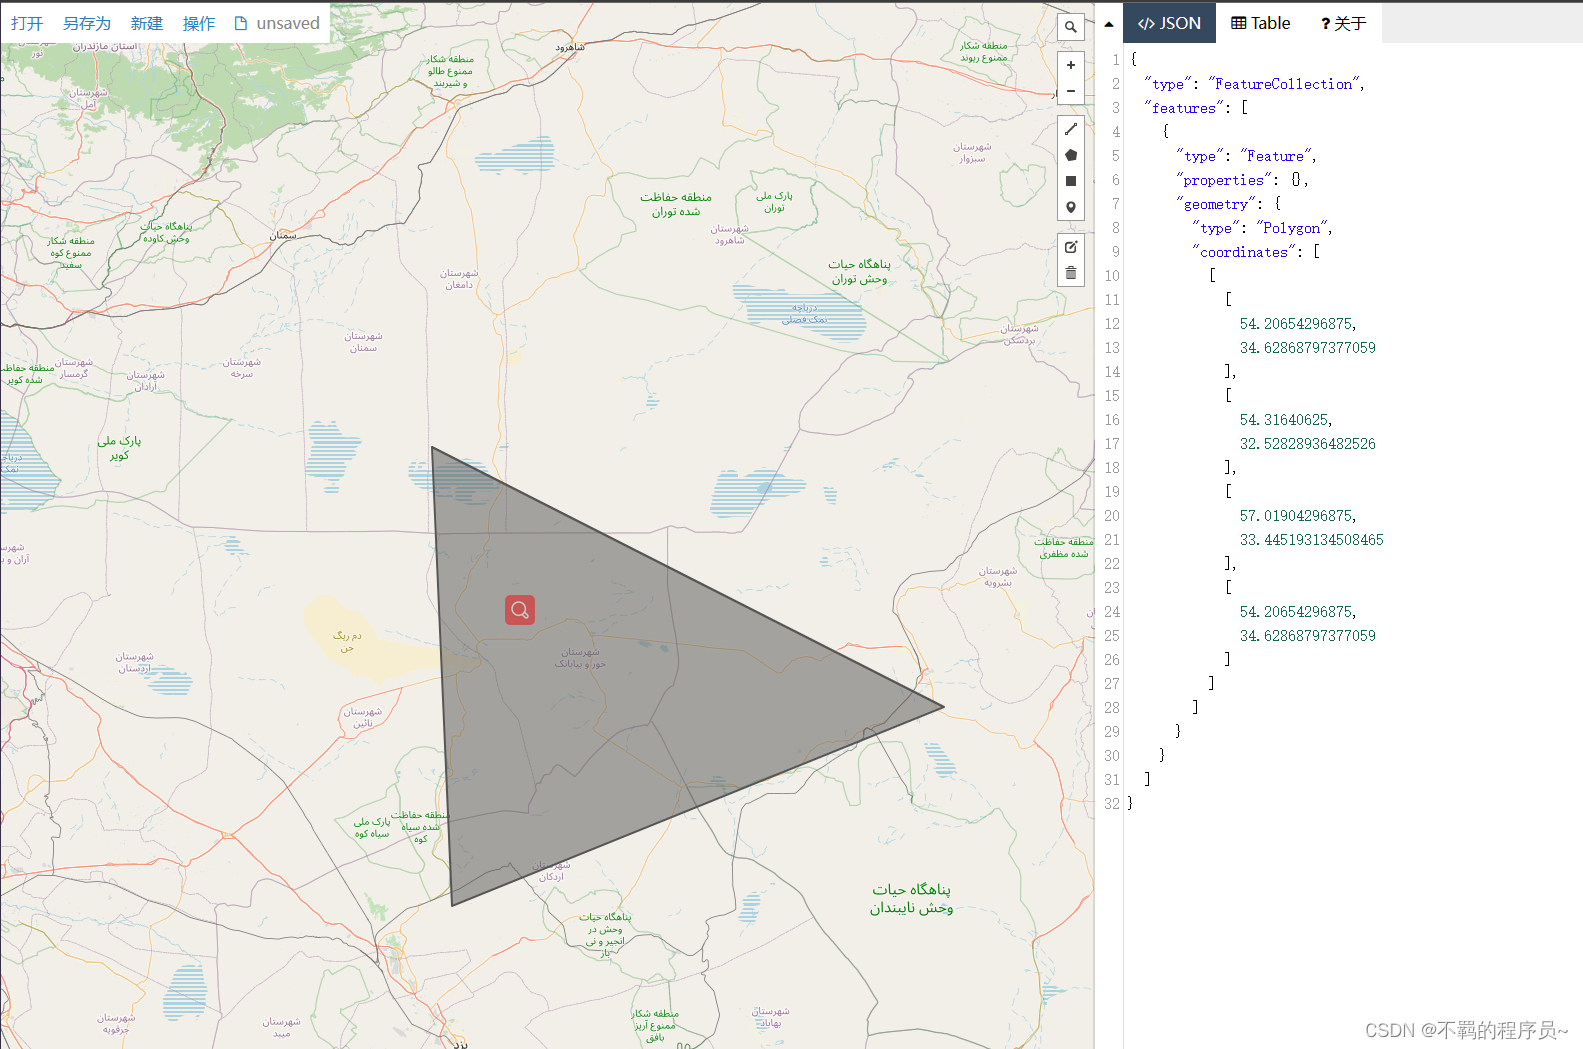
For example, such a graph
After we draw and get his points, we draw them in the code
const pathPos = [
  {
    point: [
      [95.50358686014329, 29.919373253410868],
      [95.50256641846386, 29.91972649467766],
      [95.50053154990024, 29.920407889723833],
      [95.49566282916277, 29.922062194380487],
      [95.4954304901953, 29.921596007328503],
      [95.50230405502856, 29.91927886419461],
      [95.50174713134766, 29.918172713504486],
      [95.5009011032626, 29.91692351110885],
      [95.49447942199674, 29.91908778583877],
      [95.4942831669282, 29.91861842590066],
      [95.50071476626823, 29.916446908047305],
      [95.49728739203402, 29.911522353660644],
      [95.49810791015625, 29.91107177734375],
      [95.50173653782093, 29.916105035072235],
      [95.50948951439364, 29.913471468464593],
      [95.5096392976834, 29.913965572980317],
      [95.50200937406373, 29.91652722100838],
      [95.50334996945577, 29.918886668898267],
      [95.51045504489969, 29.91652391201069],
      [95.51067844600743, 29.91698476840213],
      [95.50358686014329, 29.919373253410868],
    ],
  },
  {
    point: [
      [95.50354394479908, 29.91961502670651],
      [95.50252350311965, 29.919968267115472],
      [95.50048863455604, 29.920649660506953],
      [95.49561991381856, 29.922303961146138],
      [95.4953875748511, 29.921837775226294],
      [95.50226113968435, 29.91952063771944],
      [95.5008581879184, 29.917165290353125],
      [95.49443650665253, 29.919329559827638],
      [95.49424025158399, 29.918860201029265],
      [95.50067185092402, 29.91668868844885],
      [95.49724447668981, 29.911764146018857],
      [95.49806499481204, 29.911313570795876],
      [95.50169362247674, 29.91634681630389],
      [95.50944659904944, 29.913713256090627],
      [95.5095963823392, 29.91420735940669],
      [95.50196645871952, 29.916769001214917],
      [95.50330705411157, 29.919128443375513],
      [95.51041212955549, 29.916765692225262],
      [95.51063553066322, 29.91722654749765],
      [95.50354394479908, 29.91961502670651],
    ],
  },
  {
    point: [
      [95.50352248712694, 29.919968386620923],
      [95.50250204544751, 29.92032162577616],
      [95.50046717688392, 29.921003016749225],
      [95.49559845614642, 29.922657311516648],
      [95.49536611717896, 29.92219112725151],
      [95.50223968201222, 29.919873997968878],
      [95.50083673024626, 29.917518658961775],
      [95.4944150489804, 29.919682920755196],
      [95.49421879391186, 29.919213563622648],
      [95.50065039325189, 29.917042058748894],
      [95.49722301901768, 29.912117533794117],
      [95.49804353713992, 29.91166696016994],
      [95.50167216480462, 29.9167001878172],
      [95.5094251413773, 29.914066636949627],
      [95.50957492466708, 29.914560738512343],
      [95.50194500104739, 29.917122371229958],
      [95.50328559643944, 29.919481805016893],
      [95.51039067188336, 29.91711906225206],
      [95.51061407299109, 29.917579915888904],
      [95.50352248712694, 29.919968386620923],
    ],
  },
];
Draw polygons by traversing pathPos
      pathPos.forEach((item, index) => {
        const polygon = new this.AMapObj.Polygon({
        path: item.point,
        fillColor: "#12447d", // 多边形填充颜色
        strokeWeight: 2, // 线条宽度,默认为 1
        strokeColor: "#027aff", // 线条颜色
        fillOpacity: 0.5, // 透明度
        strokeStyle: "dashed", //虚线
        strokeDasharray: [10, 10],
      });
      this.baseMapShp.push(polygon);
      });
this.map.add(this.baseMapShp); 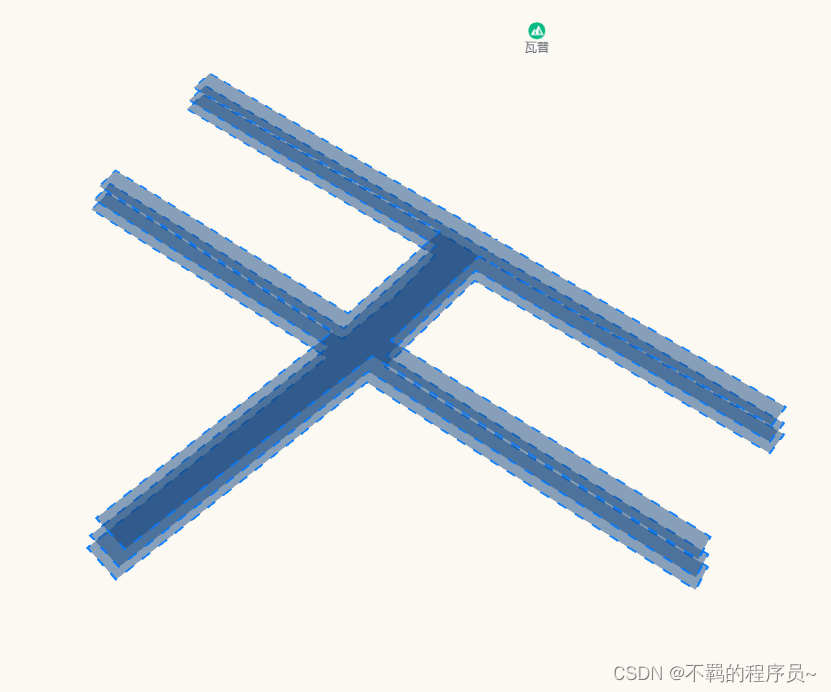
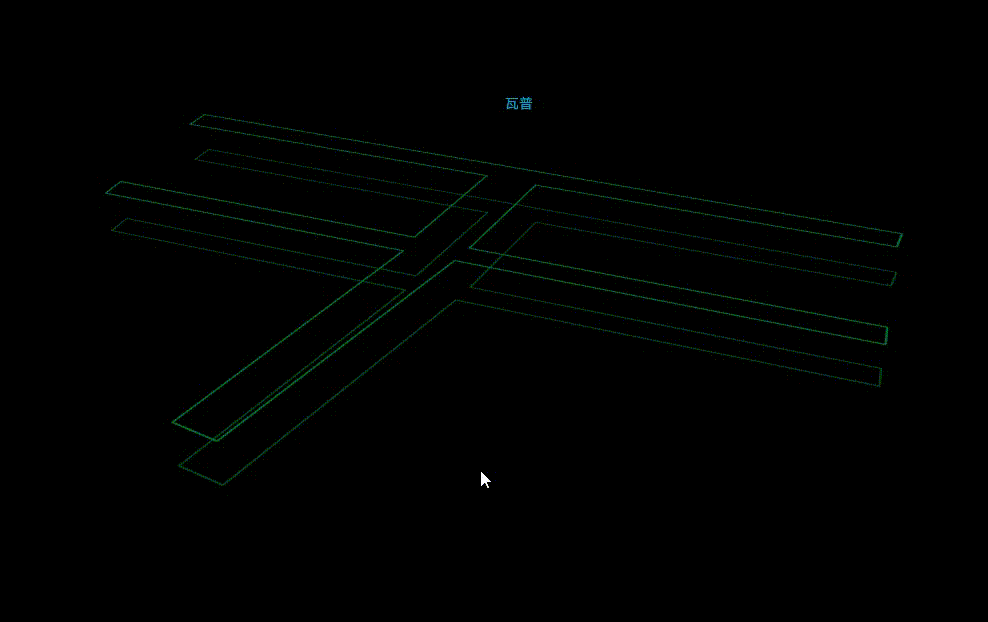
3D polygon stereo effect
Beijing bus line-line layer-example details-Loca API 2.0 | Amap API (amap.com)
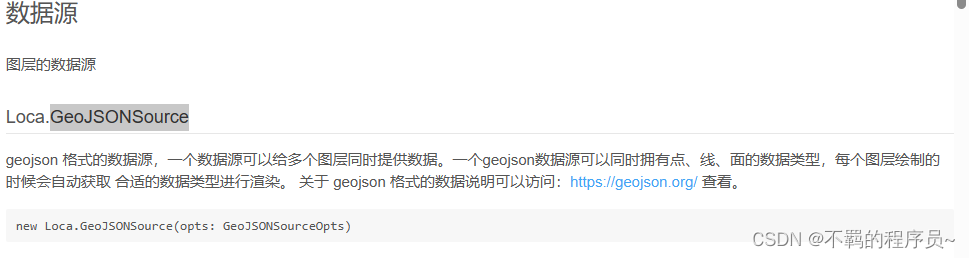
Use the Loca API
 const json={
  type: "FeatureCollection",
  features: [
    {
      type: "Feature",
      properties: {
        type: 1,
        h: 1,
      },
      geometry: {
        type: "LineString",
        coordinates: [
          [95.503586860143287, 29.919373253410868],
          [95.502566418463857, 29.919726494677661],
          [95.500531549900245, 29.920407889723833],
          [95.495662829162768, 29.922062194380487],
          [95.495430490195304, 29.921596007328503],
          [95.50230405502856, 29.919278864194609],
          [95.500901103262606, 29.916923511108848],
          [95.494479421996743, 29.919087785838769],
          [95.494283166928199, 29.918618425900661],
          [95.500714766268231, 29.916446908047305],
          [95.497287392034025, 29.911522353660644],
          [95.49810791015625, 29.91107177734375],
          [95.501736537820932, 29.916105035072235],
          [95.509489514393636, 29.913471468464593],
          [95.509639297683407, 29.913965572980317],
          [95.502009374063732, 29.91652722100838],
          [95.503349969455769, 29.918886668898267],
          [95.510455044899686, 29.916523912010689],
          [95.510678446007432, 29.916984768402131],
          [95.503586860143287, 29.919373253410868],
        ],
      },
    },
    {
      type: "Feature",
      properties: {
        type: 2,
        h: 2,
      },
      geometry: {
        type: "LineString",
        coordinates: [
          [95.503586860143287, 29.919373253410868],
          [95.502566418463857, 29.919726494677661],
          [95.500531549900245, 29.920407889723833],
          [95.495662829162768, 29.922062194380487],
          [95.495430490195304, 29.921596007328503],
          [95.50230405502856, 29.919278864194609],
          [95.500901103262606, 29.916923511108848],
          [95.494479421996743, 29.919087785838769],
          [95.494283166928199, 29.918618425900661],
          [95.500714766268231, 29.916446908047305],
          [95.497287392034025, 29.911522353660644],
          [95.49810791015625, 29.91107177734375],
          [95.501736537820932, 29.916105035072235],
          [95.509489514393636, 29.913471468464593],
          [95.509639297683407, 29.913965572980317],
          [95.502009374063732, 29.91652722100838],
          [95.503349969455769, 29.918886668898267],
          [95.510455044899686, 29.916523912010689],
          [95.510678446007432, 29.916984768402131],
          [95.503586860143287, 29.919373253410868],
        ],
      },
    },
  ],
};
let geo = new Loca.GeoJSONSource({
data: json,
});
let ll = new Loca.LineLayer({
loca,
});
let colors = ['#f7fcf5', '#e5f5e0'];
ll.setSource(geo, {
color: function (index, feature) {
var i = index % colors.length;
return colors[i];
},
lineWidth: (index, feature) => {
return 2;
},
altitude: function (index, feature) {
return 100 * index;
},
dash: function (index, feature) {
return [10];
},
});
Summarize
Use @amap/amap-jsapi-loader to easily use Gaode map in Vue2, and you can also add corresponding plug-ins according to your needs. I hope this article can help you quickly get started with Gaode Map.