
We've covered quite a few command-line monitoring tools in Linux in the past. These include vmstat, htop, top, etc. Among them, top is the most widely used command because it is pre-installed and provides real-time performance of the system in addition to displaying running processes. In this guide, we will focus more on glances, an intuitive and user-friendly command-line tool.
Based on Python, Glances is an open source free cross-platform command-line monitoring tool that provides a wealth of information about system performance. You can monitor system metrics such as memory and CPU utilization, network bandwidth, disk I/O, file system and running processes, and more.
Glances displays metrics in an intuitive and visually appealing format, including the following:
- System uptime & IP address ( Private & public )
- Memory utilization ( Main memory , swap , available memory ).
- CPU utilization.
- Disk mount points.
- Disk I/O & read and write speeds.
- CPU load average , date and time
- Running processes including active and sleeping processes.
- Network bandwidth ( Including upload and download rates ).
How to Install Glances on Linux Distributions
Glances is not installed by default. Let's see how to install Glances on major Linux distributions.
On Ubuntu / Debian / Mint
$ sudo apt install -y glances
For older versions, add the PPA
$ sudo apt-add-repository ppa:arnaud-hartmann/glances-stable
Next, update the package list and install glance as shown
$ sudo apt update
$ sudo apt install -y glances
On CentOS 8 / RHEL 8
For CentOS & RHEL, please install the EPEL package first
CentOS 8
$ sudo dnf install epel-release
RHEL 8
$ sudo dnf install https://dl.fedoraproject.org/pub/epel/epel-release-latest-8.noarch.rpm
Then update the repository and install
$ sudo dnf update
$ sudo dnf install -y glances
Glances is also available as a snap package. It can be installed on all Linux systems as follows
$ sudo snap install glances
Also, since Glances is written in Python, you can also install it using the pip package manager as follows
$ pip3 install glances
For other installation procedures, please refer to this documentation on GitHub
Monitor System Metrics in Standalone Mode (Local System)
Starting Glances to monitor the local system (standalone mode) is very simple. Just run the glances command below without any command options.
$ glances
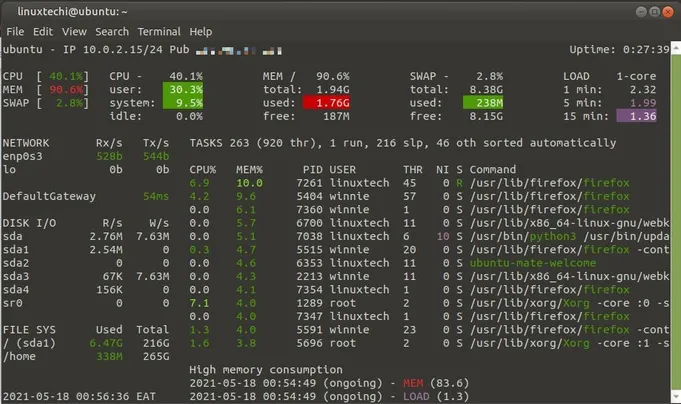
Right off the bat, you can see some system metrics, starting with the private and public IP addresses at the very top, and uptime in the upper right corner of the terminal. Below you can see other system metrics like CPU and memory utilization, network bandwidth rate, running processes, disk volumes, etc.
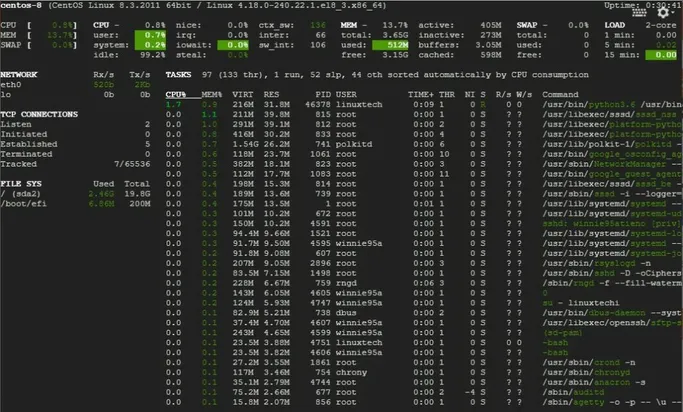
The following is a screenshot of the CentOS 8 system
To view these statistics on a web browser, use the -w option, which will generate a link as follows
$ glances -w
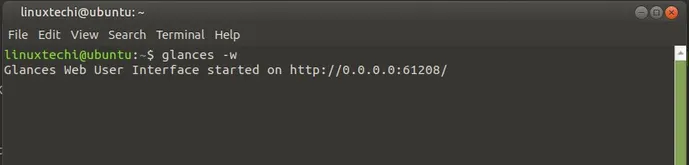
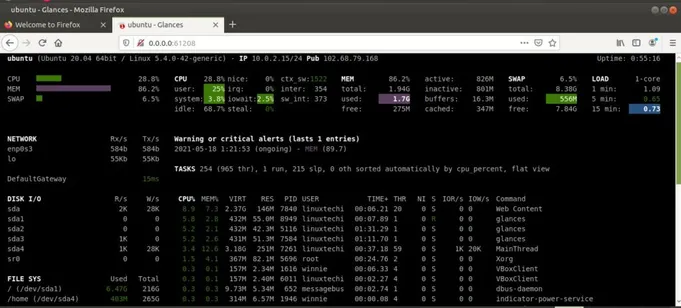
This will start listening on port 61208 and render statistics on the browser as shown
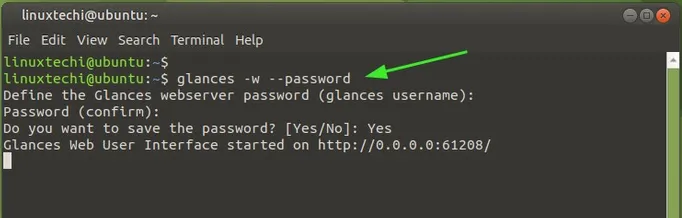
The web GUI can be secured by using the --password flag to only allow access to authorized users.
$ glances -w --password
Username defaults to glances
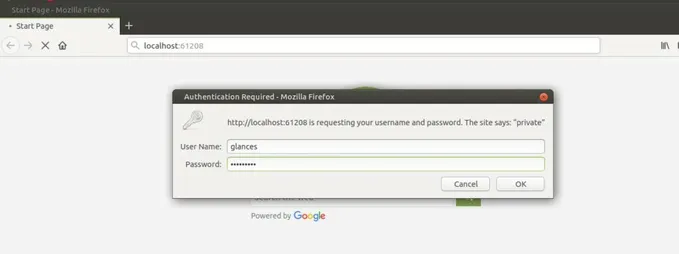
The next time to try to log in, you will be prompted for a password as shown.
The next time you log in, you will be prompted for your password as shown below
Monitor system metrics in server mode
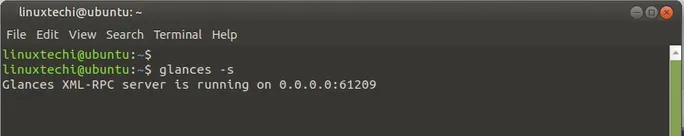
The glances command can also be used to monitor a remote host. Just pass the -s option to initialize glances in server mode as seen below.
The glances command can also be used to monitor remote hosts, just pass the -s option to initialize glance in server mode, as shown below
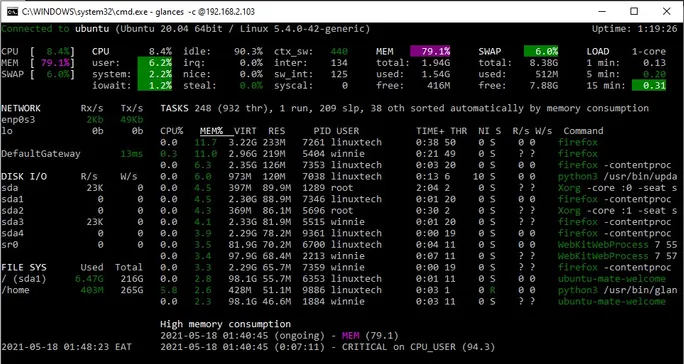
Run the glances command shown below on the client PC to access the server's metrics
$ glances -c server-IP-address
Below is a screenshot of the server metrics from the Windows command line
Glances alert
By using color coding when displaying system metrics, it is easier to spot and narrow down problems. You might be wondering what the different color codes represent, so here's a breakdown.
- GREEN: OK (everything is fine)
- BLUE: CAREFUL (need attention)
- VIOLET: WARNING (alert)
- RED: CRITICAL (critical)
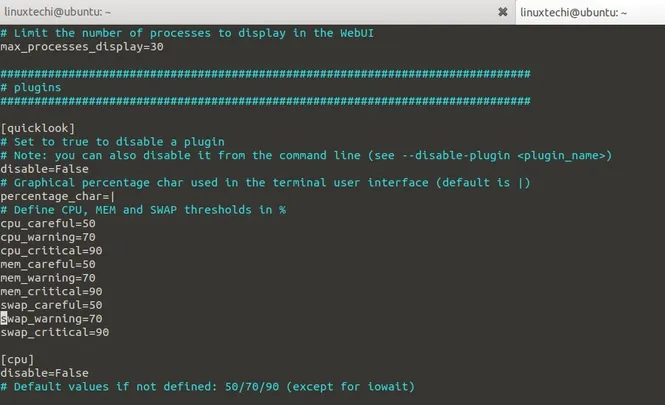
By default, the threshold is configured as
- careful=50
- warning=70
- critical=90
These are not static and can be customized in the glances configuration file /etc/glances/glances.conf
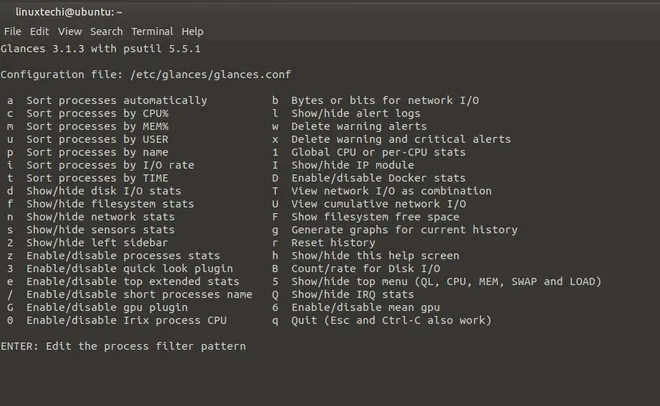
system help
Execute glances -h to view the command help, as shown below
$ glances -h
article summary
Glances is a handy tool, and in many ways feels like an improved version of the top or htop commands. It provides dynamic real-time system metrics that can be rendered on a web browser and retrieved remotely on the command line.
my open source project
