Table of contents
Saturated forecast (Forecasting Growth)
Saturated forecast (Forecasting Growth)
By default, Prophet uses a linear model for forecasting. When forecasting growth, there is usually a point of maximum reach: total market size, total population size, etc. This is known as carrying capacity, at which point the forecast should saturate.
Prophet allows you to make forecasts using a logical growth trend model with specified carrying capacity. We illustrate this with a traffic log of the R (programming language) page on Wikipedia:
# Python
df = pd.read_csv('https://raw.githubusercontent.com/facebook/prophet/main/examples/example_wp_log_R.csv')
We have to specify the carrying capacity in column caps. Here we will assume a specific value, but this is usually set based on data or expertise about the size of the market.
# Python
df['cap'] = 8.5
The important thing to note is that cap must be specified for each row in the dataframe, and it doesn't have to be a constant. If the market size is growing, then the cap can be an increasing sequence.
We then fit the model as before, except passing in an additional parameter specifying the logistic growth:
# Python
m = Prophet(growth='logistic')
m.fit(df)
As before, we make a data frame for future predictions, except we also have to specify the future capacity. Here we keep capacity at the same value as in history and forecast for the next 5 years:
# Python
future = m.make_future_dataframe(periods=1826)
future['cap'] = 8.5
fcst = m.predict(future)
fig = m.plot(fcst)
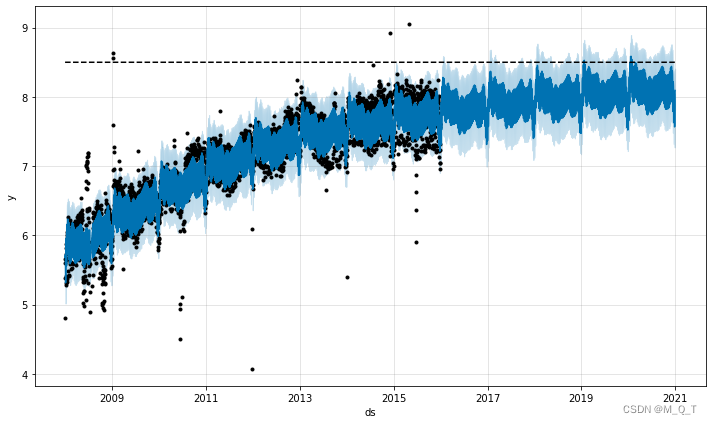
The implicit minimum of the logistic function is 0, and it saturates at 0 in the same way it saturates at capacity. A different saturation minimum can also be specified.
Saturating Minimum
Logistic growth models can also handle saturation minimums, which are specified by a column floor in the same way that cap columns specify maximum values:
# Python
df['y'] = 10 - df['y']
df['cap'] = 6
df['floor'] = 1.5
future['cap'] = 6
future['floor'] = 1.5
m = Prophet(growth='logistic')
m.fit(df)
fcst = m.predict(future)
fig = m.plot(fcst)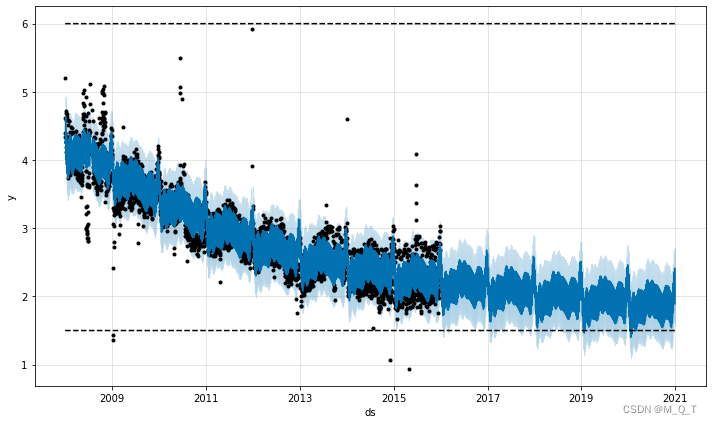
To use a logical growing trend with a saturating minimum, a maximum capacity must also be specified.