Table of contents
1. Typical data index system of Internet products
2. Data indicator system of e-commerce platform
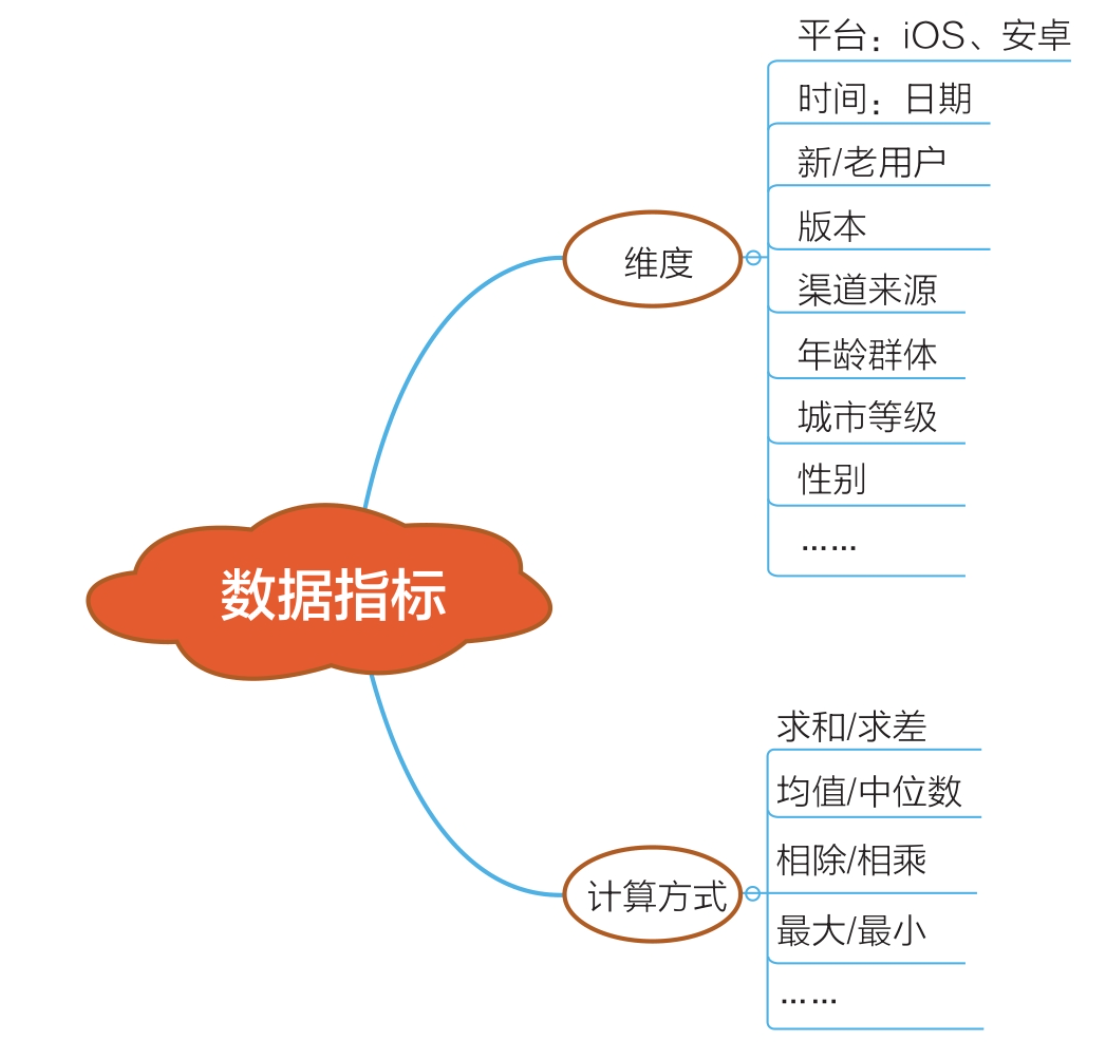
Data indicators are mainly composed of two parts : "dimension" and "calculation method" .
The data indicator system is to organize data indicators systematically, which can be organized according to functional modules, business modules, and other division methods. The role of the data index system mainly includes five aspects: monitoring the status quo, reflecting problems, predicting trends, evaluating and analyzing, and decision support.
The data indicator systems of different subdivided industries have both common points and differences.
The common point refers to that almost all industries pay attention to active user indicators such as DAU and MAU. Whether an APP is to survive or to be realized later, the number of active users is the foundation.
The difference refers to the fact that different industries focus on different points. For example, social apps will pay attention to user interaction indicators, like rate, comment rate, etc.; e-commerce apps will pay attention to transaction amount, number of transactions, etc.; music apps will pay attention to playing time, number of songs played, etc.
1. Typical data index system of Internet products
1. Pull new indicators
The new index is used to describe the growth of new users and the cost of acquiring customers. The main purpose is to hope that new users can grow steadily while maintaining a certain cost and income.
● Number of exposures: the number of users exposed by an APP, referring to how many users have seen this APP.
● Number of downloads: the number of people who have successfully downloaded an APP.
● Number of registrations: the number of people who have successfully registered for an APP.
● Exposure download conversion rate: number of downloads/number of impressions.
● Download registration conversion rate: number of registrations/number of downloads.
● Average cost of attracting new users: the total amount spent/the number of new users corresponding to the spend.
● ROI of attracting new users: the paid amount contributed by new users / the cost of attracting new users.
2. Active indicators
It is the first step for new users to come to the APP. The second step is to hope that the new users we acquire can be active and active enough times to stay in the APP for a long enough time. Activity indicators are indicators used to describe user activity.
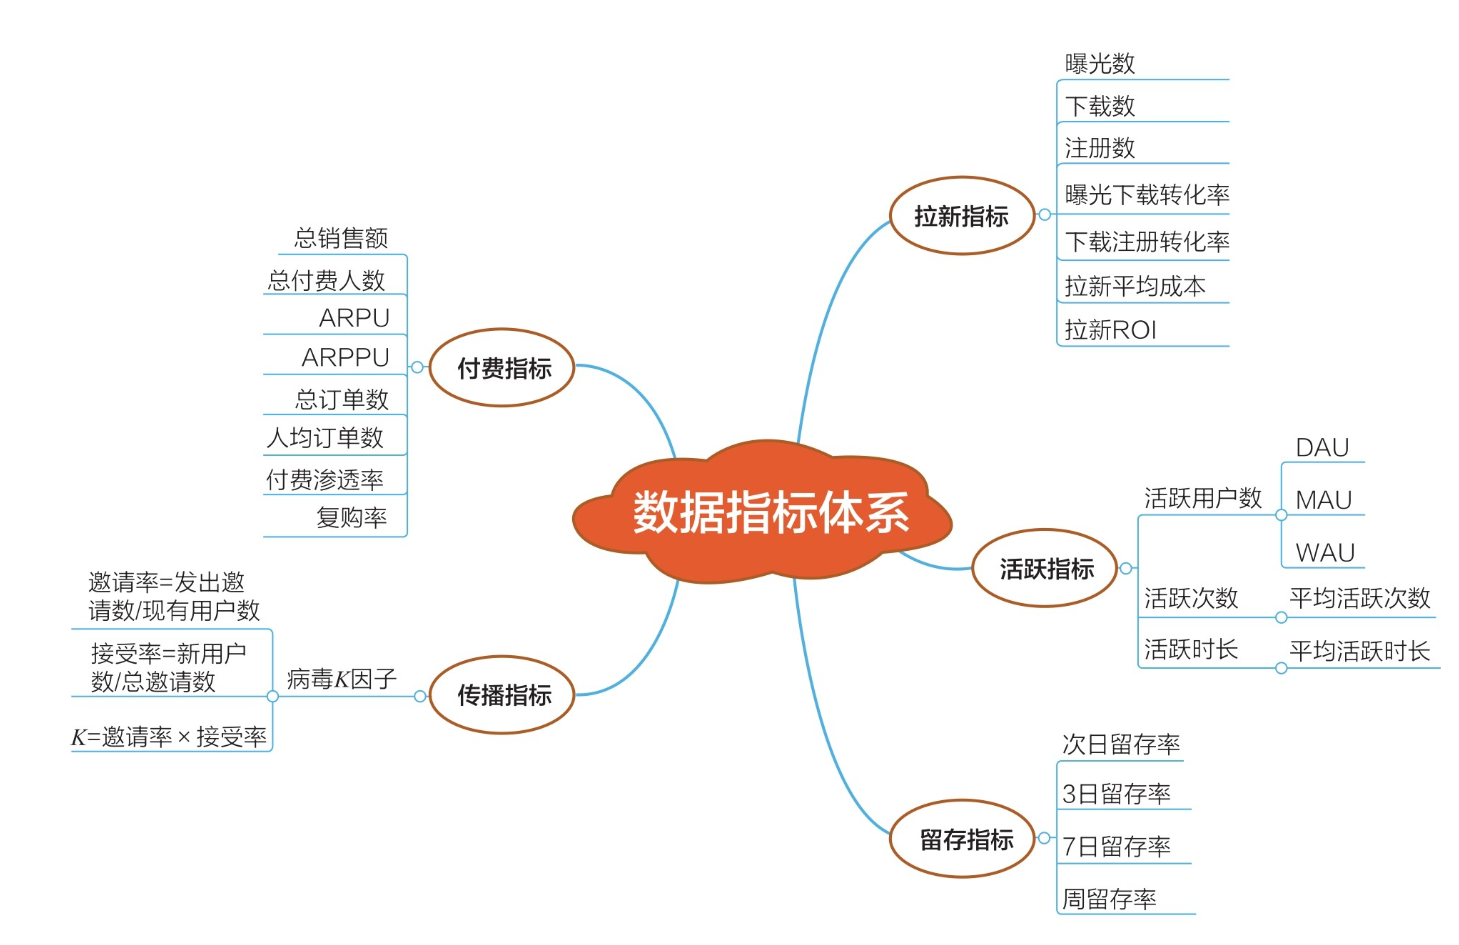
● DAU: the number of daily active users. Deduplication based on the number of active devices in a day.
● WAU: Weekly active users. Deduplication based on the number of active devices in a week.
● MAU: Monthly active users. Deduplication based on the number of active devices in a month.
● Active times: refers to the number of times a user is active in an APP.
● Active time: refers to the total time the user is active in the APP.
3. Retention indicators
When a user is active in the app, we hope that the user can continue to be active and have enough stickiness to the app. The retention indicator is an indicator used to describe the stickiness of the user.
● Day-to-day retention rate: The proportion of users who were active on that day are still active on the next day.
● Three-day retention rate: the proportion of users who are active on the current day are active on the third day.
● Seven-day retention rate: the proportion of users who are active on the current day are active on the seventh day.
● Weekly retention rate: the proportion of users who are active this week will still be active in the next week.
4. Paid indicators
When users have enough dependence on the APP, we hope that users can contribute income. Payment-related indicators are used to describe the payment frequency, amount, and loyalty of users.
● Total sales: total purchase amount.
● Total number of paid users: the number of paid users, deduplicated by the number of devices and then counted.
● ARPU (Average Revenue Per User): Average revenue contributed by each user.
● ARPPU (Average Revenue Per Paid User): the revenue contributed by each paying user.
● Total Order Quantity: the total quantity of the order.
● Number of orders per capita: total number of orders/number of order users.
● Paid penetration rate: number of users placing orders/total number of users.
● Repurchase rate: the proportion of users who placed an order and placed an order again.
5. Spread indicators
After the user stays on the platform, we hope that the user can forward the APP to more people. The related communication indicators are as follows.
● Invitation rate: the number of sending users/the number of existing users, which is used to describe the proportion of users who are willing to share.
● Acceptance rate: the number of acceptances/the number of invitations sent, which is used to describe how many users who receive invitations will be converted into new users.
● K factor: invitation rate × acceptance rate, taking into account the conversion of sharing and conversion of acceptance at the same time, and completely characterizes the entire communication link.
2. Data indicator system of e-commerce platform
The data indicator system of the e-commerce platform can be dismantled mainly from three aspects: users, products, and platforms (see figure).
1. User
(1) New additions.
● Number of new users per day: the number of devices newly added every day is deduplicated.
● Single customer acquisition cost: total cost/total number of new users.
● ROI (Return On Investment): return on investment.
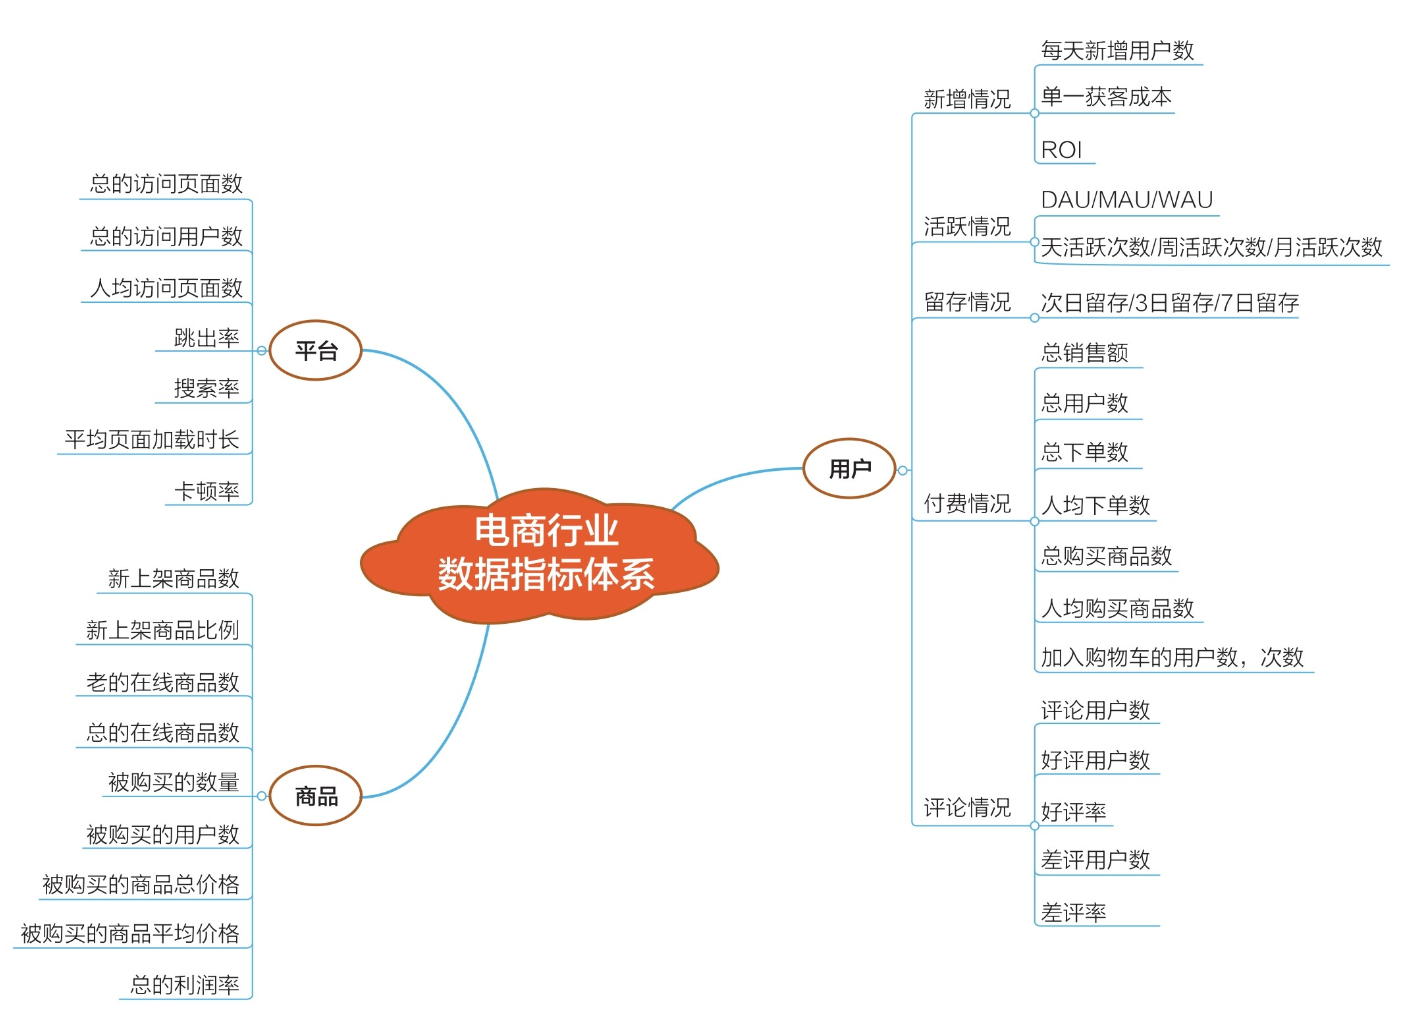
(2) Activity status.
● DAU: the number of daily active users.
● WAU: the number of active users in a week.
● MAU: the number of active users in a month.
● Daily active times: The number of active times per day, every time you open the APP, it is an active time.
● Weekly active times: the total number of active times in a week.
● Monthly active times: the total number of active times in a month.
(3) Retention (purchase).
● Next-day retention rate: the proportion of users who purchased on the same day continue to make purchases on the next day.
● Three-day retention rate: the proportion of users who purchased on the same day continue to purchase within three days.
● Seven-day retention rate: the proportion of users who purchased on the same day continue to purchase within seven days.
(4) Payment situation.
● Total Sales: The total revenue amount.
● Total paying users: the total number of paying users.
● Total Orders: The total number of orders placed.
● Number of orders per capita: total number of orders/total number of paying users.
● Total Purchased Items: The total number of items purchased by the user.
● The number of products purchased per capita: the total number of purchased products/total number of paying users.
(5) Comment on the situation.
● Number of commenting users: the number of users who have commented successfully.
● The number of users with positive comments; the number of users who have successfully initiated positive comments.
● Positive rate: the number of favorable users/the number of commenting users.
● Number of users with bad reviews: the number of users who have successfully sent negative reviews.
● Negative review rate: the number of users with negative reviews/total number of users.
2. Platform
● Total visited pages: the total number of opened pages.
● Total number of visiting users: the total number of users who have opened the page.
● Number of visited pages per capita: total number of visited pages/total number of visited users.
● Bounce Rate: The number of times you leave the site after visiting a page/total number of visits.
● Search rate: the number of users who search / the number of active users.
● Average page load time: the time it takes for the page to be successfully displayed from the beginning of loading.
3. Products
● Number of newly launched products: the number of new products launched on the current day.
● The number of old products on the shelf: the number of old products on the shelf.
● Total number of online products: the total number of online products of the day.
● Ratio of new listings: new listings/total online listings.
● Old on-shelf ratio: number of old on-shelf products/total number of online products.
● Quantity purchased: the number of products purchased.
● Total price of purchased products: the total amount of purchased products.
● Average price per item: total price of items purchased/quantity purchased.
● Total Profit Rate: (Total Revenue - Total Cost)/Total Cost.
Well, the index system is introduced here. In the next article, we will introduce [ How to build a data index system].
The article refers to the book "Data Analysis Methodology and Practice".