Article directory
-
- 13.1. GC classification and performance indicators
- 13.2. Overview of the different garbage collectors
-
- 13.2.1. History of Garbage Collector Development
- 13.2.2. Seven Classic Garbage Collectors
- 13.2.3. The relationship between seven classic collectors and garbage generation
- 13.2.4. Garbage collector composition
- 13.2.5. Overview of the different garbage collectors
- 13.2.6. How to view the default garbage collector
- 13.3. Serial collector: serial collection
- 13.4. ParNew Collector: Parallel Collection
- 13.5. Parallel Collector: Prioritize Throughput
- 13.6. CMS Collector: Low Latency
- 13.7. The G1 Collector: Regionalized Generational
-
- 13.7.1. Features (Advantages) of the G1 Collector
- 13.7.2. Disadvantages of the G1 Garbage Collector
- 13.7.3. Parameter Settings of G1 Collector
- 13.7.4. Common operation steps of G1 collector
- 13.7.5. Applicable scenarios of G1 collector
- 13.7.6. Partition Region: split into zero
- 13.7.7. The recovery process of the G1 garbage collector 【Understand】
- 13.7.8. Remembered Set
- 13.7.9. G1 Collection Process 1: Young Generation GC
- 13.7.10. G1 recycling process 2: concurrent marking process
- 13.7.11. G1 Recycling Process 3: Mixed Recycling
- 13.7.12. G1 recovery optional process four: Full GC
- 13.7.13. G1 Collector Optimization Recommendations
- 13.8. Garbage Collector Summary
- 13.9. GC log analysis
- 13.X. New Developments in the Garbage Collector
13.1. GC classification and performance indicators
13.1.1. Garbage Collector Overview
The garbage collector is not regulated too much in the specification, and it can be implemented by different vendors and different versions of the JVM.
Since the JDK version is in a high-speed iteration process, Java has developed many GC versions so far.
Analyzing garbage collectors from different angles, GC can be divided into different types.
13.1.2. Garbage Collector Classification
according toThreadspoints, can be divided intoserial garbage collectorandparallel garbage collector。
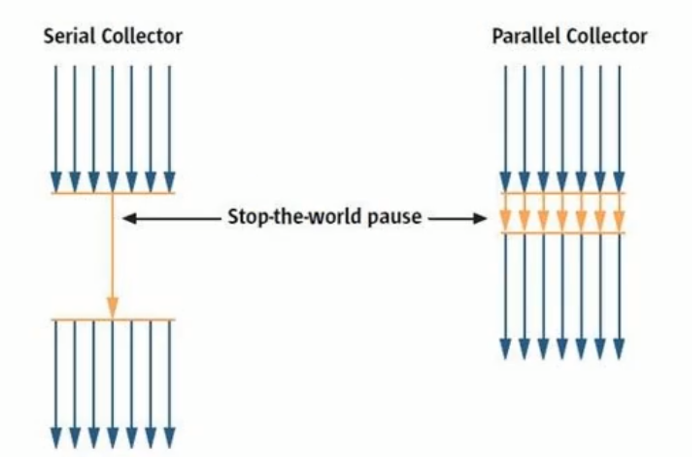
Serial collection means that only one CPU is allowed to perform garbage collection operations at the same time period. At this time, the worker thread is suspended until the garbage collection work ends.
- In situations where the hardware platform is not particularly superior, such as a single CPU processor or a small application memory, the performance of the serial collector can outperform the parallel collector and the concurrent collector. so,Serial recycling is applied by default to the JVM in Client mode of the client
- On CPUs with strong concurrency capabilities, the parallel collector produces shorter pause times than the serial collector.
Contrary to serial collection, parallel collection can use multiple CPUs to perform garbage collection at the same time, thus improving the throughput of the application, but parallel collection is still the same as serial collection, using exclusive mode and using the "Stop-the-World" mechanism .
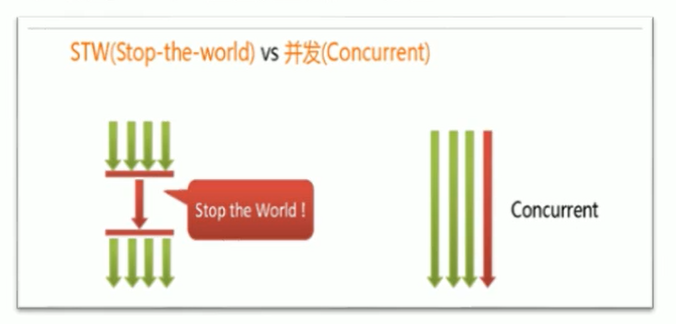
according toOperating modepoints, can be divided intoconcurrent garbage collectorandexclusive garbage collector。
- The concurrent garbage collector works alternately with application threads to minimize application pause times.
- Once the exclusive garbage collector (Stop the world) runs, it stops all user threads in the application until the garbage collection process is completely over.
according toFragmentationpoints, can be divided intocompact garbage collectorandnon-compressing garbage collector。
- The compact garbage collector will compress and organize the surviving objects after the collection is completed, and eliminate the fragments after collection.
- Non-compacting garbage collectors do not perform this step.
according toworking memory rangepoints, can be divided intoYoung Generation Garbage CollectorandOld Generation Garbage Collector。
13.1.3. Evaluating GC Performance Metrics
- throughput: The ratio of the running time of user code to the total running time (total running time = program running time + memory recovery time)
- garbage collection overhead: The complement of throughput, the ratio of the time spent in garbage collection to the total running time.
- pause time: The amount of time the program's worker threads are suspended while performing garbage collection.
- collection frequency: How often the collection operation occurs relative to the execution of the application.
- memory usage: The memory size occupied by the Java heap area.
- fast: The time elapsed from the birth of an object to its recycling.
Throughput, pause time, and memory usage together form an "impossible triangle". The overall performance of the three will get better and better as technology advances. An excellent collector usually satisfies at most two of them at the same time.
Among these three items, the importance of pause time is becoming increasingly prominent. Because with the development of hardware, more memory usage is more and more tolerable, and the improvement of hardware performance also helps to reduce the impact of the collector on the application when it is running, that is, to increase the throughput. The expansion of the memory has a negative effect on the delay.
To put it simply, we mainly grasp two points: throughput and pause time
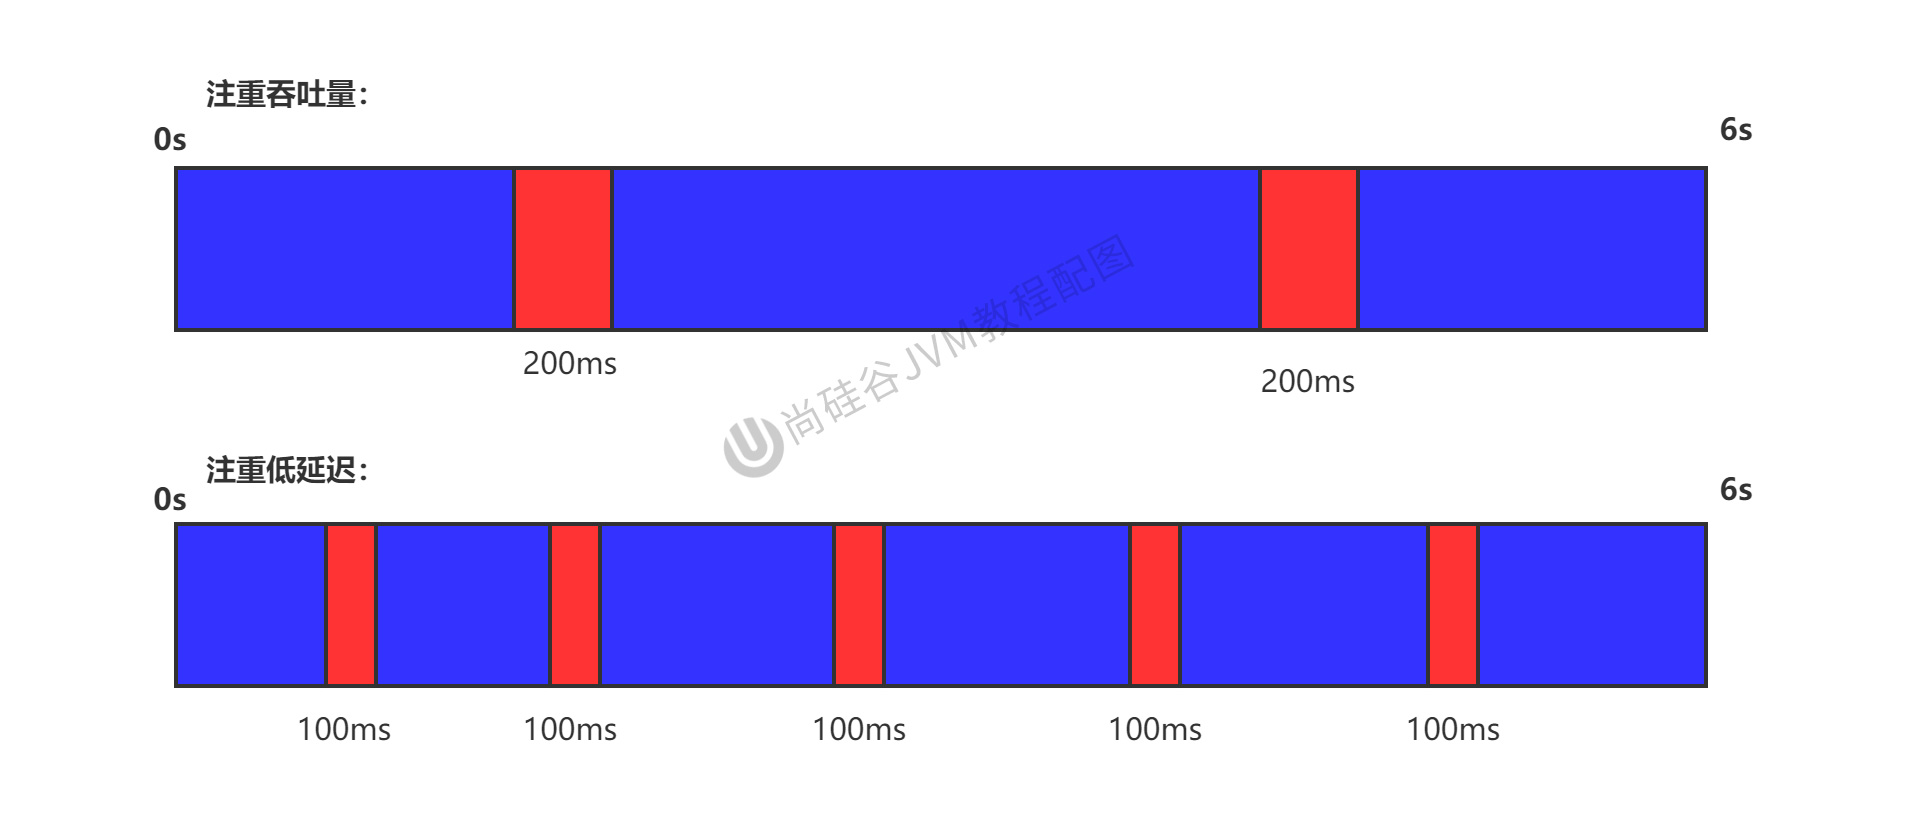
throughput
Throughput is the ratio of the time spent by the CPU on running user code to the total time consumed by the CPU, that is, throughput = running time of user code/(time of running user code + garbage collection time). For example: if the virtual machine runs for 100 minutes in total, and garbage collection takes 1 minute, then the throughput is 99%.
In this case, the application can tolerate higher pause times, so high-throughput applications have a longer time base, and fast response is not a concern
Throughput priority means that STW has the shortest time per unit time: 0.2 + 0.2 = 0.4
pause time
"Pause time" refers to the state where the application thread is suspended for a period of time, allowing the GC thread to execute.
For example, a pause time of 100 milliseconds during GC means that no application threads were active during those 100 milliseconds.
Pause time is prioritized, which means that the time for a single STW is the shortest possible: 0.1 + 0.1 + 0.1 + 0.1 + 0.1 = 0.5
Throughput vs Pause Time
High throughput is better because it gives the end user of the application the impression that only the application threads are doing "productive" work. Intuitively, the higher the throughput, the faster the program will run.
Low pause times (low latency) are better because it's always bad from an end user's point of view to have an application hang whether it's GC or something else. It depends on the type of application,Sometimes even a brief 200ms pause can interrupt the end user experience. Therefore, it is very important to have a low maximum pause time, especially for ainteractive application。
Unfortunately "high throughput" and "low pause time" are a pair of competing goals (contradiction).
- Because if you choose to prioritize throughput, thenIt is necessary to reduce the execution frequency of memory recovery, but this will cause the GC to take longer pauses to perform memory reclamation.
- On the contrary, if you choose the principle of low latency priority, then in order to reduce the pause time each time memory recovery is performed, alsoMemory recovery can only be performed frequently, but this in turn causes shrinkage of the young generation memory and leads to a decrease in program throughput.
When designing (or using) a GC algorithm, we must determine our goals: a GC algorithm may only aim at one of two goals (i.e. only focus on maximum throughput or minimum pause time), or try to find a combination of both compromise.
Standard now:Reduce pause times where maximum throughput is a priority
13.2. Overview of the different garbage collectors
The garbage collection mechanism is a signature capability of Java, which greatly improves development efficiency. This is of course also a hot spot for interviews.
13.2.1. History of Garbage Collector Development
With a virtual machine, a garbage collection mechanism is definitely needed. This is Garbage Collection, and the corresponding product is called Garbage Collector.
- In 1999, serialGc came along with JDK1.3.1, which is the first GC. The ParNew garbage collector is a multi-threaded version of the Serial collector
- On February 26, 2002, Parallel GC and Concurrent Mark Sweep GC were released together with JDK1.4.2·
- Parallel GC becomes the default GC of HotSpot after JDK6.
- In 2012, in the JDK1.7u4 release, G1 is available.
- In 2017, G1 became the default garbage collector in JDK9 to replace CMS.
- March 2018, Parallel Full Garbage Collection for the G1 Garbage Collector in JDK10, enabling parallelism to improve worst-case latency.
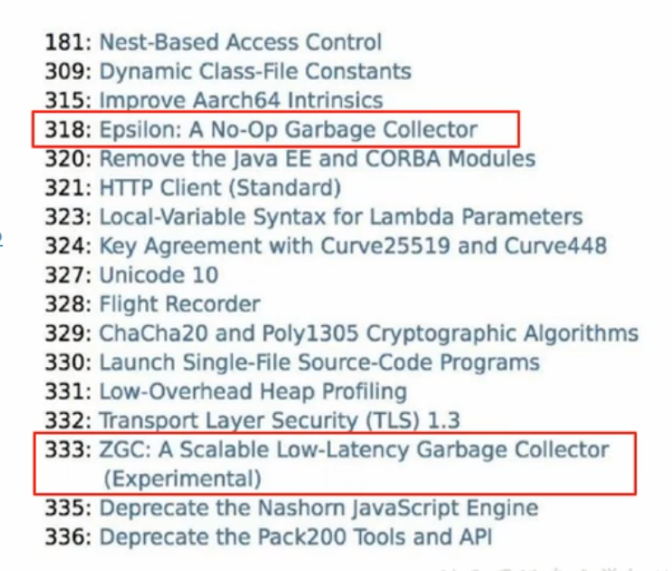
- In September 2018, JDK11 was released. Introduced the Epsilon garbage collector, also known as the "No-Op (no operation)" collector. At the same time, introduce ZGC: scalable low-latency garbage collector (Experimental)
- In March 2019, JDK12 was released. Enhanced G1 to automatically return unused heap memory to the operating system. At the same time, introduce Shenandoah GC: GC with low pause time (Experimental). ·
- In September 2019, JDK13 was released. Enhance ZGC to automatically return unused heap memory to the operating system.
- In March 2020, JDK14 was released. Remove the CMS garbage collector. Extend the application of ZGC on macos and Windows
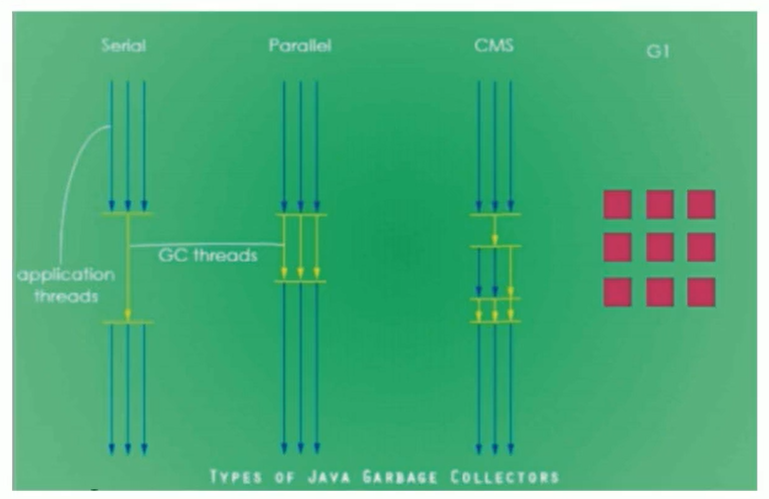
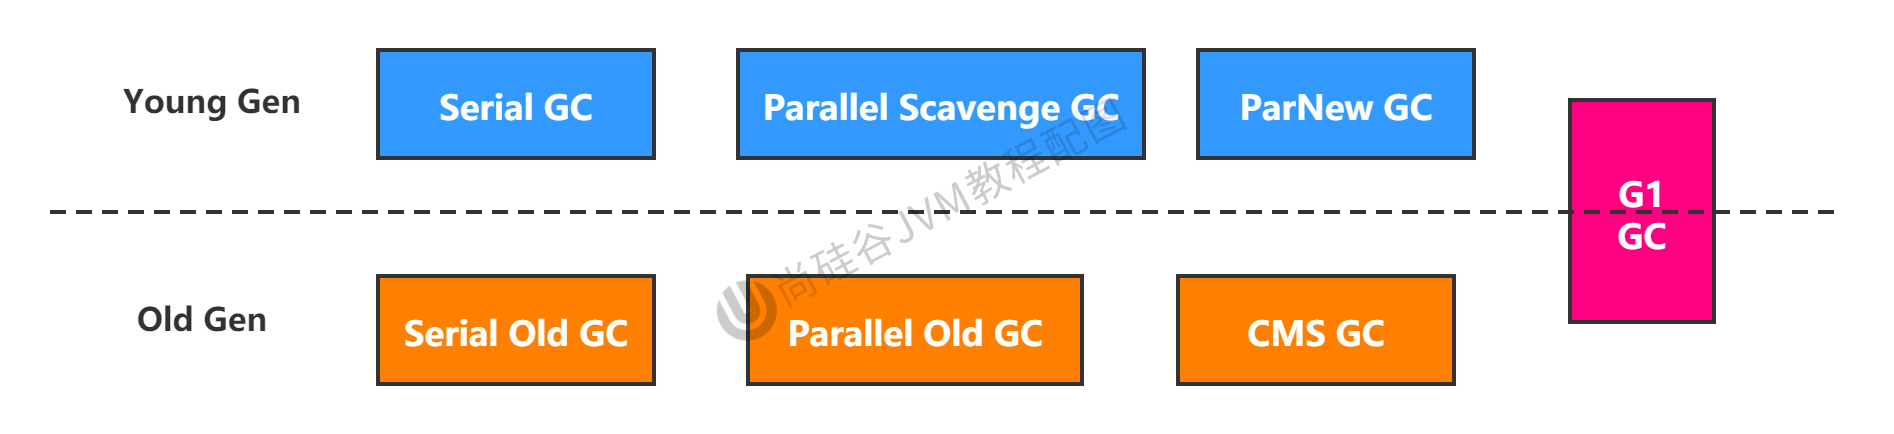
13.2.2. Seven Classic Garbage Collectors
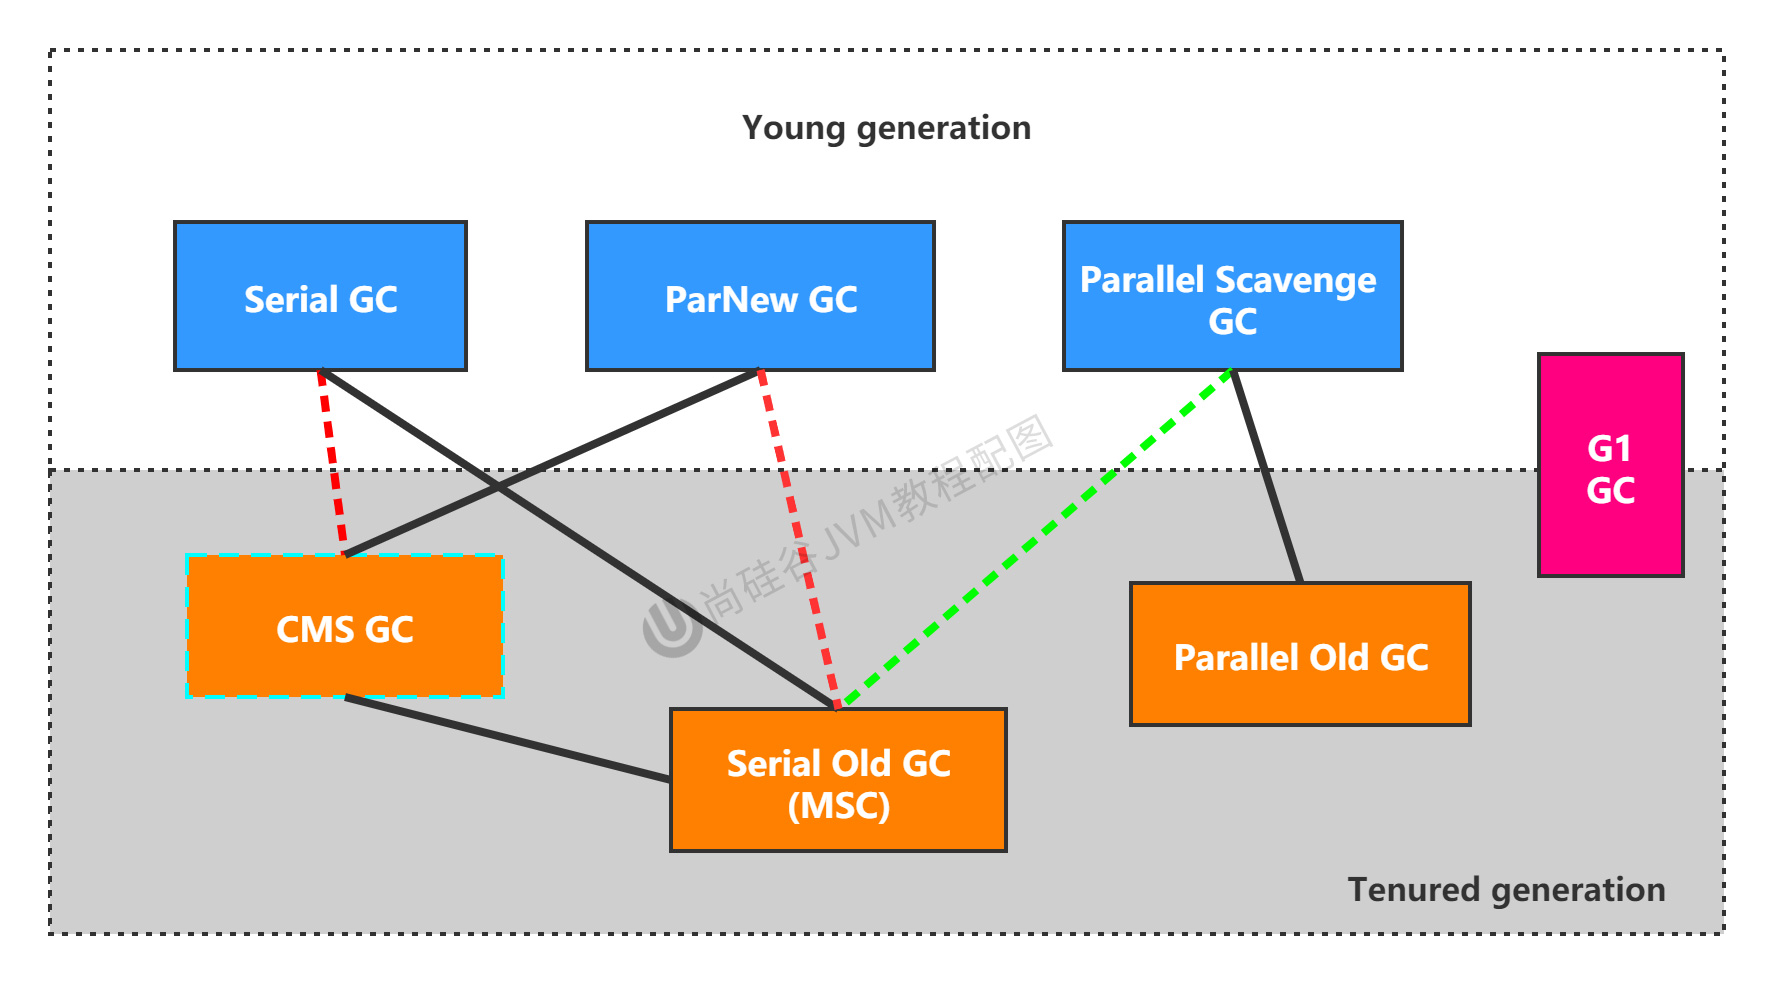
- Serial collector: Serial, Serial Old
- Parallel collectors: ParNew, Parallel Scavenge, Parallel old
- Concurrent collectors: CMS, G1
Official manual: https://www.oracle.com/technetwork/java/javase/tech/memorymanagement-whitepaper-1-150020.pdf
13.2.3. The relationship between seven classic collectors and garbage generation
-
New generation collectors: Serial, ParNew, Parallel Scavenge;
-
Old age collectors: Serial Old, Parallel Old, CMS;
-
Whole heap collector: G1;
13.2.4. Garbage collector composition

- There is a connection between the two collectors, indicating that they can be used together: Serial/Serial Old, Serial/CMS, ParNew/Serial Old, ParNew/CMS, Parallel Scavenge/Serial Old, Parallel Scavenge/Parallel Old, G1;
- Among them, Serial Old is
Concurrent Mode Failurethe backup plan for " " failure of CMS. - (Red dotted line) Due to the cost of maintenance and compatibility testing, the two combinations of Serial+CMS and ParNew+Serial Old were declared obsolete in JDK 8 (JEP173), and support for these combinations was completely canceled in JDK9 (JEP214 ), i.e. remove.
- (Green dotted line) In JDK14: deprecate the combination of Parallel Scavenge and Serialold GC (JEP366)
- (Green dashed box) In JDK14: remove CMS garbage collector (JEP363)
13.2.5. Overview of the different garbage collectors
Why are there many collectors, one is not enough? Because there are many usage scenarios of Java, such as mobile terminal, server and so on. Therefore, it is necessary to provide different garbage collectors for different scenarios to improve the performance of garbage collection.
Although we will compare various collectors, it is not to pick a best collector. There is no one-size-fits-all perfect collector that is applicable in any scenario, let alone a universal collector. soWe only choose the most suitable collector for the specific application。
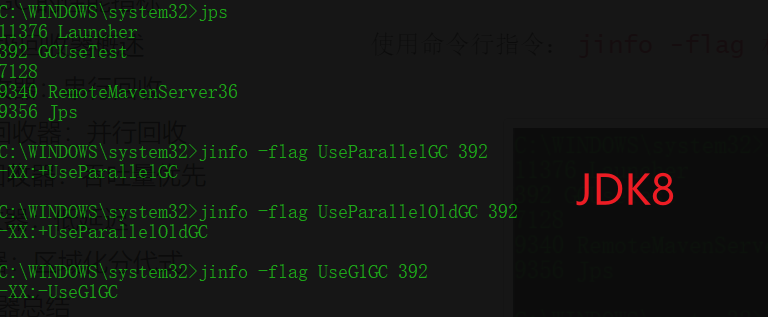
13.2.6. How to view the default garbage collector
-XX:+PrintCommandLineFlags: View command line related parameters (including the garbage collector used)
Use command line instructions:jinfo -flag 相关垃圾回收器参数 进程ID
13.3. Serial collector: serial collection
The Serial collector is the most basic and oldest garbage collector. The only option to recycle the new generation before JDK1.3.
The Serial collector serves as the default new generation garbage collector in client mode in HotSpot.
The Serial collector performs memory reclamation using copy algorithms, serial reclamation, and "stop-the-world" mechanisms.
In addition to the young generation, the Serial collector also provides the Serial Old collector for performing old generation garbage collection.The Serial Old collector also uses the serial recycling and "Stop the World" mechanism, but the memory recycling algorithm uses the mark-compression algorithm.
- Serial old is the default old generation garbage collector running in Client mode
- Serial 0ld has two main uses in Server mode: ① It is used in conjunction with the new generation of Parallel scavenge ② It is used as a backup garbage collection scheme for the old generation CMS collector
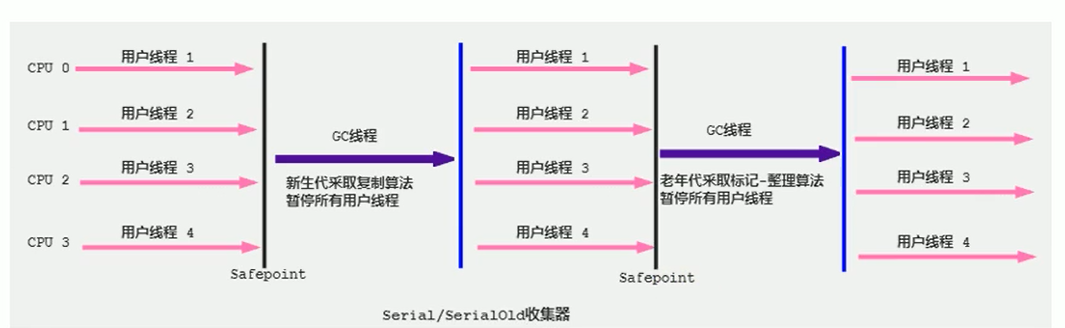
This collector is a single-threaded collector, but its "single-threaded" meaning does not just mean that it will onlyUse one CPU or one collection thread to complete garbage collection, and more importantly when it is garbage collected,All other worker threads must be suspendeduntil it collects (Stop The World)
Advantage:simple and efficient(Compared with the single-thread of other collectors), for an environment limited to a single CPU, the Serial collector has no thread interaction overhead, so it can naturally obtain the highest single-thread collection efficiency by concentrating on garbage collection. A virtual machine running in Client mode is a good choice.
In the user's desktop application scenario, the available memory is generally not large (tens of MB to one or two hundred MB), and garbage collection can be completed in a relatively short period of time (tens of ms to more than 100 ms). As long as it does not happen frequently, use A serial collector is acceptable.
In the HotSpot virtual machine, -XX:+UseSerialGCparameters can be used to specify that both the young generation and the old generation use the serial collector. It is equivalent to using Serial GC in the new generation, and using Serial Old GC in the old generation
Summarize
This kind of garbage collector is known to everyone, and serial ones are no longer used. And it can only be used on a limited single-core cpu. It's not single core anymore.
For highly interactive applications, this kind of garbage collector is unacceptable. Generally, serial garbage collectors are not used in Java web applications.
13.4. ParNew Collector: Parallel Collection
If Serial GC is a single-threaded garbage collector in the young generation, then the ParNew collector is a multi-threaded version of the Serial collector. Par is the abbreviation of Parallel, New: can only deal with the new generation
In addition to using the ParNew collectorparallel collectionThere is hardly any difference between the two garbage collectors except for the way memory collection is performed. The ParNew collector is also used in the young generationReplication algorithm, "Stop-the-World" mechanism。
ParNew is the default garbage collector for the new generation of many JVMs running in Server mode.

- For the new generation, the number of collections is frequent, and the use of parallel methods is efficient.
- For the old generation, the number of recycling is small, and the serial method is used to save resources. (The CPU needs to switch threads in parallel, and serial can save the resources of switching threads)
Since the ParNew collector is based on parallel collection, can it be concluded that the recovery efficiency of the ParNew collector will be more efficient than the serial collector in any scenario?
- The ParNew collector runs in a multi-CPU environment. Since it can make full use of the advantages of physical hardware resources such as multiple CPUs and multiple cores, it can complete garbage collection more quickly and improve the throughput of the program.
- butIn a single CPU environment, the ParNew collector is not more efficient than the Serial collector. Although the Serial collector is based on serial recycling, since the CPU does not need to switch tasks frequently, it can effectively avoid some additional overhead generated during multi-thread interaction.
Because apart from Serial, currently only ParNew GC can work with the CMS collector
In the program, developers can -XX:+UseParNewGCmanually specify to use the ParNew collector to perform memory recovery tasks through the option " ". It means that the young generation uses the parallel collector and does not affect the old generation.
-XX:ParallelGCThreadsLimit the number of threads. By default, the same number of threads as the CPU data is enabled.
13.5. Parallel Collector: Prioritize Throughput
In addition to the ParNew collector in HotSpot's young generation, which is based on parallel collection, the Parallel Scavenge collector also usesReplication Algorithm, Parallel Collection, and "Stop the World" Mechanism。
So is the emergence of the Parallel collector superfluous?
- Unlike the ParNew collector, the goal of the ParallelScavenge collector is to achieve aControllable Throughput(Throughput), it is also known as a throughput-first garbage collector.
- The adaptive adjustment strategy is also an important difference between Parallel Scavenge and ParNew.
High throughput can use CPU time efficiently and complete the calculation tasks of the program as soon as possible.Suitable for tasks that operate in the background without much interaction. Therefore, it is commonly used in server environments.For example, those applications that perform batch processing, order processing, payroll, scientific computing。
The Parallel collector provides the Parallel Old collector for garbage collection in the old age in JDK1.6, which is used to replace the Serial Old collector in the old age.
The Parallel Old collector uses themark-compression algorithm, but also based onParallel collection and "Stop-the-World" mechanism。
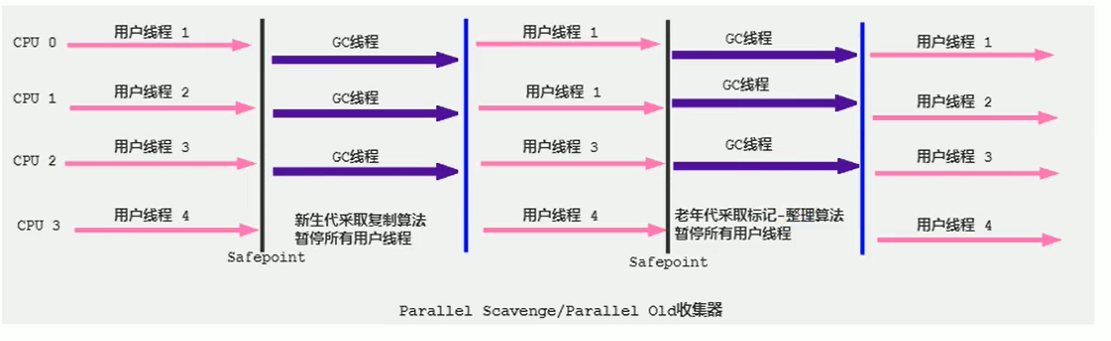
In the application scenario where the program throughput is prioritized, the combination of the Parallel collector and the Parallel Old collector has very good memory recovery performance in Server mode. In Java8, this garbage collector is the default.
parameter configuration
-
-XX:+UseParallelGCManually specify the young generation to use the Parallel parallel collector to perform memory reclamation tasks. -
-XX:+UseParallelOldGCManually specifying the old generation uses the parallel collection collector.- Applicable to the new generation and the old generation respectively. By default jdk8 is enabled.
- For the above two parameters, one is enabled by default, and the other will also be enabled. (mutual activation)
-
-XX:ParallelGCThreadsSets the number of threads for the young generation parallel collector. In general, it is best to be equal to the number of CPUs to avoid excessive thread counts affecting garbage collection performance.KaTeX parse error: Undefined control sequence: \* at position 81: …= 8) \\ 3 + (5 \̲*̲ CPU_Count / 8)…
-
-XX:MaxGCPauseMillisSets the garbage collector maximum pause time (ie STw time). The unit is milliseconds.- In order to control the pause time within MaxGCPauseMills as much as possible, the collector will adjust the Java heap size or some other parameters when working.
- For users, the shorter the pause time, the better the experience. But on the server side, we focus on high concurrency and overall throughput. So the server side is suitable for Parallel, for control.
- Use this parameter with caution. [If this parameter is set very small, the heap will be adjusted very small, so the frequency of GC will be high and the throughput will be reduced]
-
-XX:GCTimeRatioThe ratio of garbage collection time to total time (=1/(N+1)). The size used to measure throughput.- Value range (0, 100). The default value is 99, which means that the garbage collection time does not exceed 1%.
-XX:MaxGCPauseMillisThere is a certain contradiction with the previous parameter. The longer the pause time, the easier it is for the Radio parameter to exceed the set ratio.
-
-XX:+UseAdaptivesizePolicySet up a Parallel Scavenge collector withAdaptive Adjustment Strategy- In this mode, parameters such as the size of the young generation, the ratio of Eden to Survivor, and the age of objects promoted to the old generation will be automatically adjusted to reach a balance between heap size, throughput, and pause time.
- In situations where manual tuning is difficult, you can directly use this adaptive method, only specifying the maximum heap of the virtual machine, the target throughput ( )
GCTimeRatioand the pause time (MaxGCPauseMills), and let the virtual machine complete the tuning work by itself.
You don’t need to remember all the parameters, you just need to remember which parameters the garbage collector can adjust. When using it, check the documentation
13.6. CMS Collector: Low Latency
13.6.1 Overview of CSM
During the JDK1.5 period, Hotspot launched aStrong interactive applicationAmong them, it can be regarded as an epoch-making garbage collector: CMS (Concurrent-Mark-Sweep) collector,This collector is the first truly concurrent collector in the HotSpot virtual machine. It is the first time that the garbage collection thread and the user thread work simultaneously。
The focus of the CMS collector is to minimize user thread pause times during garbage collection. The shorter the pause time (low latency), the more suitable for programs that interact with users, and good response speed can improve user experience.
- At present, a large part of Java applications are concentrated on the Internet website or the server side of the B/S system. This type of application pays special attention to the response speed of the service and hopes that the system pause time will be the shortest, in order to bring better user experience. The CMS collector is very suitable for the needs of such applications.
The garbage collection algorithm of the CMS usesmark-sweep algorithm, and will also "Stop-the-World"
Unfortunately, CMS, as the collector of the old generation, cannot work with the existing new generation collector Parallel Scavenge in JDK1.4.0, so when using CMS to collect the old generation in JDK1.5, the new generation can only Choose one of the ParNew or Serial collectors.
Before the advent of G1, CMS was still very widely used. To this day, there are still many systems using CMS GC.

The whole process of CMS is more complicated than the previous collector. The whole process is divided into 4 main stages, namely the initial marking phase, concurrent marking phase, re-marking phase and concurrent clearing phase
- Initial mark (Initial-Mark) phase: In this phase, all worker threads in the program will be temporarily suspended due to the "Stop-the-World" mechanism. The main task of this phaseJust mark the objects that GCRoots can be directly related to. All application threads that were suspended will be resumed once the marking is complete. Since the directly associated objects are relatively small, herehigh speed。
- Concurrent -Mark phase: from GC RootsDirectly associated objects start the process of traversing the entire object graph, this process takes a long time butNo need to stall user threads, which can run concurrently with the garbage collection thread.
- Remark (Remark) phase: Since in the concurrent mark phase, the worker threads of the program will run simultaneously or cross-run with the garbage collection thread, so in orderDuring concurrent marking, the marking record of the part of the object whose marking changes due to the continuation of the user program is corrected, the pause time of this phase is usually slightly longer than the initial marking phase, but much shorter than the concurrent marking phase.
- Concurrent-Sweep phase: this phaseClean up and delete the dead objects judged in the marking stage, and release the memory space. Since there is no need to move surviving objects, this stage can also be concurrent with user threads
Although the CMS collector uses concurrent collection (non-exclusive), butIt still needs to implement the "Stop-the-World" mechanism in its initial marking and re-marking phasesPause the working threads in the program, but the pause time is not too long, so it can be said that all current garbage collectors cannot do "stop-the-world" at all, but shorten the pause time as much as possible.
Since the most time-consuming concurrent marking and concurrent sweeping phases do not require pausing work, the overall collection is low-pause.
In addition, since user threads are not interrupted during the garbage collection phase,So during the CMS recycling process, you should also ensure that the application user thread has enough memory available. Therefore, the CMS collector cannot wait until the old generation is almost completely filled, as other collectors do, but insteadWhen the heap memory usage reaches a certain threshold, recycling starts, to ensure that the application still has enough space to support the application to run while the CMS is working. Concurrent Mode FailureIf the memory reserved during the running of the CMS cannot meet the needs of the program, a " " failure will occur , and the virtual machine will start the backup plan: temporaryEnable the Serial Old collectorTo restart the garbage collection of the old generation, the pause time [STW] is very long.
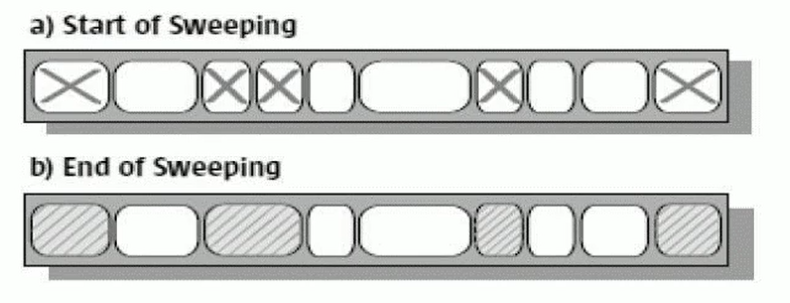
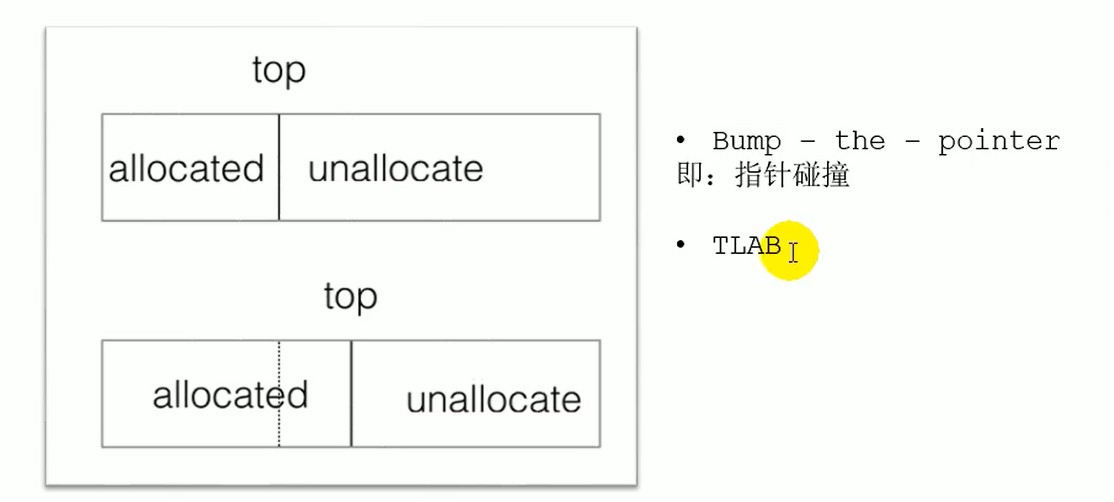
The garbage collection algorithm of the CMS collector uses a mark-and-sweep algorithm, which means that after each memory recovery is performed, the memory space occupied by the useless objects that perform memory recovery is very likely to be some discontinuous memory blocks. avoid willgenerate some memory fragmentation. Then when CMS allocates memory space for new objects, it will not be able to use the pointer collision (Bump the Pointer) technology, but can only select the free list (Free List) to perform memory allocation.
Some people may think that since Mark Sweep will cause memory fragmentation, why not change the algorithm to Mark Compact?
The answer is actually very simple, because when cleaning concurrently, if you use Compact to organize the memory, how can the memory used by the original user thread be used?To ensure that the user thread can continue to execute, the premise is that the resources it runs on are not affectedWell. Mark Compact is more suitable for use in "Stop the World" scenarios
13.6.2. Advantages and disadvantages of CMS
advantage:
- concurrent collection
- low latency
shortcoming:
- memory fragmentation, resulting in insufficient space available to user threads after concurrent clearing. In the case where large objects cannot be allocated, FullGC has to be triggered in advance.
- CMS collector is very sensitive to CPU resources. In the concurrency stage, although it will not cause users to pause, it will slow down the application and reduce the total throughput because it occupies a part of the thread.
- CMS collector cannot handle floating garbage. There may be "
Concurrent Mode Failure"failures that lead to another Full GC. In the concurrent marking phase, since the program's worker threads and garbage collection threads are running at the same time or cross-running, thenIf new garbage objects are generated during the concurrent marking phase, CMS will not be able to mark these garbage objects, which will eventually lead to these newly generated garbage objects not being collected in time, so that the memory space that has not been reclaimed before can only be released when the GC is executed next time.
13.6.3. Parameters set
-
-XX:+UseConcMarkSweepGCManually specify to use the CMS collector to perform memory reclamation tasks.After this parameter is turned on, it will be
-xx:+UseParNewGCturned on automatically. That is: the combination of ParNew (for Young area) + CMS (for Old area) + Serial Old. -
-XX:CMSInitiatingOccupanyFractionSets the threshold of heap memory usage, once the threshold is reached, the collection will start.- The default value of JDK5 and previous versions is 68, that is, when the space usage rate of the old generation reaches 68%, a CMS recovery will be performed.The default value of JDK6 and above is 92%
- If the memory growth is slow, you can set a slightly larger value. A larger threshold can effectively reduce the trigger frequency of CMS, and reduce the number of old generation recycling can significantly improve application performance. Conversely, if the application's memory usage grows rapidly, this threshold should be lowered to avoid triggering the old serial collector frequently. Therefore, this option can effectively reduce the execution times of FullGC.
-
-XX:+UseCMSCompactAtFullCollectionIt is used to specify that the memory space should be compressed and sorted after the Full GC is executed, so as to avoid memory fragmentation. However, since the memory compression and sorting process cannot be executed concurrently, the problem is that the pause time becomes longer. -
-XX:CMSFullGCsBeforeCompactionSet how many times the Full GC is performed to compact the memory space. [Use in conjunction with the previous parameter] -
-XX:ParallelcMSThreadsSet the number of threads for CMS.- The number of threads started by CMS by default is (ParallelGCThreads+3)/4, and ParallelGCThreads is the number of threads of the young generation parallel collector. When CPU resources are tight, the performance of the application during the garbage collection phase can be very poor due to the impact of the CMS collector threads.
13.6.4. Summary
HotSpot has so many garbage collectors, so if someone asks, what is the difference between the three Gcs, Serial GC, Parallel GC, and Concurrent Mark Sweep GC?
Remember the following passwords:
- If you want to minimize the use of memory and parallel overhead, please choose Serial GC; the corresponding Serial Old GC in the old age
- If you want to maximize the throughput of the application, please choose Parallel GC; the old generation corresponds to Parallel Old GC
- If you want to minimize GC interruption or pause time, please choose CMS GC; the old generation corresponds to ParNew GC
13.6.5. Changes to the CMS in subsequent JDK releases
New in JDK9: CMS is marked Deprecate as (JEP291)
-XX: +UseConcMarkSweepGCIf you use parameters to enable the CMS collector for HotSpot virtual machines of JDK9 and above , users will receive a warning message that CMS will be deprecated in the future.
New JDK14 feature: 删除 CMS Garbage Collector (JEP363)
- The CMS garbage collector has been removed. If it is
-XX:+UseConcMarkSweepGCused , the JVM will not report an error, but will only give a warning message, but will not exit. The JVM will automatically fall back to start the JVM in the default GC mode
13.7. The G1 Collector: Regionalized Generational
Since we already have the previous powerful GC, why release Garbage First (G1)?
The reason is that the application is dealing withThe business is getting bigger and more complex, with more and more users, Without GC, the normal progress of the application cannot be guaranteed, and the GC of STW often cannot keep up with the actual demand, so it is constantly trying to optimize the GC. The G1 (Garbage-First) garbage collector is a new garbage collector introduced after Java7 update4, and is one of the most cutting-edge achievements in the development of today's collector technology.
At the same time, in order to adapt to the presentEver-expanding memory and ever-increasing number of processors, further reducing the pause time (pause time), while taking into account good throughput.
The official goal set for G1 is to obtain the highest possible throughput while the delay is controllable, so it takes on the heavy responsibility and expectation of a "full-featured collector".
Why is it called Garbage First (G1)?
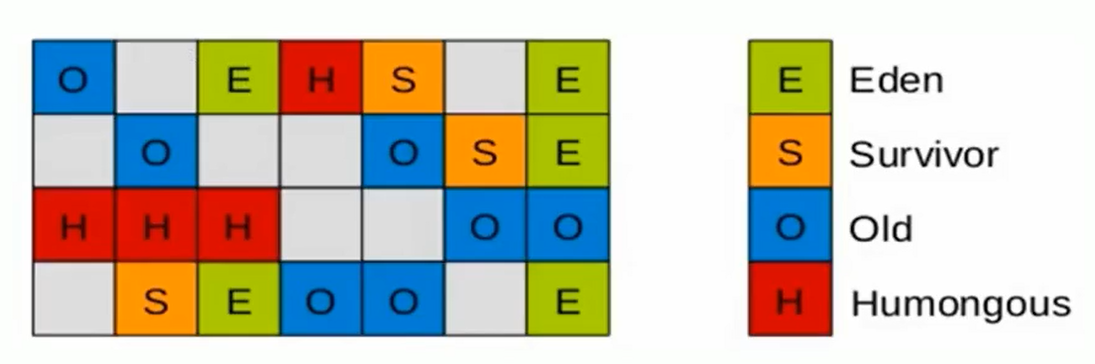
Because G1 is a parallel collector, it divides the heap memory into many irrelevant regions (Regions) (physically discontinuous). Use different Regions to represent Eden, Survivor 0, Survivor 1, Old Age, etc.
The G1 GC systematically avoids region-wide garbage collection on the entire Java heap. G1 tracks the value of garbage accumulation in each Region (the size of the space obtained by recycling and the experience value of the time required for recycling), and maintains a priority list in the background.Each time, according to the allowed collection time, the Region with the highest value will be recovered first。
Since this approach focuses on reclaiming the region with the largest amount of garbage (Region), we give G1 a name: Garbage First.
G1 (Garbage-First) is a garbage collector for server-side applications.Mainly for machines equipped with multi-core CPU and large capacity memory, while satisfying GC pause times with a high probability, while also having the performance characteristics of high throughput.
It was officially launched in JDK1.7 version, and the Experimenta1 logo was removed, which isThe default garbage collector since JDK9, replacing the CMS collector and the Parallel+Parallel Old combination. Officially referred to by Oracle as "full-featured garbage collector”。
Meanwhile, CMS has been marked as deprecated in JDK9. It is not the default garbage collector in jdk8 and needs to be enabled -XX:+UseG1GC.
13.7.1. Features (Advantages) of the G1 Collector
Compared with other GC collectors, G1 uses a new partitioning algorithm, and its characteristics are as follows:
Parallel and concurrent
- Parallelism: During G1 recycling, multiple GC threads can work simultaneously to effectively utilize multi-core computing capabilities. At this point the user thread STW
- Concurrency: G1 has the ability to execute alternately with the application, and part of the work can be executed at the same time as the application. Therefore, generally speaking, the application will not be completely blocked during the entire recycling phase.
Generational collection
- From a generational point of view,G1 is still a generational garbage collector, it will distinguish between the young generation and the old generation, and the young generation still has the Eden area and the Survivor area. But from the perspective of the heap structure, it does not require the entire Eden area, the young generation or the old generation to be continuous, and it no longer insists on a fixed size and a fixed number.
- WillThe heap space is divided into several regions (Regions), which contain the logical young generation and old generation。
- Unlike the previous types of collectors, it alsoTaking into account both the young generation and the old generation. Compared with other collectors, either work in the young generation or work in the old generation;
spatial integration
- CMS: "mark-clear" algorithm, memory fragmentation, defragmentation after several Gc
- G1 divides memory into regions. The recovery of memory is based on the region as the basic unit.Between Regions is the replication algorithm, but overall it can actually be seen asMark-Compact (Mark-Compact) algorithm, both algorithms can avoid memory fragmentation. This feature is conducive to the long-running of the program. When allocating large objects, the next GC will not be triggered in advance because no continuous memory space can be found. Especially when the Java heap is very large, the advantages of G1 are more obvious.
Predictable pause time model (ie: soft real-time)
This is another major advantage of G1 over CMS. In addition to pursuing low pauses, G1 can also establish a predictable pause time model, allowing users to clearly specify that within a time segment of M milliseconds, the time spent in garbage collection The time on must not exceed N milliseconds.
- Due to partitioning, G1 can only select some areas for memory recovery, which reduces the scope of recovery, so the occurrence of global pauses can also be better controlled.
- G1 tracks the value of garbage accumulation in each Region (the size of the space obtained by recycling and the experience value of the time required for recycling), and maintains a priority list in the background.Each time, according to the allowed collection time, the Region with the highest value will be recovered first. It ensures that the G1 collector can obtain the highest possible collection efficiency within a limited time.
- Compared with CMSGC, G1 may not be able to achieve the delay pause of CMS in the best case, but the worst case is much better.
13.7.2. Disadvantages of the G1 Garbage Collector
Compared with CMS, G1 does not have all-round and overwhelming advantages. For example, during the running of user programs, G1 is higher than CMS in terms of the memory usage (Footprint) generated by garbage collection and the additional execution load (Overload) when the program is running.
From experience, the performance of CMS in small-memory applications is likely to be better than G1, and G1 will play its advantages in large-memory applications. The balance point is between 6-8GB.
13.7.3. Parameter Settings of G1 Collector
-XX:+UseG1GC: Manually specify to use the G1 garbage collector to perform memory recovery tasks-XX:G1HeapRegionSizeSet the size of each Region. Values are powers of 2, ranging from 1MB to 32MB, targeting approximately 2048 regions based on the smallest Java heap size. The default is 1/2000 of the heap memory.-XX:MaxGCPauseMillisSet the desired maximum GC pause time metric (JVM will try to achieve it, but it is not guaranteed). The default value is 200ms (average human reaction speed)-XX:+ParallelGCThreadThe value of the number of GC threads when setting STW. The maximum setting is 8 (the thread calculation formula of Parallel recycler mentioned above, when CPU_Count > 8, ParallelGCThreads will also be greater than 8)-XX:ConcGCThreadsSets the number of threads for concurrent marking. Set n to about 1/4 of the number of parallel garbage collection threads (ParallelGCThreads).-XX:InitiatingHeapOccupancyPercentSets the Java heap occupancy threshold that triggers concurrent GC cycles. If this value is exceeded, GC is triggered. The default value is 45.
13.7.4. Common operation steps of G1 collector
The design principle of G1 is to simplify JVM performance tuning. Developers only need three simple steps to complete the tuning:
- Step 1: Turn on the G1 garbage collector
- Step 2: Set the maximum memory of the heap
- Step 3: Set the maximum pause time
G1 provides three garbage collection modes: Young GC, Mixed GC and Full GC, which are triggered under different conditions.
13.7.5. Applicable scenarios of G1 collector
1. For server-side applications, for machines with large memory and multi-processors. (not surprising performance on normal sized heaps)
2. The most important application is the needLow GC latency with a large heapThe application provides a solution; for example: when the heap size is about 6GB or larger, the predictable pause time can be lower than 0.5 seconds; (G1 only cleans up a part of the region instead of all the incremental cleanup at a time. Guaranteed Each GC pause time is not too long).
3. It is used to replace the CMS collector in JDK1.5; in the following cases, using G1 may be better than CMS:
- More than 50% of the Java heap is occupied by active data;
- Object allocation frequency or age promotion frequency varies greatly;
- GC pauses are too long (longer than 0.5 to 1 second)
4. In the HotSpot garbage collector, except for G1, other garbage collectors use the built-in JVM thread to perform multi-threaded operations of GC [the priority is relatively low], while G1 GC can use the background running GC work, that is, when the 应用线程JVM When the GC thread processing speed is slow, the system calls the application thread to help speed up the garbage collection process.
13.7.6. Partition Region: split into zero
When using the G1 collector, it divides the entire Java heap into about 2048 independent Region blocks of the same size. The size of each Region block depends on the actual size of the heap space, and the overall control is between 1MB and 32MB, and is 2 The Nth power of , namely 1MB, 2MB, 4MB, 8MB, 16MB, 32MB. Can be -XX:G1HeapRegionSizeset.All Regions have the same size and will not be changed during the JVM lifetime.
Although the concepts of the new generation and the old generation are still retained, the new generation and the old generation are no longer physically isolated. They are all part Region(not necessarily continuous) collections. Logical continuity is achieved through the dynamic allocation of Regions.
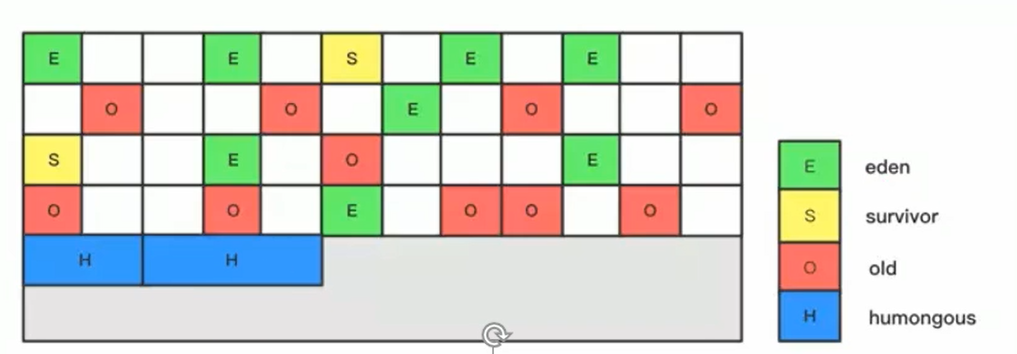
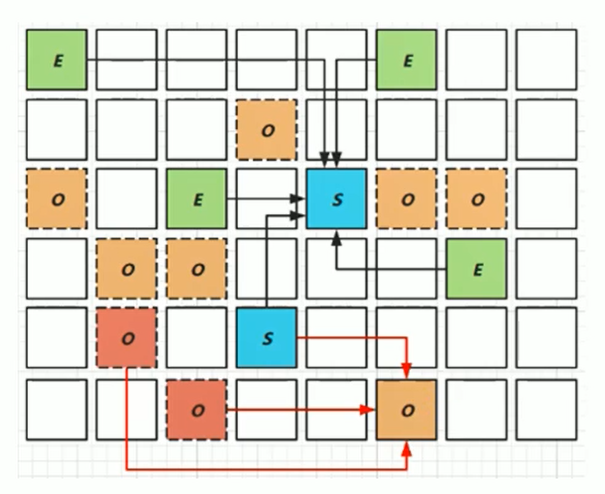
A region may belong to Eden, Survivor or Old/Tenured memory area. But a region can only belong to one role. E in the figure indicates that the region belongs to the Eden memory area, S indicates that it belongs to the survivor memory area, and O indicates that it belongs to the Old memory area. Blank spaces in the figure represent unused memory space.
The G1 garbage collector also adds a new memory area called the Humongous memory area, such as the H block in the figure. Mainly used to store large objects, 如果超过 1.5 个 region,就放到 H.
The reason for setting H: For objects in the heap, they will be directly allocated to the old generation by default, but if it is a short-lived large object, it will have a negative impact on the garbage collector. To solve this problem, G1 divides a Humongous area, which is used to store large objects.If one H area cannot hold a large object, then G1 will look for a continuous H area to store it.In order to find continuous H areas, sometimes Full GC has to be started. Most of the behavior of G1 treats the H area as part of the old generation.
Each Region allocates space through pointer collision
13.7.7. The recovery process of the G1 garbage collector 【Understand】
The garbage collection process of G1GC mainly includes the following three links:
- Young GC (Young GC)
- Old generation concurrent marking process (Concurrent Marking)
- Mixed recovery (Mixed GC)
The single-threaded, exclusive, high-intensity Full GC still exists if needed. It provides a failsafe against GC evaluation failures, brute force collections. Similar to a guarantee scheme of Serial Old GC for CMS
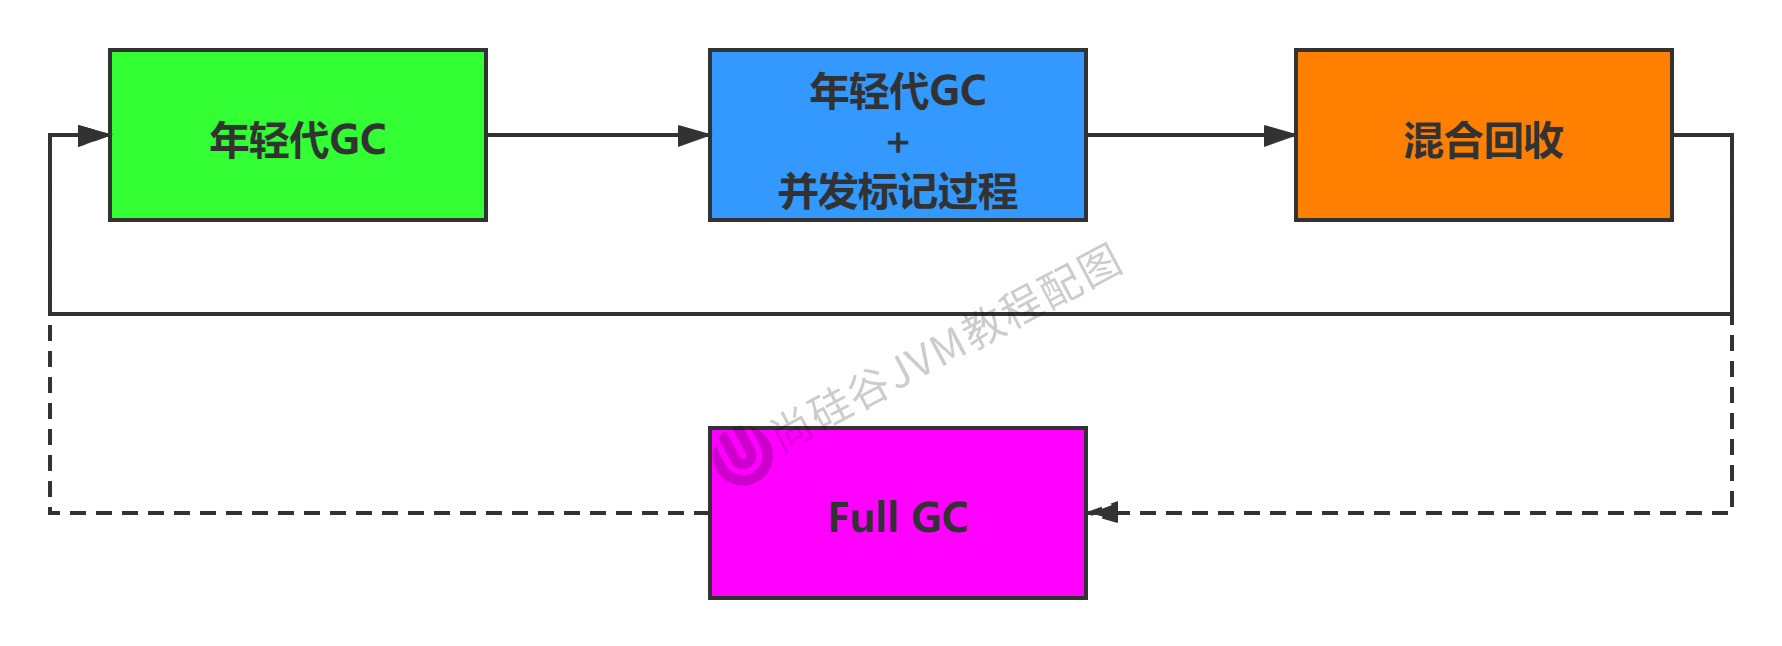
Clockwise, Young gc -> Young gc + Concurrent mark->Mixed GC order for garbage collection.
The application allocates memory,Start the young generation collection process when the young generation's Eden area is exhausted; The young generation collection phase of G1 is aparallel exclusive【STW】Collector. During the young generation collection period, G1GC suspends all application threads and starts multiple threads to perform young generation collection. ThenMoving surviving objects from the young generation interval to the Survivor interval or the old interval, or both intervals may involve。
When the heap memory usage reaches a certain value (45% by default), the concurrent marking process of the old generation starts.
Once the marking is complete, the mixed recovery process begins immediately. For a mixed collection period, the G1 GC moves live objects from the old generation to free regions, which then become part of the old generation. Unlike the young generation, the G1 collector of the old generation is different from other GCs,G1's old generation collector does not need the entire old generation to be recycled, it only needs to scan/recycle a small part of the old generation's Region at a time. At the same time, the old generation Region is recycled together with the young generation.
For example: a web server, the Java process has a maximum heap memory of 4G, responds to 1500 requests per minute, and allocates about 2G of memory every 45 seconds. G1 will recycle the young generation every 45 seconds, and the usage rate of the entire heap will reach 45% every 31 hours. It will start the concurrent marking process of the old generation, and start four to five mixed collections after the marking is completed.
13.7.8. Remembered Set
- The problem that an object is referenced by different regions
- A Region cannot be isolated. Objects in a Region may be referenced by objects in any other Region. When judging the survival of an object, does it need to scan the entire Java heap to ensure accuracy?
- In other generational collectors, this problem also exists (and G1 is more prominent)
- Recycling the new generation also has to scan the old generation at the same time? [Because the old generation may refer to some objects of the new generation]
- This will reduce the efficiency of MinorGC;
Solution:
Regardless of G1 or other generational collectors, JVM uses Remembered Set to avoid global scanning:
Each Region has a corresponding Remembered Set;
Every time the Reference type data is written, a Write Barrier will be generated to temporarily interrupt the operation;
Then check whether the object pointed to by the reference to be written is in a different Region from the Reference type data (other collectors: check whether the old generation object refers to the new generation object);
If they are different, record the relevant reference information into the Remembered Set corresponding to the Region where the reference points to the object through CardTable;
When performing garbage collection, add the Remembered Set to the enumeration range of the GC root node; it can ensure that no global scanning is performed and there will be no omissions.

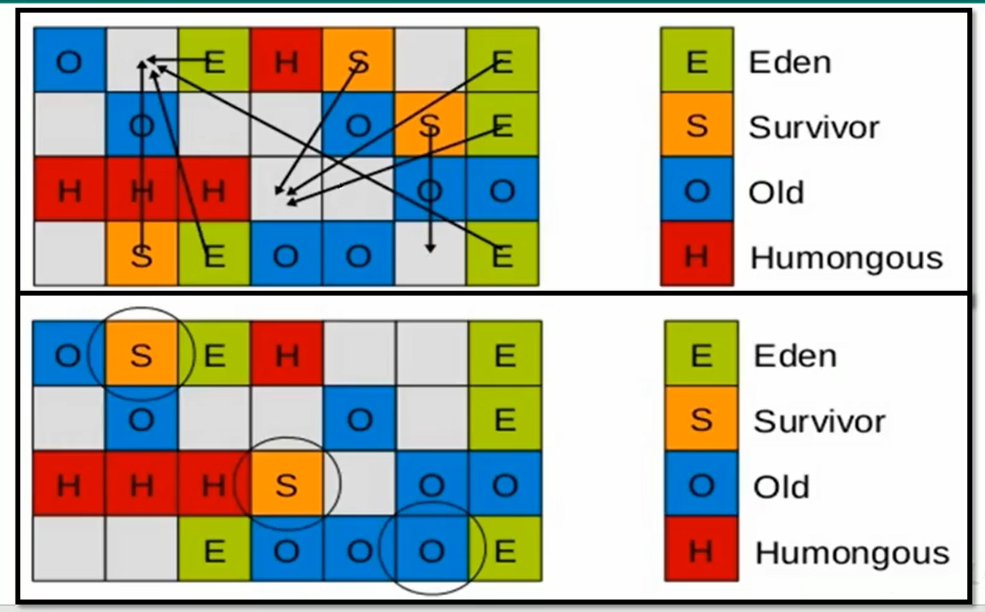
13.7.9. G1 Collection Process 1: Young Generation GC
When the JVM starts, G1 prepares the Eden area first, and the program continuously creates objects to the Eden area during the running process.When the Eden space is exhausted, G1 will start a young generation garbage collection process。
Young generation garbage collection will only reclaim the Eden area and the Survivor area.
First, G1 stops the execution of the application program (Stop-The-World). G1 creates a collection set (Collection Set). The collection set refers to the collection of memory segments that need to be reclaimed. The collection set of the young generation recovery process includes the young generation Eden area and all memory segments in the Survivor area.
Then start the recycling process as follows:
-
The first stage, scanning the root. The root refers to the object pointed to by the static variable, the local variable on the method call chain being executed, and so on. The root reference together with the external references recorded by the RSet serve as the entry point for scanning live objects.
Note: The young generation must have Rset, and the young generation is recycled too frequently. Rset is not applicable, and it is too inefficient to judge whether there is a reference to the new generation in the old generation every time. Conversely, recycling in the old generation is unnecessary, because when the old generation recycles, the new generation will also recycle.
-
The second stage, update RSet. Process the cards in the dirty card queue (see remarks) and update the RSet. After this phase is complete,RSet can accurately reflect the references of the old generation to the objects in the memory segment where it is located。
-
The third stage, processing RSet. Identify objects in Eden that are pointed to by objects in the old generation. These objects in Eden that are pointed to are considered to be surviving objects.
-
The fourth stage, copying objects. At this stage, the object tree is traversed, and the surviving objects in the memory segment of the Eden area will be copied to the empty memory segment in the Survivor area. If the age of the surviving objects in the memory segment of the Survivor area does not reach the threshold, the age will be increased by 1 to reach the threshold It will be copied to the empty memory segment in the Old area. If the Survivor space is not enough, part of the data in the Eden space will be directly promoted to the old generation space.
-
The fifth stage, processing references. Handles Soft, Weak, Phantom, Final, JNI Weak, etc. references. In the end, the data in the Eden space is empty, the GC stops working, and the objects in the target memory are stored continuously without fragmentation, so the copy process can achieve the effect of memory defragmentation and reduce fragmentation.
13.7.10. G1 recycling process 2: concurrent marking process
- initial marking phase: Marks objects that are directly reachable from the root node. This phase is STW and triggers a young generation GC.
- Root Region Scanning: G1 GC scans the objects in the old area that are directly reachable in the Survivor area, and marks the referenced objects. This process must be done before YoungGC.
- Concurrent Marking: Concurrent marking of the entire heap (and concurrent execution of the application), which may be interrupted by YoungGC. During the concurrent marking phase,If all objects in the region object are found to be garbage, the region will be reclaimed immediately. At the same time, during the concurrent marking process, the object liveness (proportion of surviving objects in the region) is calculated for each region.
- Remark: Due to the continuous progress of the application, the last marking result needs to be corrected. It is STW. G1 adopts an initial snapshot algorithm faster than CMS: snapshot-at-the-beginning (SATB).
- Exclusive cleanup (cleanup, STW): Calculate the proportion of surviving objects and GC recovery in each area, and sort them to identify areas that can be mixed and recovered. Pave the way for the next stage. It is STW. This phase does not actually do garbage collection
- concurrent cleanup phase: Identify and clean up completely free areas.
13.7.11. G1 Recycling Process 3: Mixed Recycling
When more and more objects are promoted to the old generation o1d region, in order to avoid the exhaustion of heap memory, the virtual machine triggers a mixed garbage collector, that is, Mixed GC. This algorithm is not an Old GC, except for reclaiming the entire Young Region , and part of the Old Region will be recovered. Note here:Part of the old generation, not all of the old generation. You can choose which Old Regions to collect, so that you can control the time spent on garbage collection. Also note that Mixed GC is not Full GC.
After the concurrent marking ends, the memory segments that are 100% garbage in the old generation are reclaimed, and the memory segments that are partially garbage are calculated. By default, these memory segments in the old age will be recycled 8 times (can be -XX:G1MixedGCCountTargetset)
The collection set of mixed recovery includes one-eighth of the memory segments of the old age, the memory segments of the Eden area, and the memory segments of the Survivor area. The mixed recycling algorithm is exactly the same as the young generation recycling algorithm, except that the old generation memory segments are added to the recycling collection. For details, please refer to the Young Generation Recycling Process above.
Since the memory segments in the old generation are recycled 8 times by default, G1 will give priority to recycling the memory segments with more garbage. The higher the ratio of garbage to the memory segment, the more it will be recycled first. And there is a threshold that will determine whether the memory segment is reclaimed, -XX:G1MixedGCLiveThresholdPercent, the default is 65%, which means that the garbage will be reclaimed only when the proportion of garbage in the memory segment reaches 65%. If the proportion of garbage is too low, it means that the proportion of surviving objects is high, and it will take more time to copy.
Mixed recovery does not have to be done 8 times. There is a threshold -XX:G1HeapWastePercent, the default value is 10%, which means that 10% of the entire heap memory is allowed to be wasted, which means that if it is found that the proportion of garbage that can be recycled accounts for less than 10% of the heap memory, no mixed collection will be performed. Because GC will spend a lot of time but the memory recovered is very little.
13.7.12. G1 recovery optional process four: Full GC
The original intention of G1 is to avoid the occurrence of Full GC. However, if the above method does not work properly, G1 will stop the execution of the application (Stop-The-World), and use a single-threaded memory recovery algorithm for garbage collection. The performance will be very poor, and the application pause time will be very long.
To avoid the occurrence of Full GC, it needs to be adjusted once it occurs. When will Full GC happen? for exampleheap memory too small, when G1 has no empty memory segments available when copying surviving objects, it will fall back to Full GC. This situation can be solved by increasing the memory.
There may be two reasons for G1 Full GC:
- During Evacuation, there is not enough to-space to store promoted objects;
- Space was exhausted before concurrent processing was complete.
Replenish:
From the official information disclosed by Oracle, it can be known that the recovery stage (Evacuation) was actually designed to be executed concurrently with the user program, but this is more complicated to do. Considering that G1 only returns a part of the Region, the pause time is determined by the user. controllable, so there is no urgency to achieve it, andChoose to put this feature into the low-latency garbage collector (ie ZGC) that came after G1. In addition, considering that G1 is not only for low latency, pausing user threads can greatly improve the efficiency of garbage collection, in order to ensure throughput, the implementation of completely pausing user threads was chosen.
13.7.13. G1 Collector Optimization Recommendations
young generation size
- Avoid explicitly setting the young generation size with related options such as
-Xmnor-XX:NewRatio - Fixed young generation size overrides pause time goal
Don’t be too strict about your pause time goals
- The throughput target for G1 GC is 90% application time and 10% garbage collection time
- When evaluating the throughput of the G1 GC, the pause time goal should not be too stringent. Goals that are too strict mean that you are willing to incur more garbage collection overhead, which directly impacts throughput.
13.8. Garbage Collector Summary
13.8.1. Summary of 7 Classic Garbage Collectors
As of JDK1.8, there are 7 different garbage collectors. Each type of garbage collector has different characteristics. When using it, you need to choose a different garbage collector according to the specific situation.
| garbage collector | Classification | Action position | use algorithm | features | Applicable scene |
|---|---|---|---|---|---|
| Serial | serial run | Act on the new generation | copy algorithm | Response speed priority | Client mode suitable for single CPU environment |
| ParNew | run in parallel | Act on the new generation | copy algorithm | Response speed priority | Use with CMS in multi-CPU environment Server mode |
| Parallel | run in parallel | Act on the new generation | copy algorithm | Throughput priority | Suitable for background operations without much interaction |
| Serial Old | serial run | acting on the old generation | mark-compression algorithm | Response speed priority | Client mode suitable for single CPU environment |
| Parallel Old | run in parallel | acting on the old generation | mark-compression algorithm | Throughput priority | Suitable for background operations without much interaction |
| CMS | run concurrently | acting on the old generation | mark-sweep algorithm | Response speed priority | Applicable to Internet or B/S business |
| G1 | run concurrently | Acting on the new generation and the old generation | Mark-compression algorithm [Overall], Replication algorithm [Regin] | Response speed priority | For server-side applications |
GC development stage: Serial => Parallel (parallel) => CMS (concurrent) => G1 => ZGC
13.8.2. Garbage collector pooling
Different manufacturers and different versions of virtual machines have a relatively large gap in implementation. All collectors and combinations of HotSpot virtual machine after JDK7/8 are as follows: (updated to JDK14)
-
There is a connection between the two collectors, indicating that they can be used together: Serial/Serial Old, Serial/CMS, ParNew/Serial Old, ParNew/CMS, Parallel Scavenge/Serial Old, Parallel Scavenge/Parallel Old, G1;
-
Among them, Serial Old is
Concurrent Mode Failurethe backup plan for ""failure" in CMS. -
(Red dotted line) Due to the cost of maintenance and compatibility testing, the two combinations of Serial + CMS and ParNew + Serial old were declared as Deprecated (JEP 173) in JDK 8, and in JDK 9
Support for these combinations was completely removed (JEP214), ie: removed.
-
(Green dotted line) In JDK 14: Deprecation of ParallelScavenge and SeriaOold GC combination (JEP 366)
-
(Green dotted box) In JDK 14: Remove CMS Garbage Collector (JEP 363)
13.8.3. How to choose a garbage collector
The configuration of the Java garbage collector is a very important choice for JVM optimization. Choosing an appropriate garbage collector can greatly improve the performance of the JVM.
How to choose a garbage collector?
-
Prioritize adjusting the size of the heap and let the JVM adapt to it.
-
If the memory is less than 100M, use the serial collector
-
If it is a single-core, stand-alone program, and there is no pause time requirement, the serial collector
-
If it is multi-CPU, high throughput is required, and the pause time is allowed to exceed 1 second, choose parallelism or JVM's own choice
-
If it is multi-CPU, pursues low pause time, and needs fast response (for example, the delay cannot exceed 1 second, such as Internet applications), use a concurrent collector
The official recommendation is G1, which has high performance.Now Internet projects basically use G1。
Finally, one point needs to be clarified:
- There is no best collector, let alone a universal collector
- Tuning is always for specific scenarios and specific needs, there is no one-and-done collector
interview
For garbage collection, the interviewer can step by step from various angles of theory and practice, and it does not necessarily require the interviewer to understand everything. But if you understand the principle, it will definitely become a bonus item in the interview. The more general and basic parts here are as follows:
-
What are the algorithms for garbage collection? How to judge whether an object can be recycled?
-
The basic flow of garbage collector work.
In addition, you need to pay more attention to the various commonly used parameters in this chapter of the garbage collector
13.9. GC log analysis
13.9.1 Parameter setting
By reading the GC log, we can understand the memory allocation and recovery strategy of the Java virtual machine. List of parameters for memory allocation and garbage collection
-XX:+PrintGCOutput GC log. similar:-verbose:gc-XX:+PrintGCDetailsOutput GC verbose log-XX:+PrintGCTimestampsOutput the timestamp of the GC (in the form of base time)-XX:+PrintGCDatestampsOutput the timestamp of GcC (in the form of date, such as 2013-05-04T21:53:59.234+0800)-XX:+PrintHeapAtGCPrint out heap information before and after GC-Xloggc:../logs/gc.logThe output path of the log file
① -verbose:gc
This will only show the total GC heap changes, as follows:
[GC (Allocation Failure) 80832K->19298K(228840K),0.0084018 secs]
[GC (Metadata GC Threshold) 109499K->21465K(228352K),0.0184066 secs]
[Full GC (Metadata GC Threshold) 21465K->16716K(201728K),0.0619261 secs]
Parameter analysis
GC、Full GC:GC的类型。GC只在新生代上进行,Full GC包括永生代,新生代,老年代。
Allocation Failure:GC发生的原因。
80832K->19298K:堆在GC前的大小和GC后的大小。
228840k:现在的堆大小。
0.0084018 secs:GC持续的时间。
② -verbose:gc -XX:+PrintGCDetails
Enter the information as follows
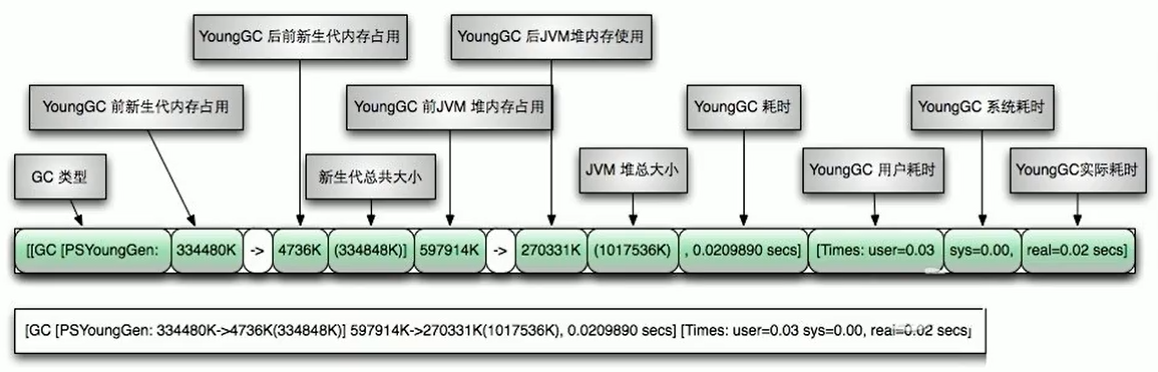
[GC (Allocation Failure) [PSYoungGen:70640K->10116K(141312K)] 80541K->20017K(227328K),0.0172573 secs] [Times:user=0.03 sys=0.00,real=0.02 secs]
[GC (Metadata GC Threshold) [PSYoungGen:98859K->8154K(142336K)] 108760K->21261K(228352K),0.0151573 secs] [Times:user=0.00 sys=0.01,real=0.02 secs]
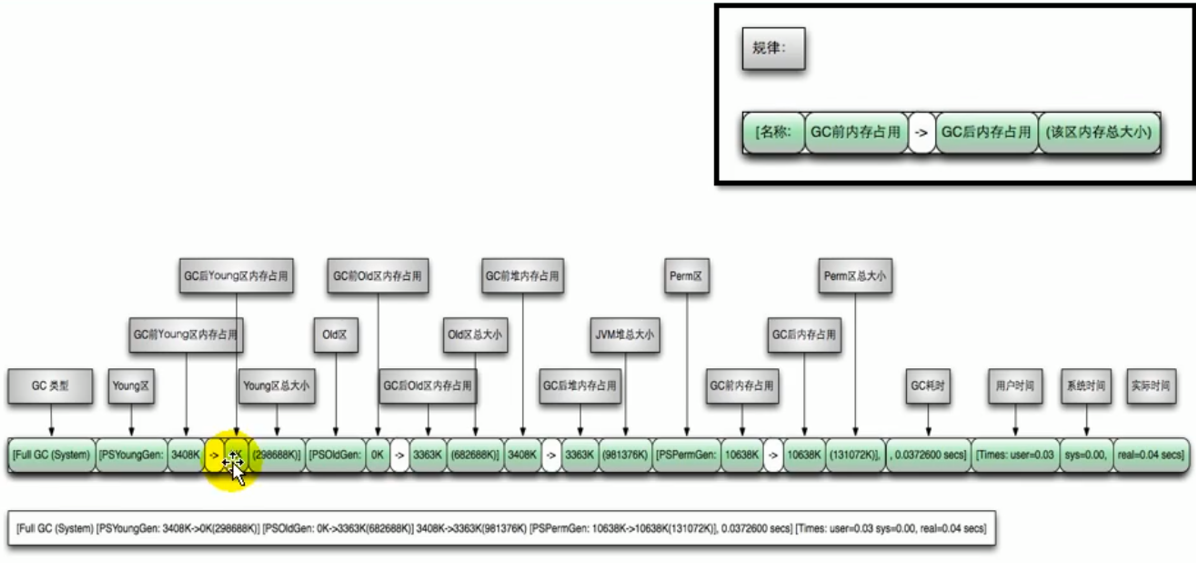
[Full GC (Metadata GC Threshold)[PSYoungGen:8154K->0K(142336K)]
[ParOldGen:13107K->16809K(62464K)] 21261K->16809K(204800K),[Metaspace:20599K->20599K(1067008K)],0.0639732 secs]
[Times:user=0.14 sys=0.00,real=0.06 secs]
Parameter analysis
GC,Full FC:同样是GC的类型
Allocation Failure:GC原因
PSYoungGen:使用了Parallel Scavenge并行垃圾收集器的新生代GC前后大小的变化
ParOldGen:使用了Parallel Old并行垃圾收集器的老年代GC前后大小的变化
Metaspace: 元数据区GC前后大小的变化,JDK1.8中引入了元数据区以替代永久代
xxx secs:指GC花费的时间
Times:user:指的是垃圾收集器花费的所有CPU时间,sys:花费在等待系统调用或系统事件的时间,real:GC从开始到结束的时间,包括其他进程占用时间片的实际时间。
③ -verbose:gc -XX:+PrintGCDetails -XX:+PrintGCTimestamps -XX:+PrintGCDatestamps
Enter the information as follows
2019-09-24T22:15:24.518+0800: 3.287: [GC (Allocation Failure) [PSYoungGen:136162K->5113K(136192K)] 141425K->17632K(222208K),0.0248249 secs] [Times:user=0.05 sys=0.00,real=0.03 secs]

2019-09-24T22:15:25.559+0800: 4.329: [GC (Metadata GC Threshold) [PSYoungGen:97578K->10068K(274944K)] 110096K->22658K(360960K),0.0094071 secs] [Times: user=0.00 sys=0.00,real=0.01 secs]

2019-09-24T22:15:25.569+0800: 4.338: [Full GC (Metadata GC Threshold) [PSYoungGen:10068K->0K(274944K)][ParoldGen:12590K->13564K(56320K)] 22658K->13564K(331264K),[Metaspace:20590K->20590K(1067008K)],0.0494875 secs] [Times: user=0.17 sys=0.02,real=0.05 secs]
Instructions: Bring Dates and Practice
If you want to save the GC log to a file, it is the following parameters:
-Xloggc:/path/to/gc.log
Supplementary notes to the log
-
"
[GC" and "[Full GC"indicate the pause type of this garbage collection. If there is "Full", it means that "Stop The World" occurred in GC -
The name of the new generation using the Serial collector is Default New Generation, so the display is "
[DefNew" -
Using the ParNew collector, the name of the new generation will become "
[ParNew", meaning "Parallel New Generation" -
The name of the new generation using the Parallel scavenge collector is "
[PSYoungGen" -
The collection of the old generation is the same as that of the new generation, and the name is also determined by the collector
-
If the G1 collector is used, it will be displayed as "garbage-first heap"
-
Allocation FailureIt indicates that the cause of GC this time is because there is not enough space in the young generation to store new data.
-
[PSYoungGen:5986K->696K(8704K) ] 5986K->704K(9216K)
In square brackets: size of young generation before GC recovery, size after recovery, (total size of young generation)
Outside the brackets: the size of the young generation and the old generation before GC recovery, the size after recovery, (the total size of the young generation and the old generation)
-
user represents the time-consuming recovery in user mode, the time-consuming recovery in sys kernel mode, and the actual time-consuming in rea. Due to multi-core, the sum of time may exceed real time
Heap(堆)
PSYoungGen(Parallel Scavenge收集器新生代)total 9216K,used 6234K [0x00000000ff600000,0x0000000100000000,0x0000000100000000)
eden space(堆中的Eden区默认占比是8)8192K,768 used [0x00000000ff600000,0x00000000ffc16b08,0x00000000ffe00000)
from space(堆中的Survivor,这里是From Survivor区默认占比是1)1024K, 0% used [0x00000000fff00000,0x00000000fff00000,0x0000000100000000)
to space(堆中的Survivor,这里是to Survivor区默认占比是1,需要先了解一下堆的分配策略)1024K, 0% used [0x00000000ffe00000,0x00000000ffe00000,0x00000000fff00000)

ParOldGen(老年代总大小和使用大小)total 10240K, used 7001K [0x00000000fec00000,0x00000000ff600000,0x00000000ff600000)
object space(显示个使用百分比)10240K,688 used [0x00000000fec00000,0x00000000ff2d6630,0x00000000ff600000)

PSPermGen(永久代总大小和使用大小)total 21504K, used 4949K [0x00000000f9a00000,0x00000000faf00000,0x00000000fec00000)
object space(显示个使用百分比,自己能算出来)21504K, 238 used [0x00000000f9a00000,0x00000000f9ed55e0,0x00000000faf00000)
13.9.2 Minor GC log diagram
13.9.3 Full GC log diagram
13.9.4 Use of log analysis tools
In production development, we can also use some tools to analyze these GC logs
Common log analysis tools include: GCViewer , GCEasy , GCHisto, GCLogViewer, Hpjmeter, garbagecat, etc.
You only need to add it to the JVM parameter -Xloggc:./logs/gc.log, and some logs of the console will be output to the log
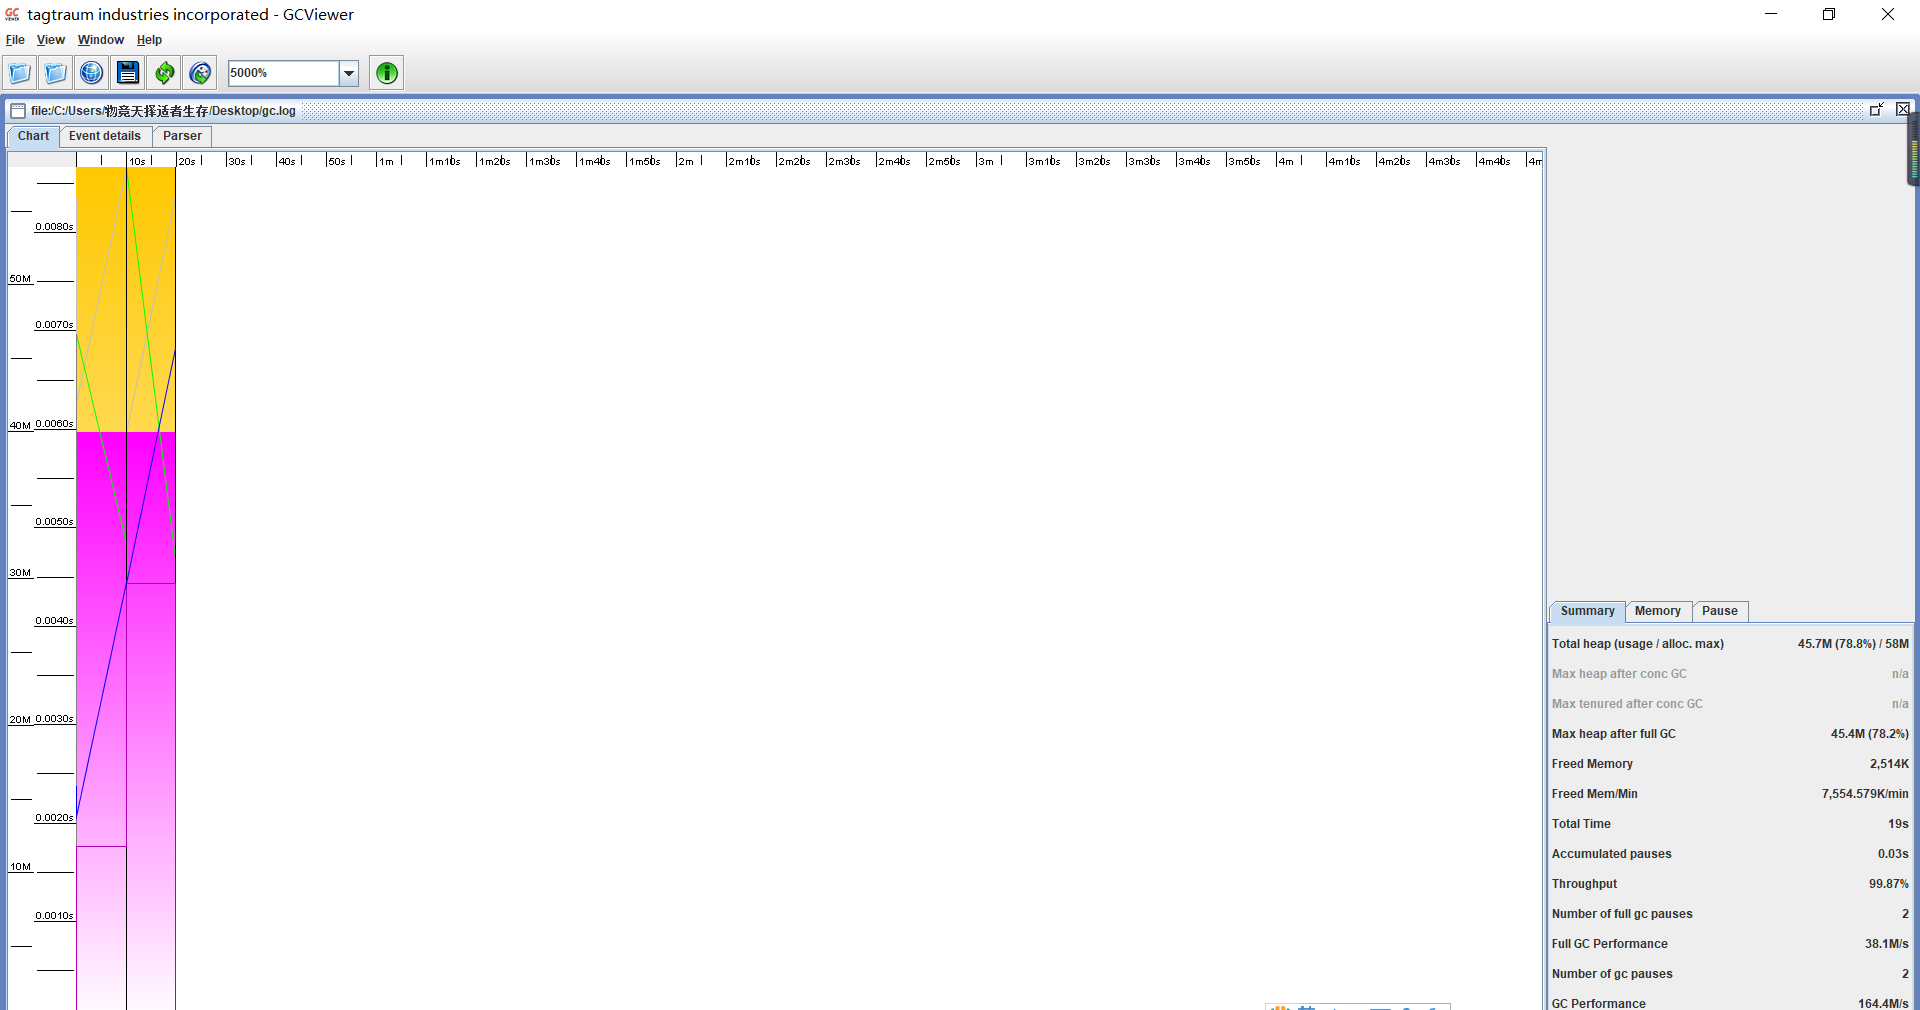
- GCViewer interface
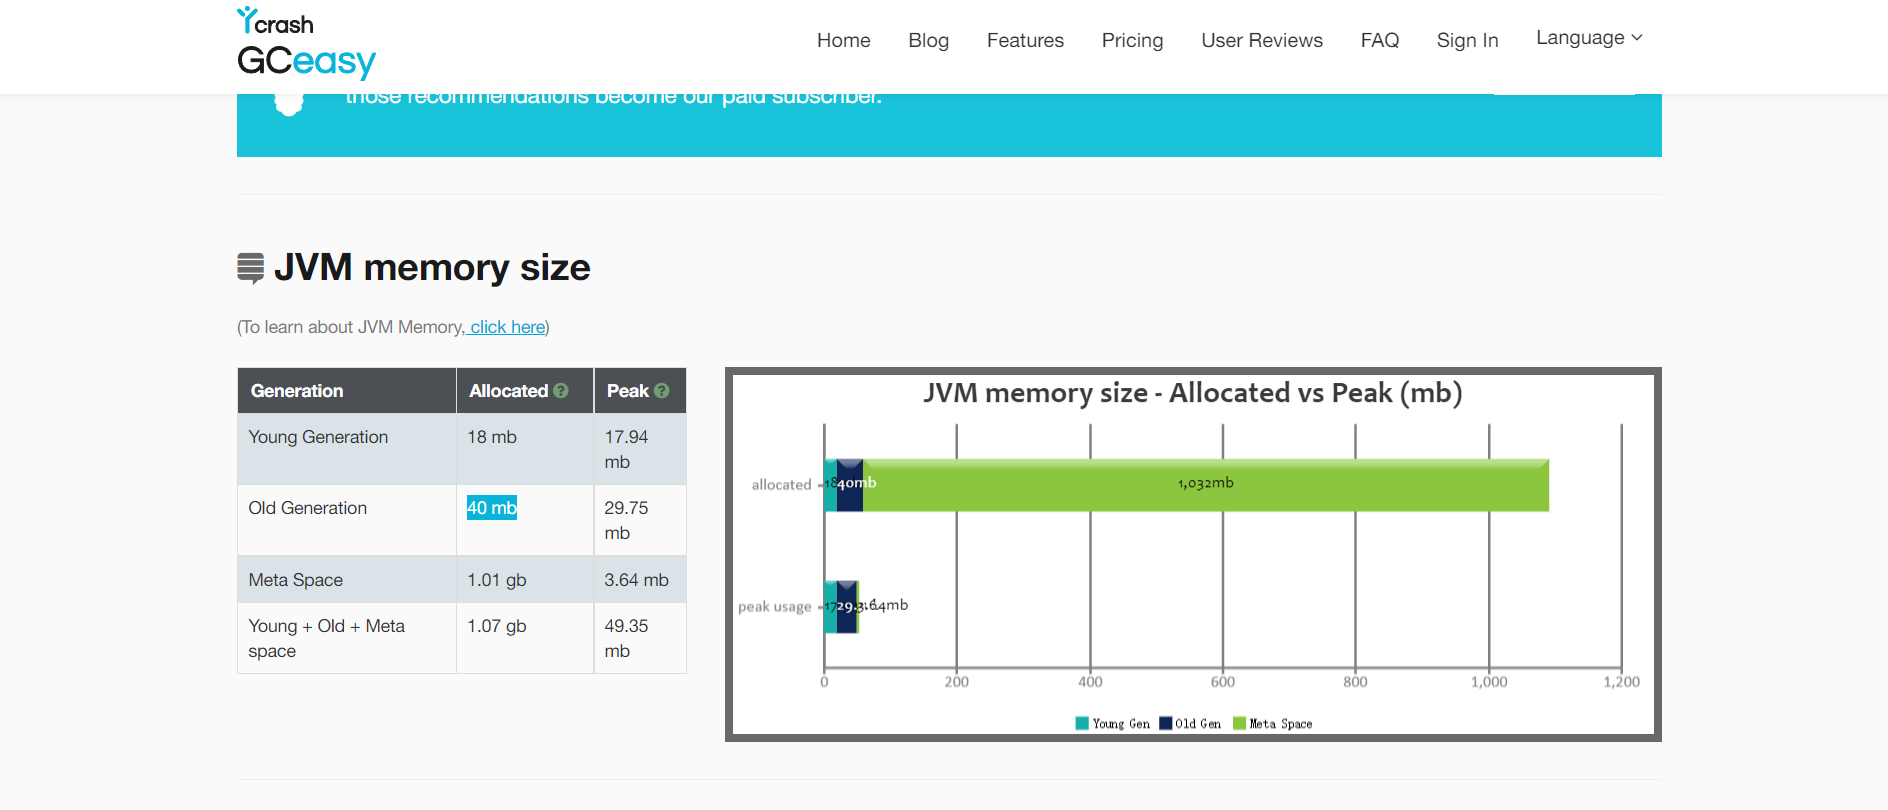
- GCEasy:☆☆☆☆☆

13.X. New Developments in the Garbage Collector
GC is still a work in progress and the current default optionG1 GC is constantly improving, many of the shortcomings we originally thought, such as serial Fu11GC, inefficiency of Card Table scanning, etc., have been greatly improved. For example, after JDK10, Fu11GC is already running in parallel. In many scenarios, its performance is slightly better than A parallel Ful1GC implementation of ParallelGC.
Even though Serial GC is relatively old, its simple design and implementation are not necessarily obsolete. Its own overhead, whether it is the overhead of GC-related data structures or the overhead of threads, is very small, so as cloud computing the rise ofIn new application scenarios such as Serverless, Serial GC has found a new stage。
Unfortunately, CMSGC has been marked as obsolete in JDK9 and removed in JDK14 because of the theoretical defects of its algorithm and other reasons. Although there is still a very large user group
13.X.1. JDK11 new features
Epsilon: A No-Op GarbageCollector (Epsilon garbage collector, "No-Op (no operation)" collector) http://openidk.iava.net/jeps/318
ZGC: A Scalable Low-Latency Garbage Collector (Experimental) (ZGC: Scalable Low-Latency Garbage Collector, in the experimental stage) http://openidk.iava.net/jeps/333
The G1 collector has been the default collector for several years now.
We also saw the introduction of two new collectors: ZGC (JDK11) and Shenandoah (Open JDK12). Main feature: low pause time

13.X.2. Shenandoash GC for Open JDK12
Shenandoash GC for Open JDK12: GC with low pause times (experimental)
Shenandoah is undoubtedly the loneliest of many GCs.It is the first Hotspot garbage collector not led by the Oracle team. inevitableostracized by the official. For example, Oracle, which claims that there is no difference between OpenJDK and OracleJDK, still refuses to support Shenandoah in OracleJDK12.
The Shenandoah garbage collector was originally implemented by Pauseless GC, a garbage collector research project conducted by RedHat.Aims at low-pause requirements for memory reclamation on the JVM.. Contributed to OpenJDK in 2014.
The Red Hat R&D Shenandoah team announced that,The pause time of the Shenandoah garbage collector is independent of the heap size, which means that whether the heap is set to 200MB or 200GB, 99.9% of the goals can limit the pause time of garbage collection to less than ten milliseconds.However, actual usage performance will depend on the actual working heap size and workload.
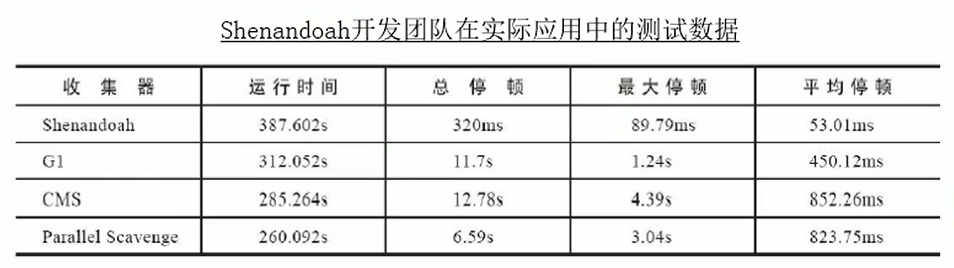
This is the paper data published by RedHat in 2016. The test content is to use Es to index 200GB of Wikipedia data. From the results:
- The pause time has indeed made a qualitative leap compared to several other collectors, but it has not achieved the goal of controlling the maximum pause time within ten milliseconds.
- There was a noticeable drop in throughput, and the total run time was the longest of all test collectors.
Summarize
- Weaknesses of Shenandoah GC: Throughput drops under high load.
- Shenandoah GC's strong point: low latency.
- The working process of Shenandoah GC is roughly divided into nine stages, so I won't go into details here. It was introduced in the previous Java12 new features video.
[Java12 new feature address]
http://www.atguigu.com/download_detail.shtml?v=222
or
https://www.bilibili.com/video/BV1jJ411M7kQ?from=search&seid=12339069673726242866
13.X.3. The Shocking, Revolutionary ZGC
Official address: https://docs.oracle.com/en/java/javase/12/gctuning/
ZGC is highly similar to the Shenandoah target,Under the premise that the impact on throughput is as small as possible, the low latency of garbage collection can be limited to less than ten milliseconds under any heap memory size.
ZGC is defined in the book "In-depth Understanding of Java Virtual Machine" as follows: ZGC collector is based on Region memory layout, (temporarily) without generation, and uses technologies such as read barriers, colored pointers, and memory multiple mapping to achieveConcurrent Mark-Compress AlgorithmofLow latency is the primary goalA garbage collector for .
The working process of ZGC can be divided into 4 stages:concurrent marking - concurrent preparatory reallocation - concurrent reallocation - concurrent remappingwait.
ZGC is executed concurrently almost everywhere except STw's initial marking. So the pause time is almost spent on the initial marking, the actual time of this part is very little.
Test Data:
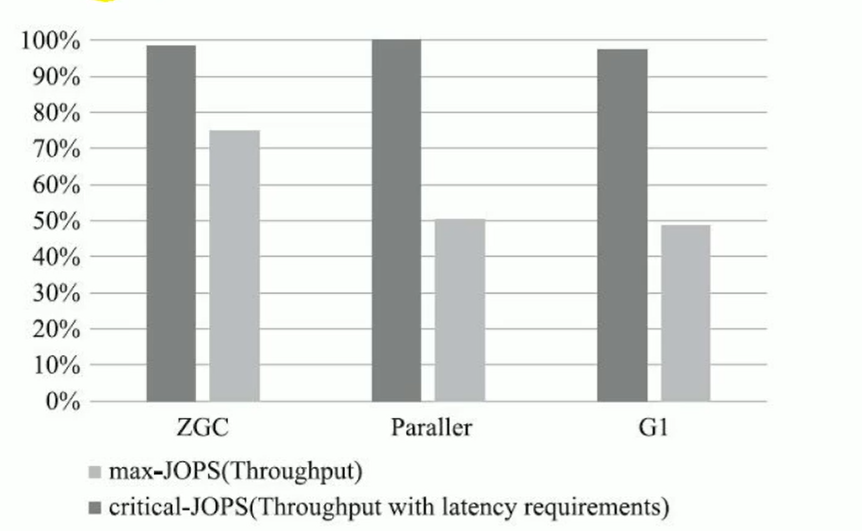

In ZGC's strong pause time test, it mercilessly opened the gap between Parallel and G1 by two orders of magnitude. Regardless of the average pause, 95% pause, 99% pause, 99.9% pause, or the maximum pause time, ZGC can effortlessly control it within 10 milliseconds.
Although ZGC is still in the experimental state and has not completed all the features, the performance is already quite impressive at this time, and it is not an exaggeration to describe it as "shocking and revolutionary".It will be the preferred garbage collector for server-side, large-memory, and low-latency applications in the future.
JEP 364: ZGC application on macos
JEP 365: ZGC implementation on Windows
Before JDK14, ZGC was only supported on Linux.
While many users of zGc use a Linux-like environment, people also need ZGC for development deployment and testing on Windows and macos. Many desktop applications can also benefit from ZGC. Therefore, the ZGC feature was ported to Windows and macos.
Now zGC can also be used on mac or Windows, examples are as follows:-XX:+UnlockExperimentalVMOptions -XX:+UseZGC
13.X.4. Other Garbage Collectors: AliGC
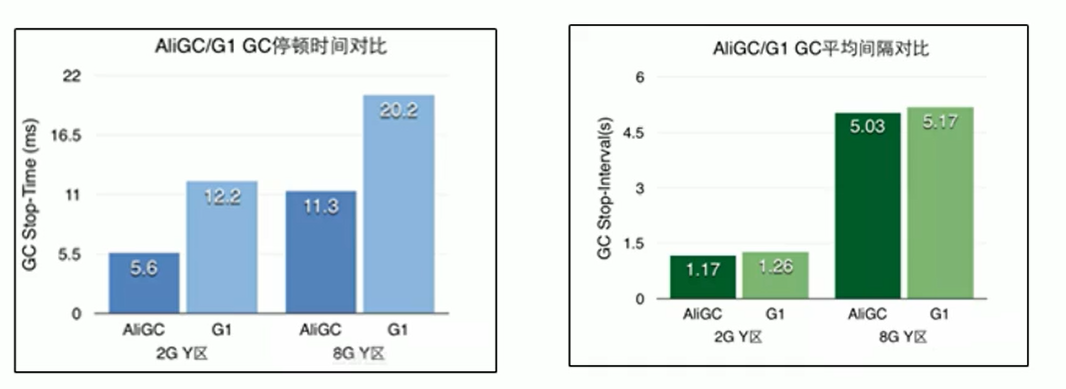
AliGC is based on the G1 algorithm of the Alibaba JVM team and is oriented to large heap (LargeHeap) application scenarios. Contrast in the specified scene:
Of course, other vendors also provide a variety of unique GC implementations, such as the well-known low-latency GC: Zing. If you are interested, you can refer to the provided link https://www.infoq.com/articles/azul_gc_in_detail