Table of contents
XX option and value of print setting
Heap, stack, method area and other memory size settings
Garbage collector related options
Get JVM parameters through Java code
XX option and value of print setting
JVM default settings or XX options manually set by the user when the program is running
-XX:+PrintCommandLineFlags Print the default values of all XX options
-XX:+PrintFlagsInitialprint the actual value of all XX options
-XX:+PrintFlagsFinalPrint the parameters of the JVM
-XX:+PrintVMOptions Heap, stack, method area and other memory size settings
Stack
-Xss128k <==> -XX:ThreadStackSize=128k Set the thread stack size to 128K
Heap
-Xms2048m <==> -XX:InitialHeapSize=2048m Set the JVM initial heap memory to 2048M
-Xmx2048m <==> -XX:MaxHeapSize=2048m Set the JVM maximum heap memory to 2048M
-Xmn2g <==> -XX:NewSize= 2g -XX:MaxNewSize=2g Set the size of the young generation to 2G
-XX:SurvivorRatio=8 Set the ratio of the Eden area to the Survivor area, the default is 8
-XX:NewRatio=2 Set the ratio of the old generation to the young generation, the default is 2
- XX:+UseAdaptiveSizePolicy is used to set the adaptive size ratio, which is enabled by default.
-XX:PretenureSizeThreadshold=1024 is set to allow objects larger than this threshold to be directly allocated to the old generation. It is only valid for Serial and ParNew collectors.
-XX:MaxTenuringThreshold=15 is set to promote the new generation to the old The age limit of the era, the default is 15
-XX:TargetSurvivorRatio sets the expected proportion of the space occupied by the Survivor area after the MinorGC ends
Method area
-XX:MetaspaceSize / -XX:PermSize=256m Set the initial value of metaspace/permanent generation to 256M
-XX:MaxMetaspaceSize / -XX:MaxPermSize=256m Set the maximum value of metaspace/permanent generation to 256M
-XX:+ UseCompressedOops Compressed objects
-XX:+UseCompressedClassPointers Use compressed class pointers
- XX:CompressedClassSpaceSize Set the size of Klass Metaspace, the default is 1G
Direct memory
-XX:MaxDirectMemorySize specifies the capacity of DirectMemory, which is equal to the maximum value of the Java heap by default
OutOfMemory related options
Generate a Heap dump file when OOM occurs in the memory, and the two are mutually exclusive
-XX:+HeapDumpOnOutMemoryError Generate a Heap dump file when FullGC occurs, and the two are mutually exclusive
-XX:+HeapDumpBeforeFullGC Specify the storage path of the heap dump file, the default current directory
-XX:HeapDumpPath=<path> Specify the path of a feasible program or script, and execute the script when OOM occurs
-XX:OnOutOfMemoryError=<path>Garbage collector related options
First of all, you need to understand the collocation relationship between garbage collectors
- The red dotted line indicates that it is deprecated in jdk8 and deleted in jdk9
- The green dotted line indicates that it is deprecated in jdk14
- The green dashed box indicates that it is deprecated in jdk9 and deleted in jdk14

The serial collector
uses Serial GC in the young generation, and uses Serial Old GC+ in the old generation
-XX:+UseSerialGC ParNew collector
young generation uses ParNew GC
-XX:+UseParNewGCSets the number of threads for the young generation parallel collector.
-XX:ParallelGCThreadsIn general, it is best to be equal to the number of CPUs to avoid excessive number of threads affecting garbage collection performance.
The young generation of the Parallel collector
uses Parallel Scavenge GC to activate each other
-XX:+UseParallelGC The old generation uses Parallel Old GC to activate each other
-XX:+UseParallelOldGC Set the maximum pause time of the garbage collector (that is, the STW time), in milliseconds.
-XX:MaxGCPauseMillis In order to control the pause time within MaxGCPauseMills as much as possible, the collector will adjust the Java heap size or some other parameters when working.
For users, the shorter the pause time, the better the experience; but the server side pays attention to high concurrency and overall throughput.
So the server side is suitable for Parallel, for control. Use this parameter with caution.
-XX: GCTimeRatio The ratio of garbage collection time to the total time (1 / (N+1)), the range of values used to measure throughput
(0,100), the default value is 99, that is, the garbage collection time does not exceed 1%. There is a certain contradiction
with the previous -XX:MaxGCPauseMillis parameter. The longer the pause time, the easier it is for the Radio parameter to exceed the set ratio.
-XX:+UseAdaptiveSizePolicy sets the Parallel Scavenge collector to have an adaptive adjustment strategy.
In this mode, parameters such as the size of the young generation, the ratio of Eden to Survivor, and the age of objects promoted to the old generation will be automatically adjusted to achieve a balance between heap size, throughput, and pause time.
In situations where manual tuning is difficult, you can directly use this adaptive method to specify only the maximum heap, target throughput (GCTimeRatio) and pause time (MaxGCPauseMills) of the virtual machine, and let the virtual machine complete the tuning work by itself.
CMS collector
-XX:+UseConcMarkSweepGC The young generation uses CMS GC.
After this parameter is turned on, -XX:+UseParNewGC will be turned on automatically. That is: the combination of ParNew (Young area) + CMS (Old area) + Serial Old
-XX:CMSInitiatingOccupanyFraction sets the threshold of heap memory usage, once the threshold is reached, recycling will start. The default value for JDK5 and earlier versions is 68, and the default value for DK6 and later versions is 92%.
If the memory growth is slow, you can set a slightly larger value. A larger threshold can effectively reduce the trigger frequency of CMS, and reduce the number of old generation recycling can significantly improve application performance.
Conversely, if the application's memory usage grows rapidly, this threshold should be lowered to avoid triggering the old serial collector frequently.
Therefore, this option can effectively reduce the execution times of Fu1l GC.
Whether -XX:+UseCMSInitiatingOccupancyOnly is dynamically adjustable, so that the CMS is always started according to the value set by CMSInitiatingOccupancyFraction
-XX:+UseCMSCompactAtFullCollection is used to specify that the memory space should be compressed and sorted after the Full GC is executed
to avoid memory fragmentation. However, since the memory compression and sorting process cannot be executed concurrently, the problem is that the pause time becomes longer.
-XX:CMSFullGCsBeforeCompaction sets how many times Full GC is performed to compress the memory space.
-XX:ParallelCMSThreads sets the number of CMS threads.
The number of threads started by CMS by default is (ParallelGCThreads+3)/4, and ParallelGCThreads is the number of threads of the young generation parallel collector.
When CPU resources are tight, the performance of the application during the garbage collection phase may be very poor due to the impact of the CMS collector thread.
-XX:ConcGCThreads sets the number of concurrent garbage
collection threads. The default value is calculated based on ParallelGCThreads . If so, enable recycling of the Perm area (before JDK8) -XX:+CMSParallelInitialEnabled is used to enable the CMS initial-mark stage to mark in a multi-threaded manner to improve the marking speed, and it has been enabled by default since Java8. -XX:+CMSParallelRemarkEnabled When the user starts the CMS remark stage, the multi-threaded method is used for remarking. By default, -XX:+ExplicitGCInvokesConcurrent -XX:+ExplicitGCInvokesConcurrentAndUnloadsClasses is enabled
These two parameters user-specified hotspot virtual use CMS cycle when executing System.gc()
-XX:+CMSPrecleaningEnabled specifies whether CMS needs to perform Pre cleaning stage
G1 collector
-XX:+UseG1GC manually specifies to use the G1 collector to perform memory recovery tasks.
-XX:G1HeapRegionSize sets the size of each Region.
The value is a power of 2, the range is between 1MB and 32MB, and the goal is to divide about 2048 regions according to the minimum Java heap size. The default is 1/2000 of the heap memory.
-XX:MaxGCPauseMillis sets the expected maximum GC pause time indicator (JVM will try its best to achieve it, but it is not guaranteed). The default value is 200ms
-XX:ParallelGCThread sets the value of the number of GC threads when STW. The maximum setting is 8
-XX:ConcGCThreads sets the number of threads for concurrent marking. Set n to about 1/4 of the number of parallel garbage collection threads (ParallelGCThreads).
-XX:InitiatingHeapOccupancyPercent sets the Java heap occupancy threshold that triggers concurrent GC cycles. If this value is exceeded, GC is triggered. The default value is 45.
-XX:G1NewSizePercent The minimum percentage of the entire heap memory occupied by the new generation (default 5%)
-XX:G1MaxNewSizePercent The maximum percentage of the entire heap memory occupied by the new generation (default 60%)
-XX:G1ReservePercent=10 Reserve the memory area to prevent to space ( to area in Survivor) overflow
How to choose a garbage collector?
- Prioritize the JVM to adapt and adjust the size of the heap
- Serial collector: memory less than 100M; single-core, stand-alone program, and no pause time requirement
- Parallel collector: multi-CPU, high throughput, allows pause times greater than 1 second
- Concurrent collector: multi-CPU, pursuit of low pause time, fast response (for example, the delay cannot exceed 1 second, such as Internet applications)
- The official recommendation is G1, which has high performance. Now Internet projects basically use G1
Special Note:
- There is no best collector, let alone a universal collector
- Tuning is always for specific scenarios and specific needs, there is no one-and-done collector
GC log related options
-XX:+PrintGC <==> -verbose:gc prints brief log information
-XX:+PrintGCDetails prints detailed log information
-XX:+PrintGCTimeStamps prints the time from program startup to GC occurrence, use -XX:+PrintGCDetails with
-XX: +PrintGCDateStamps prints the time stamp when GC occurs, use -XX:+PrintGCDetails with
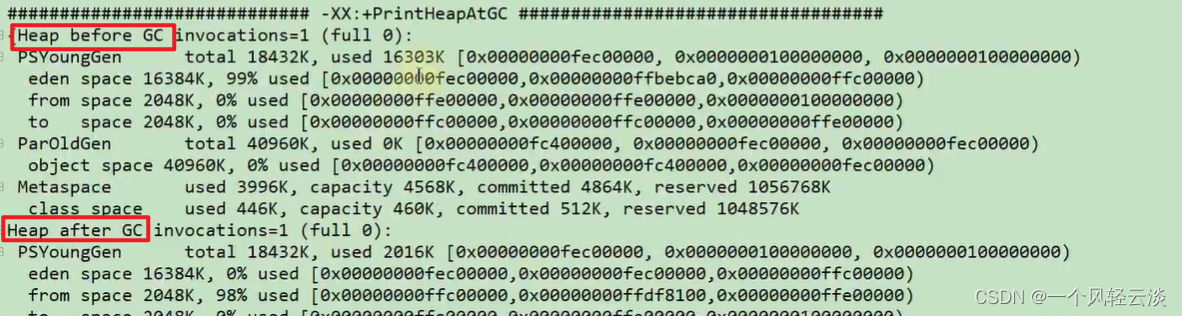
-XX:+PrintHeapAtGC to print the heap information before and after GC, as shown in the figure below
-Xloggc:<file> output GC to the file under the specified path
-XX :+TraceClassLoading monitors the loading of classes
-XX:+PrintGCApplicationStoppedTime prints the thread pause time during GC
-XX:+PrintGCApplicationConcurrentTime prints the uninterrupted execution time of the application before garbage collection
-XX:+PrintReferenceGC prints how many different reference types are recycled Quote
-XX:+PrintTenuringDistribution Print the age distribution of objects in Survivor currently used by the JVM after each MinorGC
-XX:+UseGCLogFileRotation Enable automatic dumping of GC log files
-XX:NumberOfGCLogFiles=1 Set the number of cycles of GC log files
-XX :GCLogFileSize=1M Set the size of the GC log file
Other parameters
-XX:+DisableExplicitGC disables hotspot execution System.gc(), disabled by default
-XX:ReservedCodeCacheSize=<n>[g|m|k], -XX:InitialCodeCacheSize=<n>[g|m|k] specifies the code cache The size of
-XX:+UseCodeCacheFlushing
abandons some compiled code to avoid the situation where the JVM switches to interpreted-only when the code cache is full
. Enable use of large pages -XX:+PrintTLAB to print TLAB usage -XX:TLABSize Set TLAB size
Get JVM parameters through Java code
Java provides the java.lang.management package for monitoring and managing the Java virtual machine and other components in the Java runtime, which allows local or remote monitoring and management of the running Java virtual machine. Among them, the ManagementFactory class is more commonly used, and the Runtime class can obtain related data such as memory and CPU cores. By using these APIs, you can monitor the heap memory usage of the application server, set some thresholds for alarm and other processing .
public class MemoryMonitor {
    public static void main(String[] args) {
        MemoryMXBean memorymbean = ManagementFactory.getMemoryMXBean();
        MemoryUsage usage = memorymbean.getHeapMemoryUsage();
        System.out.println("INIT HEAP: " + usage.getInit() / 1024 / 1024 + "m");
        System.out.println("MAX HEAP: " + usage.getMax() / 1024 / 1024 + "m");
        System.out.println("USE HEAP: " + usage.getUsed() / 1024 / 1024 + "m");
        System.out.println("\nFull Information:");
        System.out.println("Heap Memory Usage: " + memorymbean.getHeapMemoryUsage());
        System.out.println("Non-Heap Memory Usage: " + memorymbean.getNonHeapMemoryUsage());

        System.out.println("=======================通过java来获取相关系统状态============================ ");
        System.out.println("当前堆内存大小totalMemory " + (int) Runtime.getRuntime().totalMemory() / 1024 / 1024 + "m");// 当前堆内存大小
        System.out.println("空闲堆内存大小freeMemory " + (int) Runtime.getRuntime().freeMemory() / 1024 / 1024 + "m");// 空闲堆内存大小
        System.out.println("最大可用总堆内存maxMemory " + Runtime.getRuntime().maxMemory() / 1024 / 1024 + "m");// 最大可用总堆内存大小

    }
}