Explanation: This is a machine learning practical project (with data + code + documentation + video explanation). If you need data + code + documentation + video explanation, you can go directly to the end of the article to get it.

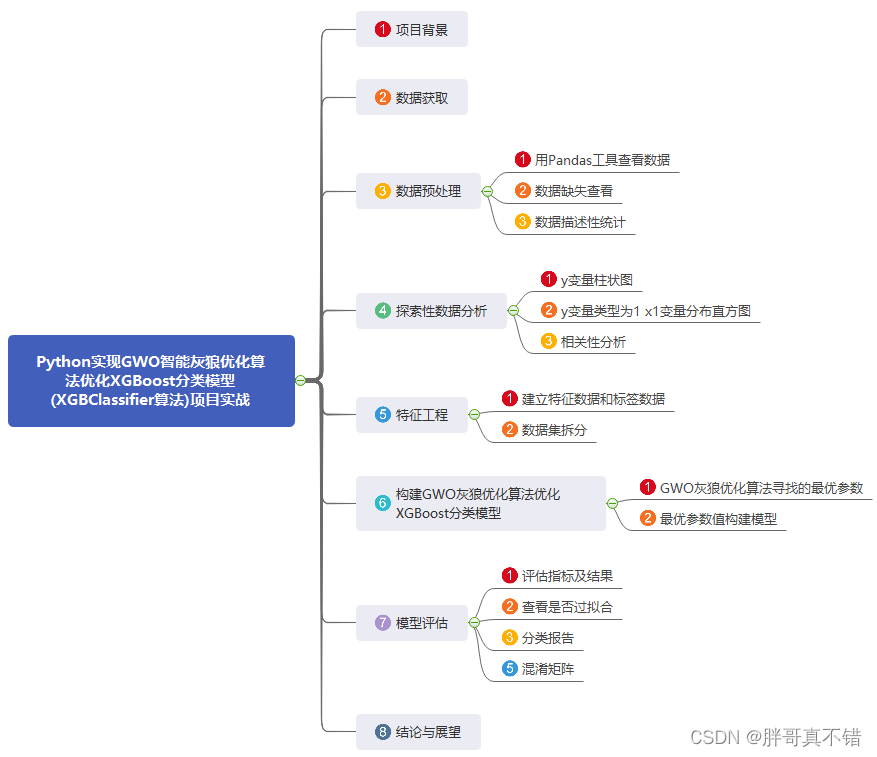
1. Project background
Gray Wolf Optimization Algorithm (GWO), a swarm intelligence optimization algorithm proposed by Mirjalili, a scholar at Griffith University in Australia, in 2014. Inspired by the predation behavior of gray wolf packs. Advantages: strong convergence performance, simple structure, few parameters that need to be adjusted, easy to implement, there is a self-adaptive adjustment of the convergence factor and information feedback mechanism, and it can achieve a balance between local optimization and global search, so in the problem It has good performance in terms of solution accuracy and convergence speed. Disadvantages: It is prone to premature convergence, the convergence accuracy is not high when facing complex problems, and the convergence speed is not fast enough.
There is a strict hierarchy in the gray wolf group, and a small group of gray wolves who have the absolute right to speak lead a group of gray wolves towards their prey. Gray wolves are generally divided into 4 levels: αβδω (power from big to small) simulates the leadership. Collective hunting is a social behavior of gray wolves. Social class plays an important role in the process of collective hunting, and the predation process is completed under the leadership of α . It mainly includes three steps:
- Tracking and approaching prey
- Harasses, chases and surrounds prey until it stops moving
- attack prey
This project optimizes the XGBoost classification model through the GWO gray wolf optimization algorithm.
2. Data acquisition
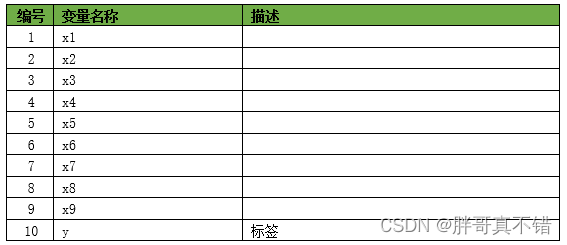
The modeling data for this time comes from the Internet (compiled by the author of this project), and the statistics of the data items are as follows:
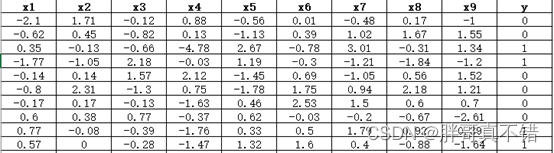
The data details are as follows (partial display):
3. Data preprocessing
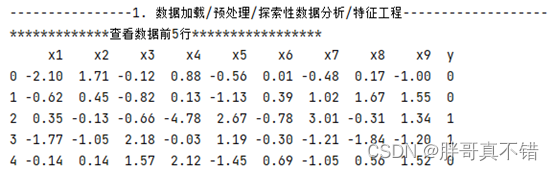
3.1 View data with Pandas tools
Use the head() method of the Pandas tool to view the first five rows of data:
key code:
3.2 Data missing view
Use the info() method of the Pandas tool to view data information:

As can be seen from the figure above, there are a total of 10 variables, no missing values in the data, and a total of 1000 data.
key code:
3.3 Data descriptive statistics
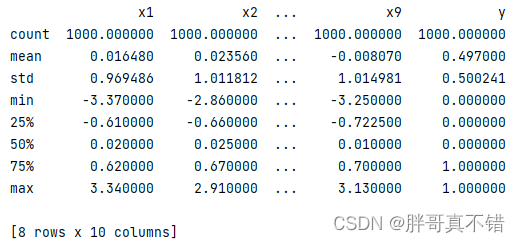
Use the describe() method of the Pandas tool to view the mean, standard deviation, minimum, quantile, and maximum of the data.
The key code is as follows:
4. Exploratory Data Analysis
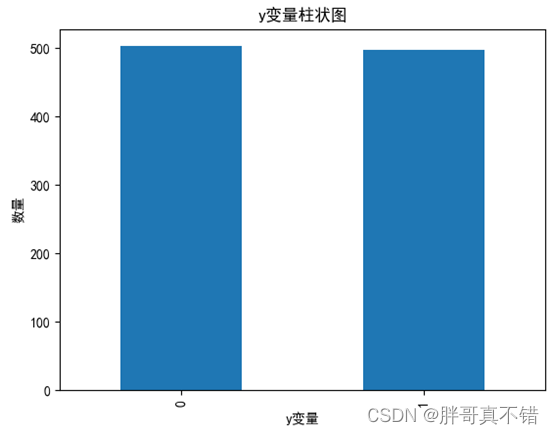
4.1 y variable histogram
Use the plot() method of the Matplotlib tool to draw a histogram:
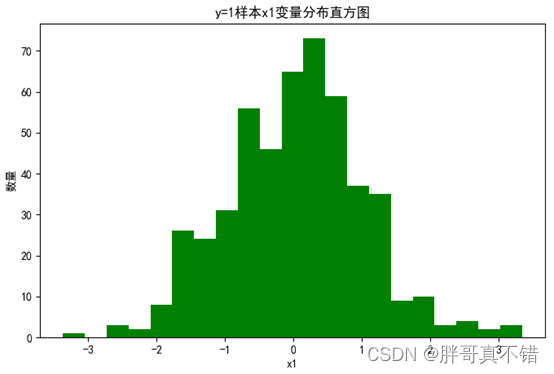
4.2 y=1 sample x1 variable distribution histogram
Use the hist() method of the Matplotlib tool to draw a histogram:
4.3 Correlation analysis

As can be seen from the figure above, the larger the value, the stronger the correlation. A positive value is a positive correlation, and a negative value is a negative correlation.
5. Feature Engineering
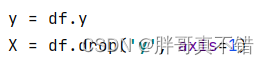
5.1 Establish feature data and label data
The key code is as follows:
5.2 Dataset splitting
Use the train_test_split() method to divide according to 80% training set and 20% test set. The key code is as follows:
![]()
6. Construct the GWO gray wolf optimization algorithm to optimize the XGBoost classification model
Mainly use the GWO gray wolf optimization algorithm to optimize the XGBClassifier algorithm for target classification.
6.1 Optimal parameters searched by GWO gray wolf optimization algorithm
key code:
Process data for each iteration:
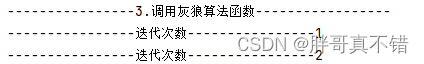
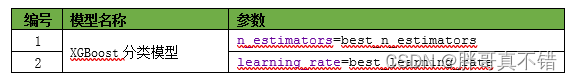
Optimal parameters:
| ----------------4. Optimal result display ----------------- The best n_estimators is 100 The best learning_rate is 0.05 |
6.2 Optimal parameter value construction model
7. Model Evaluation
7.1 Evaluation indicators and results
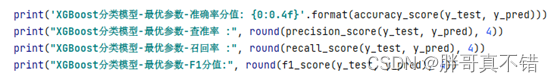
Evaluation indicators mainly include accuracy rate, precision rate, recall rate, F1 score and so on.
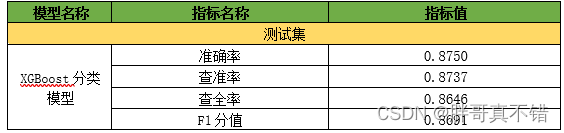
It can be seen from the above table that the F1 score is 0.8691, which indicates that the model effect is relatively good.
The key code is as follows:
7.2 Check for overfitting
![]()
As can be seen from the figure above, the scores of the training set and the test set are equivalent, and there is no over-fitting phenomenon.
7.3 Classification report
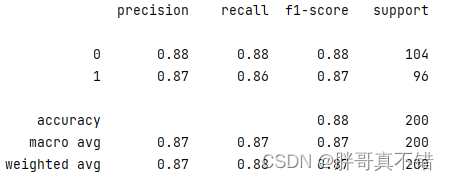
As can be seen from the above figure, the F1 score of classification 0 is 0.88; the F1 score of classification 1 is 0.87.
7.4 Confusion Matrix
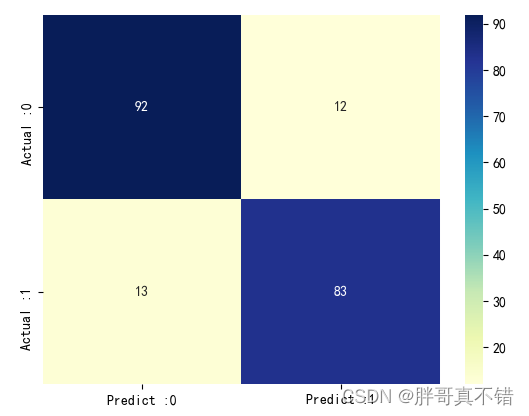
As can be seen from the above figure, there are 13 samples that are actually 0 and predicted to be not 0; there are 12 samples that are actually 1 and predicted to be not 1, and the overall prediction accuracy is good.
8. Conclusion and Outlook
To sum up, this paper uses the GWO gray wolf optimization algorithm to find the optimal parameter values of the XGBoost classification algorithm to build a classification model, and finally proves that the model we proposed works well. This model can be used for forecasting of everyday products.
本次机器学习项目实战所需的资料,项目资源如下:

项目说明:

链接:https://pan.baidu.com/s/1c6mQ_1YaDINFEttQymp2UQ

提取码:thgk
For more project practice, see the list of machine learning project practice collections:
List of actual combat collections of machine learning projects