1 Vegetation coverage (Fractional Vegetation Cover, FVC) remote sensing inversion method:
1.1 Pixel dichotomy: principle omitted
Operation steps of pixel dichotomy:
(1) Acquisition of data sources, required data: NDVI, EVI and other vegetation indices. This article takes the normalized difference vegetation index NDVI as an example.
The data used in this article is the MOD13Q1 vegetation product of MODIS, and the specific introduction of the product is omitted. This product provides 250m of NDVI data, which can be downloaded from the LPDAAC website or called on the GEE platform
For convenience, I downloaded it on the GEE platform, and the code is as follows (written at zero time, please point out any mistakes)
Download result:
Normal value:
Notice:
1) MOD13Q1 needs preprocessing such as splicing and cropping. The pixel value of the original data is an integer and needs to be multiplied by a scaling factor of 0.0001.
2) In some software, when loading MODIS image, there will be a white/black phenomenon. The reason may be that there is a background value, or the statistical value of MOD13Q1 data is abnormal (there is a large or small value).
Situations where outliers need to be removed:


At this time, outliers need to be removed by band calculation:
b1 is the vegetation index band,
lt (less than)-1 refers to a value less than -1; *0 means the assignment is 0;
b1 ge(greather equal )-1 and b1 le(less equal)1()
Refers to the value of b1 greater than or equal to -1 and less than or equal to 1;
*b1 refers to assignment to b1


3) Welcome to add
(2) End member value selection
Method 1: Select end member values based on the confidence interval method
Method 2: Visually interpret high spatial resolution remote sensing images, manually select soil or vegetation pixels, and record their endmember values (theoretically possible)
Method 1: Select a 5% confidence interval. The NDVI value of bare soil end members should be between -0.1 and 0.2, and the NDVI value of pure vegetation should be above 0.8. Underestimation of bare soil end members will lead to overestimation of FVC[1]. The choice of 0.63 for the pure vegetation endmember in the table will result in inaccurate FVC estimation, which is closely related to the QTP vegetation growth season. Therefore, end member values should be carefully selected in combination with regions and seasons.
[1] Montandon L M, Small E E. The impact of soil reflectance on the quantification of the green vegetation fraction from NDVI - ScienceDirect[J]. Remote Sensing of Environment, 2008, 112( 4):1835-1845.
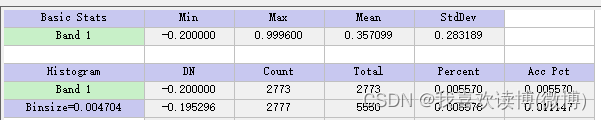
Soil end member: 0.039
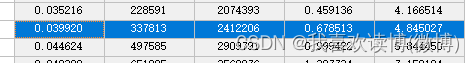
Vegetation endmember: 0.858
![]()
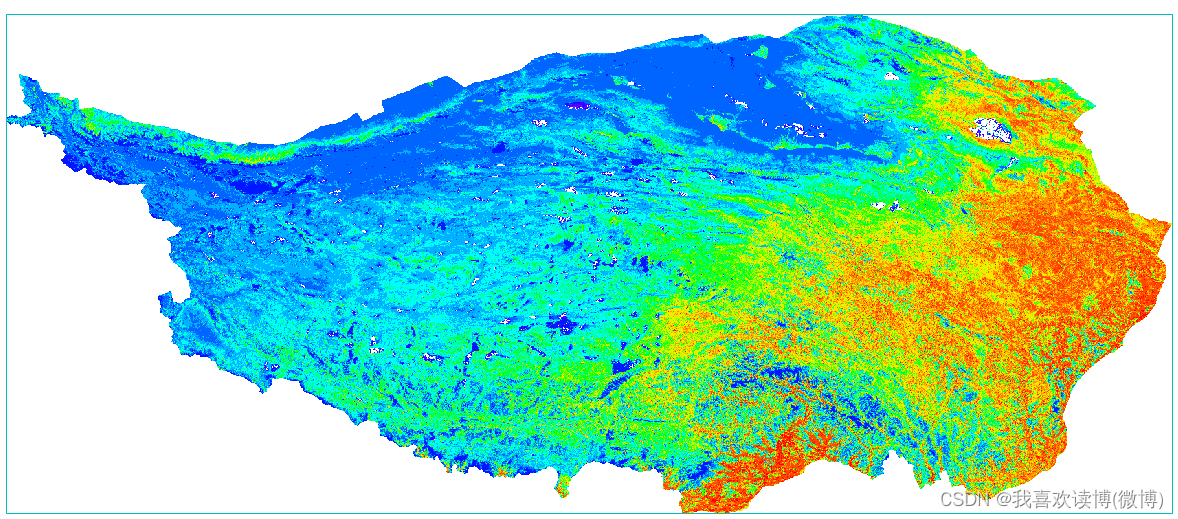
Finally, use the band calculation to calculate the vegetation coverage (B1 chooses NDVI). I believe everyone is very familiar with the pixel dichotomy formula.
Calculate the calculation result of vegetation coverage:
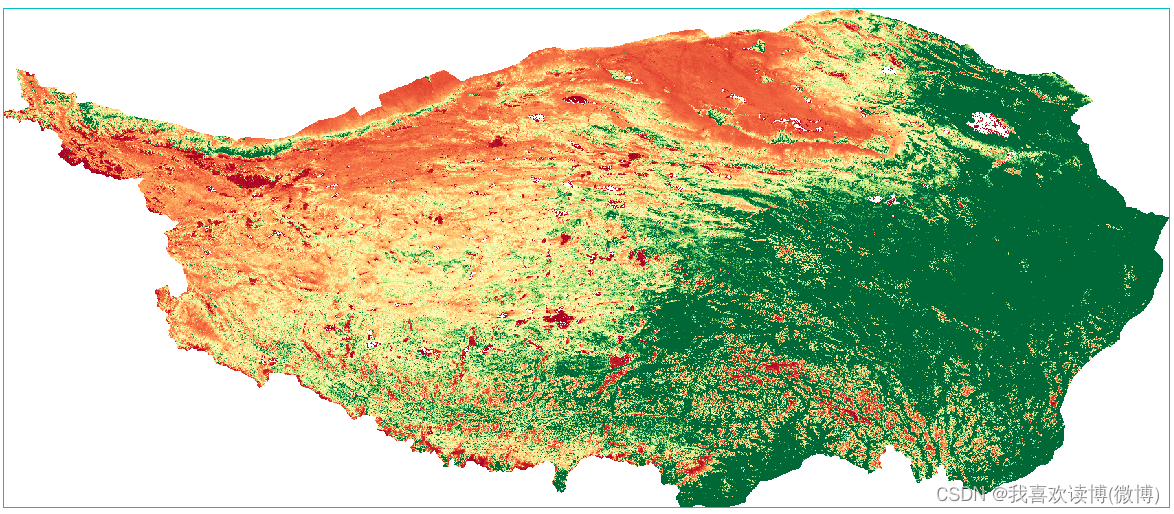
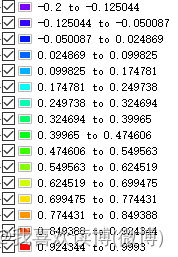
In addition, according to the definition of FVC, the calculated FVC value should be classified between 0 and 1
![]()
If some readers want to know, please leave a comment and leave a message. I will update it as soon as possible. If you have any questions, please feel free to chat privately (2023.4.7)
1.2 Empirical regression model method: vegetation index, spectral band linear regression
1.3 Machine learning methods: random forest, support vector machine, multivariate adaptive regression spline, Gaussian process regression, neural network, etc.
2 Vegetation coverage product data
GLASS, GEOV1, GEOV2, GEOV3, MuSyQ FVC usage and processing tutorial
2.1 MuSyQ FVC product data
Source: Obtained via email FTP after application on the homepage of the National Earth System Science Data Center
references:
Zhao J , Li J , Liu Q , et al., 2020. Estimating fractional vegetation cover from leaf area index and clumping index based on the gap probability theory. International Journal of Applied Earth Observation and Geoinformation 90:102112.
The temporal and spatial resolution of the data is 4d/500m, the time range: 2001~2019, and the spatial range: global
HDF5(H5) can be opened by MATLAB and Python, and converted to tif
2.2 GEOV3、GEOV2、GEOV1
Source: Copernicus Global Land Services (https://land.copernicus.eu/global/products/fcover)
references:
Fuster, B.; Sánchez-Zapero, J.; Camacho, F.; García-Santos, V.; Verger, A.; Lacaze, R.; Weiss, M.; Baret, F.; Smets, B. Quality Assessment of PROBA-V LAI, FAPAR and FCOVER Collection 300 m Products of Copernicus Global Land Service. Remote Sens. 2020, 12, doi:10.3390/rs12061017.
Baret, F.; Weiss, M.; Lacaze, R.; Camacho, F.; Makhmara, H.; Pacholcyzk, P.; Smets, B. GEOV1: LAI and FAPAR Essential Climate Variables and FCOVER Global Time Series Capitalizing over Existing Products. Part1: Principles of Development and Production. Remote Sens. Environ. 2013, 137, 299–309, doi:10.1016/j.rse.2012.12.027.
Verger, A.; Baret, F.; Weiss, M. Biophysical Variables from VEGETATION-P Data. MultiTemp 2013 7th Int. Work. Anal. Multi-temporal Remote Sens. Images. IEEE, 2013, 10–13.
Processing method: ArcGIS modeling can be processed in batches
3 Vegetation response to meteorology and topography
3.1 Trend Analysis

3.2 Partial correlation analysis Multiple correlation analysis
