Article directory
01-GC log parameters
| parameter | illustrate |
|---|---|
| -verbose:gc | Output gc log information, output to standard output by default |
| -XX:+PrintGC | Output GC log. Similar to: -verbose:gc |
| -XX:+PrintGCDetails | Print the log of memory recovery when garbage collection occurs, and output the current memory area allocation when the process exits |
| -XX:+PrintGCTimeStamps | Output the timestamp when GC occurred |
| -XX:+PrintGCDateStamps | Output the timestamp when GC occurred (in the form of date, for example: 2013-05-04T21:53:59.234+0800) |
| -XX:+PrintHeapAtGC | Print heap information before and after each GC |
| -Xloggc: | Indicates that the GC log is written to a file instead of being printed to standard output |
02-GC log format
Review: GC classification
For the implementation of HotSpot VM, the GC in it is divided into two types according to the recovery area: one is partial collection (Partial GC), and the other is full heap collection (Full GC).
- Partial collection: Garbage collection that does not completely collect the entire Java heap. Which is divided into:
- Young GC (Minor GC / Young GC): just the garbage collection of the new generation (Eden\S0,S1)
- Old generation collection (Minor GC / Old GC): It is just the garbage collection of the old generation.
- Currently, only the CMS GC has the behavior of separately collecting the old generation.
- Note that in many cases, Major GC will be confused with Full GC, and it is necessary to specifically distinguish whether it is old-age collection or full-heap collection.
- Mixed collection (Mixed GC): Collect the entire new generation and part of the old generation garbage collection.
- Currently only the G1 GC has this behavior.
- Full heap collection (Full GC): Garbage collection that collects the entire Java heap and method area.
What situations will trigger Full GC?
- Insufficient space in the old generation
- method goes out of space
- Explicitly call System.gc()
- The average size of the data that Minor GC enters in the old age is greater than the available memory in the old age
- Large objects go directly to the old age, and there is not enough free space in the old generation
GC details for different GC classes
/**
 *  -XX:+PrintCommandLineFlags
 *
 *  -XX:+UseSerialGC:表明新生代使用Serial GC ,同时老年代使用Serial Old GC
 *
 *  -XX:+UseParNewGC:标明新生代使用ParNew GC
 *
 *  -XX:+UseParallelGC:表明新生代使用Parallel GC
 *  -XX:+UseParallelOldGC : 表明老年代使用 Parallel Old GC
 *  说明:二者可以相互激活
 */
public class GCUseTest {


    public static void main(String[] args) {


        ArrayList<byte[]> list = new ArrayList<>();

        while(true){


            byte[] arr = new byte[1024 * 10];//10kb
            list.add(arr);
//            try {


//                Thread.sleep(5);
//            } catch (InterruptedException e) {


//                e.printStackTrace();
//            }
        }
    }
}
GC log classification
Minor GC
[GC (Allocation Failure) [PSYoungGen: 131072K->21486K(152576K)] 131072K->125625K(500736K), 0.0264772 secs] [Times: user=0.05 sys=0.34, real=0.03 secs]

law:
[Name: Memory usage before GC -> Memory usage after GC (total memory size in this area)
Full GC
[Full GC (Ergonomics) [PSYoungGen: 21491K->0K(283648K)] [ParOldGen: 234962K->255123K(543744K)] 256454K->255123K(827392K), [Metaspace: 2941K->2941K(1056768K)], 0.0377849 secs] [Times: user=0.45 sys=0.00, real=0.04 secs]
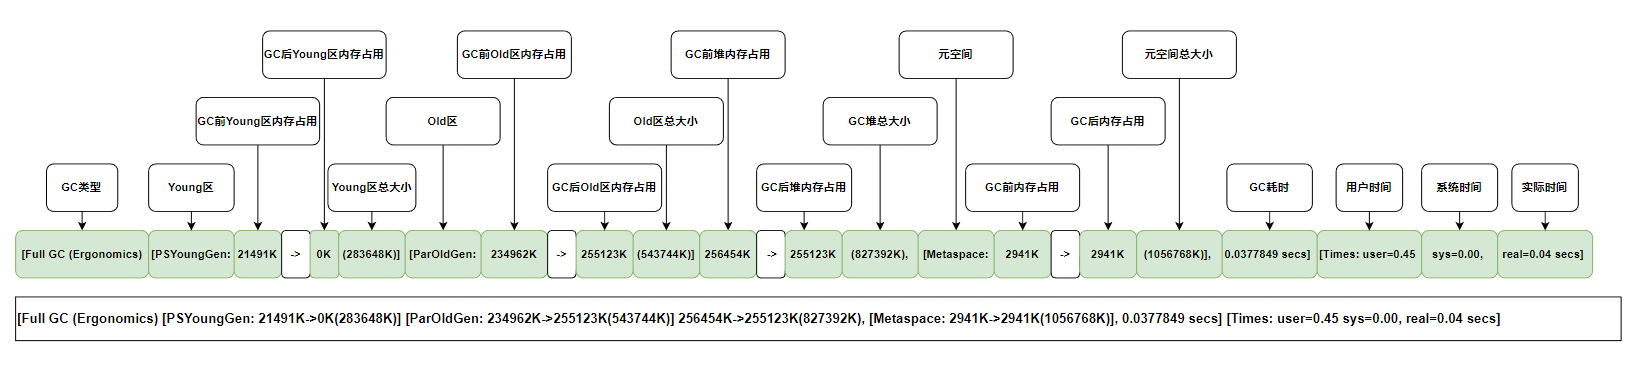
law:
[Name: Memory usage before GC -> Memory usage after GC (total memory size in this area)
Analysis of log structure
garbage collector
- The name of the new generation using the Serial collector is Defual New Generation, so the display is: "[DefNew]"
- Using the ParNew collector, the name of the new generation will become "[ParNew", which means "Parallel New Generation"
- The name of the new generation using the Parallel Scavenge collector is "[PSYoungGen", and JDK1.7 here uses PSYoungGen
- The name of the old generation using the Parallel Old Generation collector is "[ParOldGen"
- If the G1 collector is used, it will be displayed as "garbage-first heap"
Allocation Failuer
It shows that the reason for the GC this time is because there is not enough space in the young generation to store new data.
Before and after GC
Through the previous illustration, we found that the law of GC logs is generally: memory usage before GC -> memory usage after GC (total memory size in this area)
[PSYoungGen: 16302K->2044K(18432K)] 16302K->15130K(59392K), 0.0033553 secs]
In square brackets: the size of the young generation heap after GC Husi, the size after recycling, (the total size of the young generation heap)
Outside the brackets: the size of the young generation and the old generation before GC recovery, the size after recovery, (the total size of the young generation and the old generation)
GC time
There are three times in the GC log: user, sys and real
- user - Time spent by the process executing userland code (outside of the kernel). This is the actual CPU time used to execute this process , other processes and time blocked by this process are not included. In the case of garbage collection, it indicates the total CPU time used by GC thread execution.
- sys - Clock time spent by the process in kernel mode. That is, the CPU time used by the kernel to execute system calls or wait for system time
- real - This time includes time slices used by other processes and time the process is blocked (such as waiting for I/O to complete). For parallel GC, this number should be close to (user time + system time) divided by the number of threads used by the garbage collector.
Due to multi-core reasons, in general GC events, the real time is less than sys + user time, because generally multiple threads do GC concurrently, so the real time is less than sys + user time. If real > sys + user, the application may have the following problems: the IO load is very important or the CPU is not enough.
Minor GC log parsing

2020-11-20T17:19:43.265-0800
Add -XX:+PrintGCDateStamps parameter
log print time and date format such as
2013-05-04T21:53:59.234+0800
0.822:
Add -XX:+PrintGCTimeStamps when the parameter
gc occurs, the number of seconds since the Java virtual machine started
[GC(Allocation Failure)
A garbage collection occurs, which is a Minor GC. It does not distinguish between the new generation and the old generation GC. The content in parentheses is the reason for the GC. The reason for Allocation Failure here is that there is not enough area in the new generation to store the data that needs to be allocated and it fails.
[PSYoungGen:76800K->8433K(89600K)
PSYoungGen: Indicates the area where GC occurs, and the area name is closely related to the GC collector used
- Serial collector: Default New Generation shows Defnew
- ParNew collector: ParNew
- Parallel Scanvenge Collector: PSYoung
- The old generation is the same as the new generation, and it is also related to the name of the collector
76800K->8433K(89600K): the used capacity of the memory area before GC -> the capacity of the cover area after GC (total capacity of this area)
- If it is the new generation, the total capacity will display 9/10 of the entire new generation memory, that is, eden+from/to area
- If it is the old generation, the total capacity is the size of the whole body memory, no change
76800K->8449K(294400K)
Although it is Minor GC this time, it will only collect garbage in the new generation, but it will definitely print information about the total capacity of the heap
After the area capacity GC is displayed, the GC of the entire heap memory area will be displayed: the used capacity of the heap memory before GC -> the heap memory capacity after GC (the total capacity of the heap memory), and the total capacity of the heap memory = 9/ 10 new generation + old generation, then the total heap memory capacity must be less than the initialized memory size
,0.0088371
The time spent by the entire GC, in seconds
[Times:user=0.02 sys=0.01,real=0.01 secs]
- user: Refers to the time spent by the CPU working in user mode
- sys: Refers to the time spent by the CPU working in kernel mode
- real: refers to the total time spent in this event
Full GC log analysis
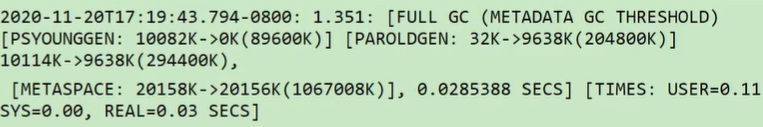
2020-11-20T17:19:43.794-0800
Add -XX:+PrintGCDateStamps parameter
The format of the log printing time and date is
2013-05-04T21:53:59.234+0800
1.351
Add -XX:+PrintGCTimeStamps to this parameter
The number of seconds elapsed since the Java virtual machine was started when gc occurred
Full GC(Metadata GCThreshold)
The parentheses are the reasons why gc occurs, the reason: the Metaspace area is not enough.
In addition, there are two other situations that will cause Full GC, as follows:
1. Full GC (FErgonomics)
reason: GC caused by JVM adaptive adjustment
2. Full GC (System)
reason: System.gc() is called method
[PSYoungGen: 100082K->0K(89600K)]
PSYoungGen: Indicates the area where GC occurs, and the area name is closely related to the GC collector used
- Serial collector: Default New Generation displays DefNew
- ParNew collector: ParNew
- Parallel Scanvenge Collector: PSYoungGen
- The old generation is the same as the new generation, and it is also related to the name of the collector
10082K->0K(89600K): the used capacity of this memory area before GC -> the capacity of this area for GC (total capacity of this area)
- If it is the new generation, the total capacity will display 9/10 of the entire new generation memory, that is, eden+from/to area
- If it is the old generation, the total capacity is the size of the entire memory, no change
ParOldGen:32K->9638K(204800K)
There is no GC in the old area, so this GC is caused by metaspace
10114K->9638K(294400K),
After the area capacity GC is displayed, the GC of the entire heap memory area will be displayed: the used capacity of the heap memory before GC -> the heap memory capacity after GC (the total capacity of the heap memory), and the total capacity of the heap memory = 9/ 10 new generation + old generation, then the total heap memory capacity must be less than the initialized memory size
[Meatspace:20158K->20156K(1067008K)],
Metaspace GC reclaims 2K space
03-GC log analysis tool
The printing and meaning of GC logs are introduced above, but GC logs seem cumbersome. This section will introduce GC log visualization analysis tools GCeasy and GCviewer. Through the GC log visualization analysis tool, we can easily see the memory usage of each generation of the JVM, the number of garbage collections, the reasons for garbage collection, the time occupied by garbage collection, and the throughput. It's useful when you're good.
If you want to store the GC log in a file, it is the following parameter:
-Xloggc:/path/to/gc.log
Then you can use some space to analyze these gc logs.
GCeasy (more practical)
URL: https://gceasy.io/
GCeasy is an online GC log analyzer, which can analyze GC logs, check memory leaks, analyze GC suspension reasons, and optimize JVM configuration suggestions. And it's free to try.
GCViewer (end of maintenance)
An online GC log analyzer is introduced above, and an offline version of GCViewer is introduced below
GCViewer is a free, open-source analysis tool for visualizing garbage collector logs generated by SUN/Oracle, IBM, HP, and BEA Java virtual machines.
GCViewer is used to visualize data generated by Java VM options -verbose:gc and .NET -Xloggc:. It also calculates performance metrics related to garbage collection (throughput I accumulated pauses, longest pauses, etc.). This feature is useful when tuning an application's garbage by changing the generation size or setting the initial heap size.
Download link: https://github.com/chewiebug/GCViewer/wiki/Changelog
use
Double click or java -jar gcviewer-1.37-SNAPSHOT.jar
other tools (can be ignored)
GChisto
- GChisto is a tool for professionally analyzing gc logs. It can analyze through gc logs: the number, frequency, duration, etc. of MinorGC and Full GC, and reflect the situation of gc in different forms such as lists, reports, and charts.
- Although the interface is a little rough, but the function is good.
HPjmeter
- The tool is very powerful, but it can only open the GC log generated by the following parameters, -verbose:gc -Xloggc:gc.log. The gc.log generated by adding other parameters cannot be opened
- HPjmeter integrates the previous HPjtune function to analyze garbage collection log files generated on HP machines