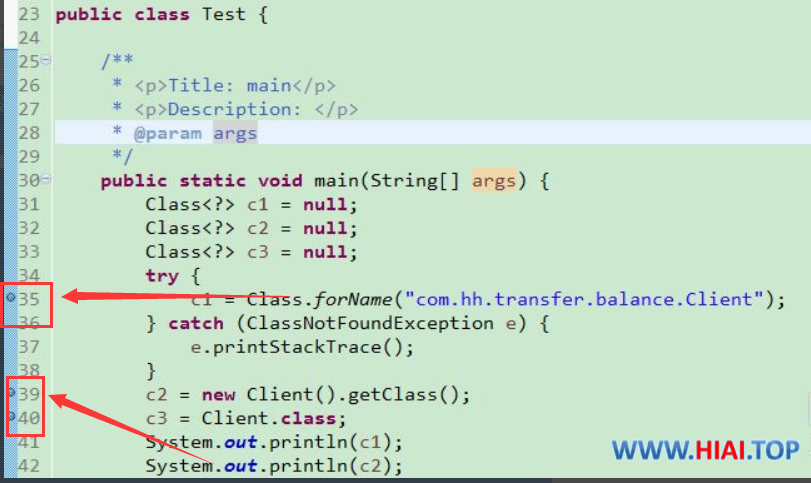
1. First, set a breakpoint: In the place where you need to debug in the code, double-click the left side of the code line number, and double-click again to cancel the breakpoint.
2. Start the service and start debugging:
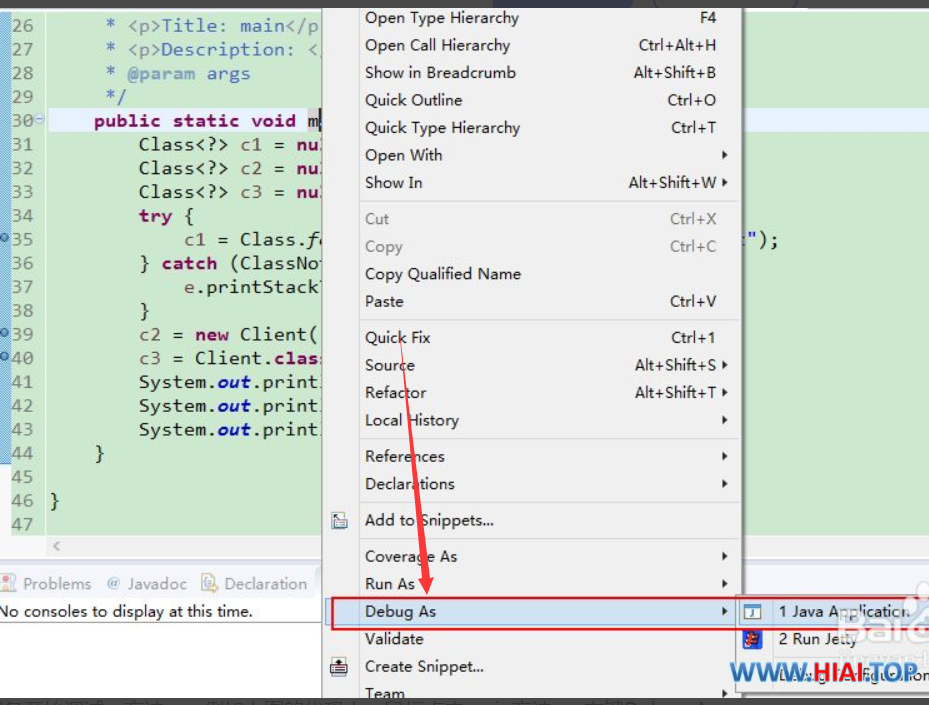
- Method 1, for example, in the code above, click the main method --> right-click Debug As --> Java Application to start java code debugging;
- Method 2, directly click the "Debug" button, that is, click the inverted triangle next to the little ladybug, and select Debug As-->Java Application,;
- Method 3, shortcut key F11;
- Method 4, select Run-->Debug in the menu bar, and there are other methods that will not be described here. When the development tool is first debugged, a prompt will pop up, you need to switch to the Debug workspace, check "Remember my
decision", and there will be no prompt next time.
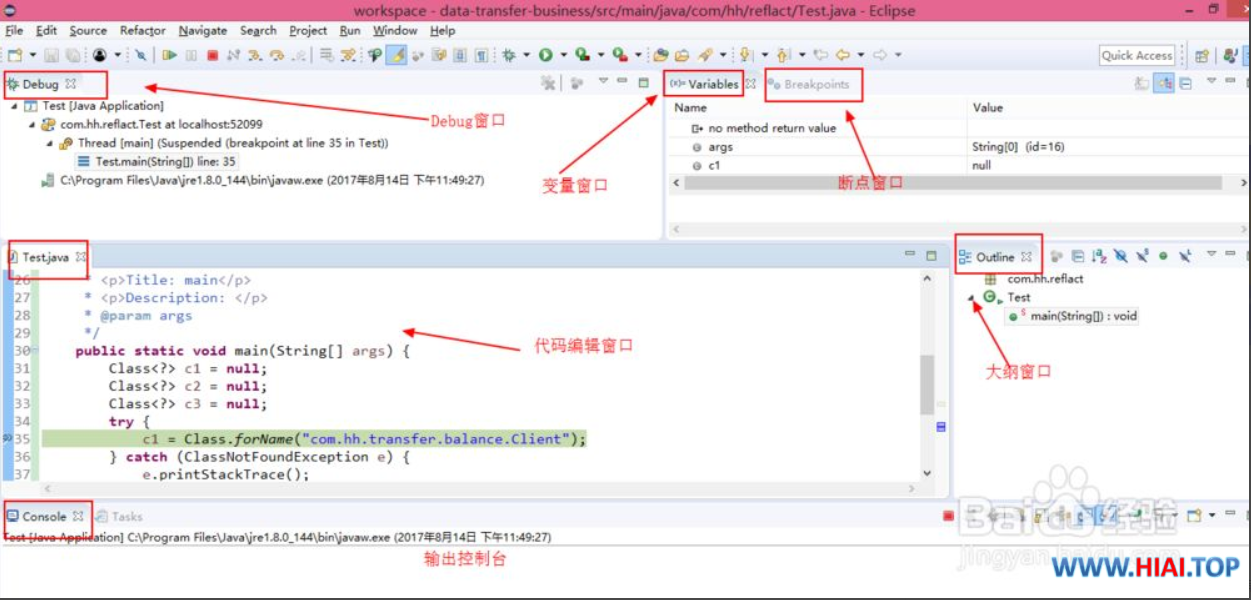
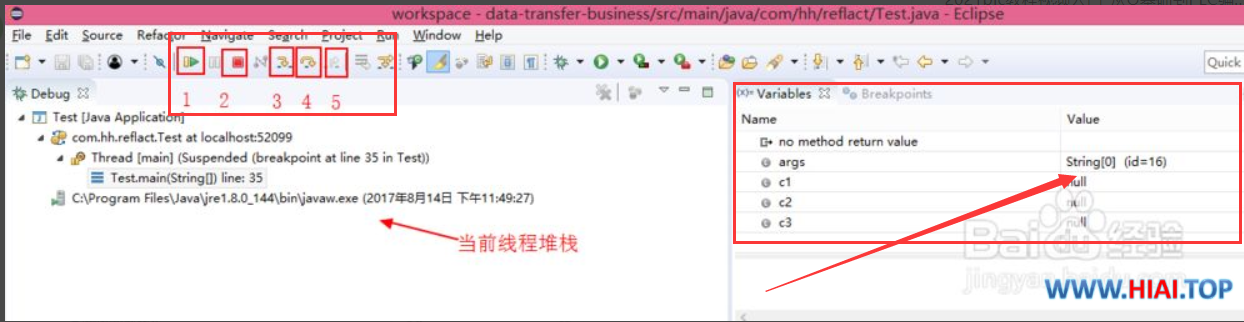
3. After running the java program in debug mode, jump to the debug view, the most commonly used windows are:
Debug window, variable variable window, breakpoint Breakpoints window, code editing window, output Console window, outline window.
The Debug window displays the method call stack of the current thread, and the line to which the method is executed. Variables displays the local variables of the current method, non-static variables, etc., and variable values can be modified. Breakpoints can be used to add and delete breakpoints. Console console Used to view printed log information.
4. The Debug view can be used to debug and run the program. The picture below shows the commonly used debug buttons and corresponding shortcut keys.
- 1 means continue to execute the code until the next breakpoint is encountered, shortcut key F8 (resume)
- 2 means stop debugging (terminate)
- 3 means enter the current method, execute step by step, shortcut key F5 (step into)
- 4 means to run the next line of code, execute the current line, but not enter the execution details, shortcut key F6 (step over)
- 5 means to exit the current method and return to the calling layer, and the shortcut key is F7 (step return).
During the debugging process, the Debug view has a lot of stack information. In addition, when the mouse is moved to the code editing window during debugging, the value of the current variable will be displayed when it is placed on the variable.
5. Skip or clear breakpoints: set all breakpoints to skip, so there will be a slash on the breakpoint, indicating that the breakpoint is skipped, and the thread will not be suspended at the breakpoint. Click Run-->Remove All Breakpoints to clear all breakpoints, which can be done after the breakpoint debugging.
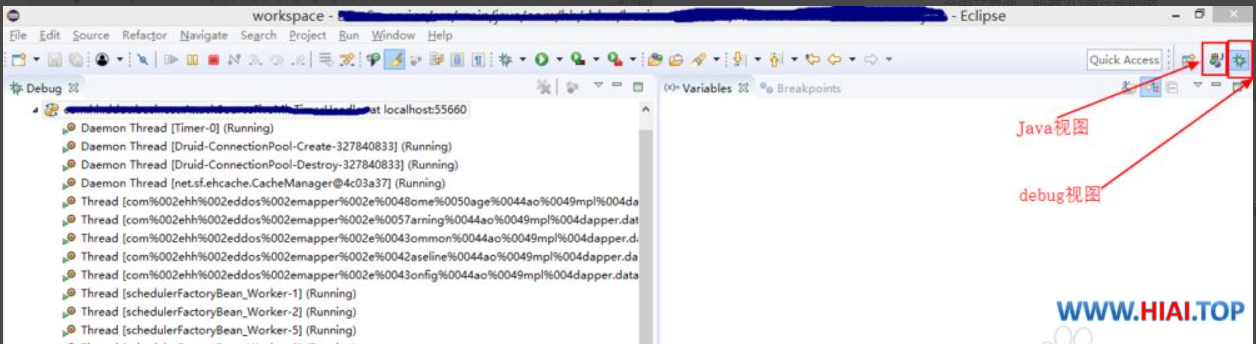
6. After the Debug debugging is completed, you need to switch back to the Java view. Two switching methods are introduced below.
- 1 is to switch through the two buttons in the upper right corner of the IDE, as shown in the figure below.
- 2 is to click the menu Window-->Perspective-->Open Perspective to select the corresponding view.