Tip: The Aggregate Report component can be used in the same way as the View Result Tree component. This article mainly introduces the content of the aggregation report component in detail, without giving examples.
1. Introduction to aggregation report
When using JMeter for performance testing, the aggregate report (Aggregate Report) can be said to be a must-use listener.
(1) How aggregated reports are generated
Aggregated reports can be generated in 2 ways:
In the case of an existing .jtl file, you can directly choose to load the file to generate an aggregation report.
Aggregated reports are dynamically generated during the running of JMeter.
Tip: We have been using GUI mode to operate JMeter, so the content in the aggregation report component we see is the second generation method. When we introduce the operation of JMeter in non-GUI mode later, we will explain the aggregation report generated by the first method.
(2) Data source of aggregation report
The data source of the statistics in the aggregation report is actually the data collected from the statistical SampleResult.
Special attention should be paid to:
- Each row in the aggregated report represents a request. Note: Only one request with the same name will be displayed, and the results will be combined.
- Each column of information in the aggregation report is calculated by different methods of the SamplingStatCalculator class, and requests with the same name will share the same SamplingStatCalculator.
- Regardless of whether JMeter generates an aggregated report in real time, or an aggregated report generated based on an existing .jtl result file, the final bottom layer is to call the add(sampleResult) method of the StatGraphVisualizer class to generate a row of data in the table, and the passed parameters are for each request. Request result (sampleResult) information.
When to call the add method:
1) When generating a report based on the .jtl file, the add method is called every time a row of data is parsed.
2) Run in real time to generate an aggregated report, and call the add method every time a request is made.
hint:
1. Note: When using aggregated reports, do not use the same request sampler name in the test plan.
2. Observing the results of the aggregation report, it is found that the aggregation report is cumulative, that is, the statistics of the results of each run are based on the results of the previous run, including the number of request samples initiated, etc. are superimposed.
2. Detailed explanation of the aggregation report interface
The way to add aggregated report components: Right-click "Thread Group" —> Add—> Listener—> Aggregated Report.
The content of the interface is shown in the figure below:
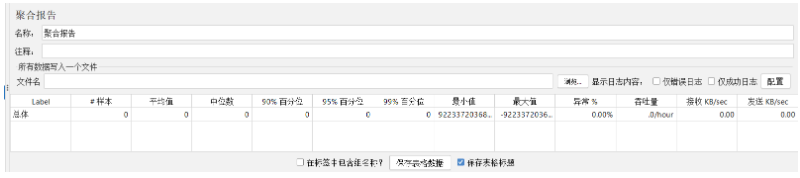
Aggregated report interface description:
- Name: The custom name of the aggregation report component, it is best to know the name.
- Note: add some remarks, a brief description of the aggregated report component, so that you can review it later.
(1) Write all data to a file
In JMeter, we can store the access content of each user in the script test into a file.
The following locations in the Aggregate Report component need to be manipulated:

illustrate:
- File name: Enter the full path of a file, the suffix can be .csv, .html, etc. If the file does not exist, create the file; if the file already exists, choose to overwrite the original file as a result of the operation.
- Display log content:
1) Only log errors: only save error log information to the file.
2) Only successful log: only save the log information of normal response to the file.
- Configure: Configure the content to be recorded in the test result file, which can be selected according to your own needs.
As shown below: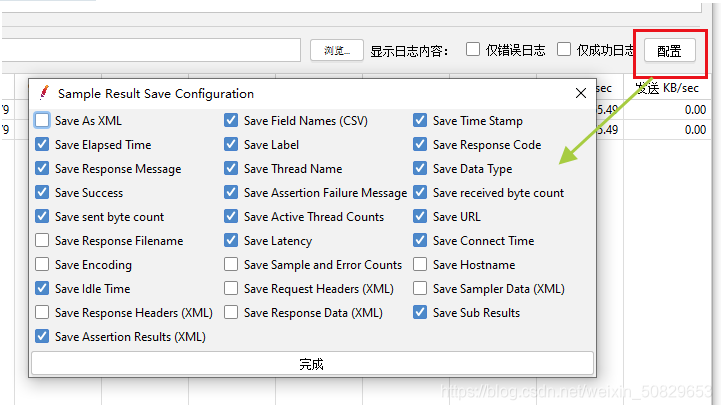
Tip: We can click the "Browse" button to select the stored aggregated report file to view the request results of the previous script.
(2) Introduction to aggregation report list items
1. Label: The requested name is the name of the Sampler in the script.
2. #Samples (sample): the total number of requests sent to the server. If 10 users are simulated and each user iterates 10 times, then the total number of requests is: 10*10 =100 times.
3. Average (average value): By default, it is the average response time of a single Request. When using the Transaction Controller (transaction controller), you can also use the Transaction time to display the average response time, in milliseconds.
4. Median (median): The response time of 50% of users is less than this value.
5. 90% Line (90% percentile): The response time of 90% of users is less than this value.
6. 95% Line (95% percentile): The response time of 95% of users is less than this value.
7. 99% Line (99% percentile): The response time of 99% of users is less than this value.
8. Min (minimum value): The minimum response time.
9. Maximum (maximum value): the maximum response time.
10. Error% (abnormal %): error rate = number of wrong requests/total number of requests.
11. Throughput: By default, it indicates the number of requests completed per second (Request per Second).
12. Received KB/sec (received data): the amount of data received from the server per second.
13. Sent KB/sec (sent): the amount of data sent to the server per second.
(3) Save the aggregated report report
Include group name in label? : Check it if you need it, and uncheck it if you don’t need it.
Saving table data: It is to save the table content displayed on the aggregated report page, not the user's request log information.
Save Table Title: Check if required.
3. Description of the information points in the aggregation report
(1) Description of percentiles
1. Popular science: 90% of the correct meanings of Line parameters
Here I think it is necessary to talk about my understanding of 90% Line:
Many people understand it as: the average response time of 90% of users. I've always thought so before, but then I realized I was wrong.
Then look at what the JMeter official website says?
90% Line - 90% of the samples took no more than this time. The remaining samples at least as long as this.
It means: 90% of the samples do not exceed this time, and the remaining samples at least need to be equal to or exceed this time.
In other words, it means that 90% of the request time is within this time.
2. This involves a concept in mathematics: percentile
Percentile: A statistical term. If a set of data is sorted from large to small and the corresponding cumulative percentile is calculated, the value of the data corresponding to a certain percentile is called the value of this percentile. percentile. It can be expressed as: a group of n observed values are arranged according to the numerical value, and the value at the p% position is called the pth percentile.
The percentile is usually expressed by the hundredth percentile. For example, taking height as an example, the 5th percentile of the height distribution means that 5% of the people have a height smaller than this measurement value, and 95% of people have a height greater than this measurement value.
3. Another example:
There are 10 numbers: 1, 2, 3, 4, 5, 6, 7, 8, 9, 10, arrange them from small to large.
Find its 90th percentile, that is, the 9th number is exactly 9, then its 90% Line is 9.
4. So what is the significance of percentiles in performance testing?
It could be more accurate using our analysis results!
Because when evaluating the results of a test, it is not enough to have the average response time. If in a test, a total of 100 requests are responded, the minimum response time is 0.02 seconds, the maximum response time is 110 seconds, and the average transaction response time is 4.7 seconds. Do you think that the minimum and maximum response time, such a large deviation, can make the average value itself unreliable?
If we use Excel to count the response time of each request, we will find that the probability of the maximum value is only one thousandth or even one ten thousandth, and the response time of the remaining 99% of user requests is in within the bounds defined by the performance requirements. Therefore, in order to more accurately measure the time-consuming situation of the overall request, in addition to the average response time, there are also 90% Line, 95% Line, and 99% Line to assist statistics.
To summarize, the meaning of percentiles in aggregation reports:
- Median: Median, the response time of 50% of users is less than this value, pay attention to the difference between it and Average average response time.
- 90% Line: The response time of 90% of users is less than this value.
- 95% Line: The response time of 95% of users is less than this value.
- 99% Line: The response time of 99% of users is less than this value.
(2) Throughput Description
Throughput (QPS): By default, it means the number of completed requests per second.
Misunderstanding: Take the throughput value as the value of the number of transactions processed by the server per second (TPS).
Some students often directly regard the throughput in the aggregation report as TPS, which is quite imprecise.
So under what circumstances can the throughput in the aggregation report be regarded as TPS?
Strictly speaking, the transaction success rate is 100% (a complete transaction).
Another situation is that the transaction failure rate is within your acceptable range, that is, it has little effect on the overall results of the current test and can be ignored.
Finally, I would like to thank everyone who has read my article carefully. Reciprocity is always necessary. Although it is not a very valuable thing, you can take it away if you need it:

These materials should be the most comprehensive and complete preparation warehouse for [software testing] friends. This warehouse has also accompanied tens of thousands of test engineers through the most difficult journey, and I hope it can help you! Partners can click the small card below to receive