Temporarily interrupt the topic of filtering, and insert an article on the implementation of EMD in python.
This article is Mr. Kanhai: This article will let you understand Empirical Mode Decomposition (EMD) - a companion article of the implementation method of EMD in MATLAB , that is, to implement EMD decomposition and draw pictures in python.
1. Use PyEMD to realize EMD decomposition and drawing
In the python environment, the PyEMD package is easier to use. PyEMD not only contains the EMD decomposition method, but also includes EEMD and CEEMDAN, and the way to draw simple pictures.
The official documentation for PyEMD is here: Intro - PyEMD 0.2.13 documentation
1.1 Install the package
The easiest way to install is to use pip to install, which is to execute in the command line window:
pip install EMD-signalNote that it is not pip install PyEMD
In addition, there is another way to manually download the source code for installation. The specific method is in the official document above, so I won’t introduce it in detail here. In most cases, using pip to install will do.
1.2 Import Toolkit
Next, you can write python scripts. First, you need to import the PyEMD toolkit (and the matplotlib to be used later. If it is not installed, you need to execute it in the command line window: pip install Matplotlib):
from PyEMD import EMD
import pylab as plt
Generate a random signal:
import numpy  as np
s = np.random.random(100)
Perform EMD decomposition:
emd = EMD()
IMF = emd.emd(s)
The toolkit has a built-in Visualization visualization tool, but it is not particularly easy to use. Here, Matplotlib is used to draw pictures.
The official provides a drawing program:
N = IMF.shape[0]+1

# Plot results
plt.subplot(N,1,1)
plt.plot(t, s, 'r')
plt.title("Input signal")
plt.xlabel("Time [s]")

for n, imf in enumerate(IMF):
    plt.subplot(N,1,n+2)
    plt.plot(t, imf, 'g')
    plt.title("IMF "+str(n+1))
    plt.xlabel("Time [s]")

plt.tight_layout()
plt.savefig('simple_example')
plt.show()
Draw it like this:
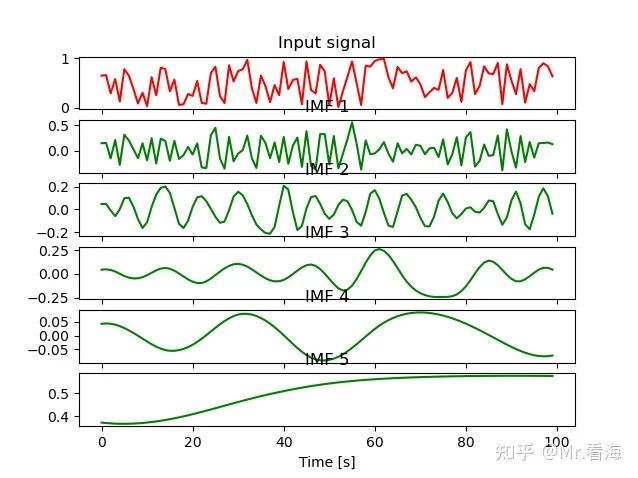
How to say, a little unsatisfactory. The title of the sub-image drawn by python shows some small bugs, we can move it to the left, and according to the convention, we can change the name of the last component to res.
Second, the rapid realization of drawing
Based on the above code, we encapsulated it again to achieve the purpose of "one line of code" drawing. Because we had a series of methods for drawing with MATLAB's "EMD-like" decomposition method, here we serve as a companion article, and we are consistent with it in terms of drawing style.
For example, to draw the time-domain image of EMD decomposition, you only need to call this sentence:
imf = funEMD.pEMD(data,t) #t为数据的时间轴,第二个入口参数也可以输入采样频率fs,会自动计算时间轴The picture drawn is like this:
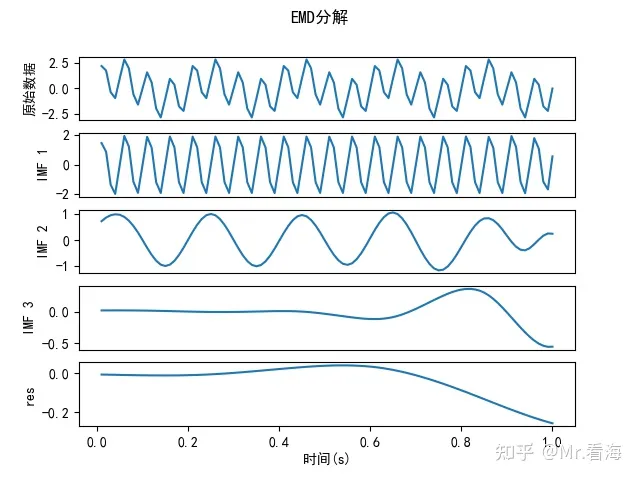
Is this more in line with habit?
In addition, you can also draw a comparison diagram between the time domain and the frequency domain, and you only need to call such a code:
imf = funEMD.pEMDandFFT(data,t) #t为数据的时间轴,第二个入口参数也可以输入采样频率fs,会自动计算时间轴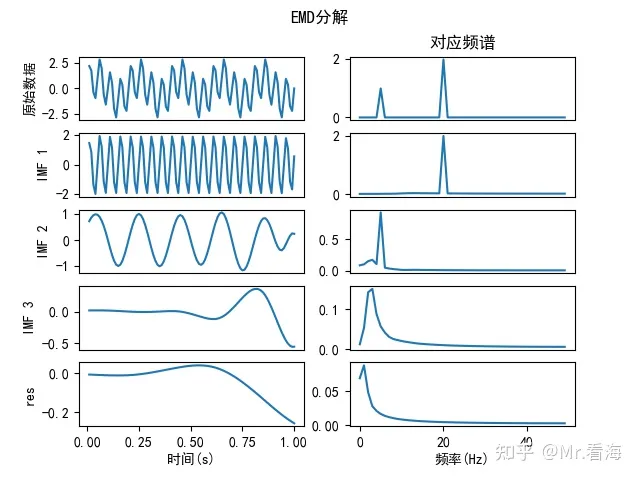
Of course, if you directly copy the above two lines of code, you will not be able to draw the picture, because the operation of the above code also depends on some programs and environments, but overall it is relatively simple and easy to use.
It should be noted that the analysis object signal used in the picture above is the same as in the MATLAB article, but the decomposition results are not the same. Although the principle of EMD decomposition is relatively clear, there are many specific calculation processes involved in the specific programming implementation process, such as the calculation of the envelope, the selection of the stop criterion, etc., in which changes in parameters or calculation methods will affect In the final result, the EMD implementations of MATLAB and python are two different libraries, and there are inevitably differences in these details (even if there are differences between the official library and the third-party library used on MATLAB), so use python It is a normal phenomenon that the result obtained by EMD decomposition with MATLAB is different.
If you want to get the encapsulation drawing function and application cases above, you can get it from the link below:
EMD drawing tool (python version) | toolbox documentation
3. Cross-platform python completion plan
Since the topic of filtering is finished, the topic of neural network is ready to be officially started. Among them, the content about classification and prediction is planned to introduce the implementation methods on the two platforms of MATLAB and python. Considering that the previous columns are basically programmed using MATLAB, so Xiaobian The editor will start the python completion plan. For the EMD-like decomposition, feature extraction, noise reduction, etc. that have been implemented before, the specific code implementation in python will be gradually improved. I hope to keep the students in need.
Welcome to continue to pay attention to my column related to signal processing .