Abstract: This article mainly explains how to take special processing in the kernel to ensure that the operation cannot be interrupted. Theoretically, the memory (dynamic_used_memory) used by the SQL executed by the user will not exceed the memory of max_dynamic_memory in a large range
This article is shared from Huawei Cloud Community " Gaussdb (DWS) Memory Error Troubleshooting Method ", author: fightingman.
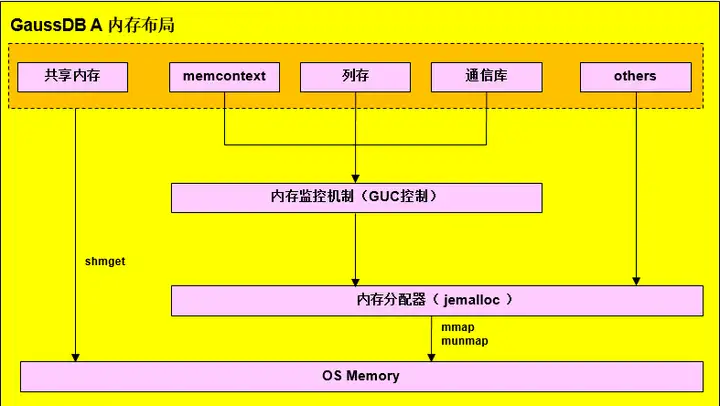
Gaussdb memory layout
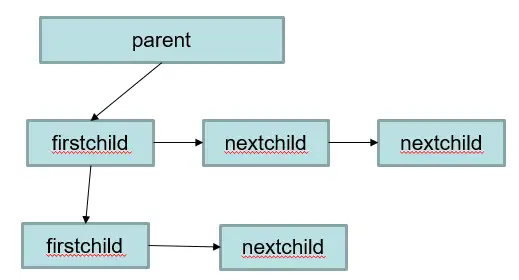
memory context memoryContext memory structure
1. Memory problem location method
Analysis scenario 1: ERROR: memory is temporarily unavailable appears in the database log
From the error message, you can find out which node has insufficient memory, for example, dn_6003_6004: memory is temporarily unavailable, this means that the memory of dn_6003 is insufficient
1. From log analysis
Observe the log corresponding to the dn, whether it is "reaching the database memory limitation", which means that it is caused by the protection of the logical memory management mechanism of the database, and the view of the database needs to be further analyzed; if it is "reaching the OS memory limitation", it means that the memory allocation of the operating system If it fails, you need to check the operating system parameter configuration and memory hardware conditions.
1) Example of reaching the database memory limitation
----debug_query_id=76279718689098154, memory allocation failed due to reaching the database memory limitation. Current thread is consuming about 10 MB, allocating 240064 bytes.
----debug_query_id=76279718689098154, Memory information of whole process in MB:max_dynamic_memory: 18770, dynamic_used_memory: 18770, dynamic_peak_memory: 18770, dynamic_used_shrctx: 1804, dynamic_peak_shrctx: 1826, max_sctpcomm_memory: 4000, sctpcomm_used_memory: 1786, sctpcomm_peak_memory: 1786, comm_global_memctx: 0, gpu_max_dynamic_memory: 0, gpu_dynamic_used_memory: 0, gpu_dynamic_peak_memory: 0, large_storage_memory: 0, process_used_memory: 22105, cstore_used_memory: 1022, shared_used_memory: 2605, other_used_memory: 0, os_totalmem: 257906, os_freemem: 16762.
At this time, job 76279718689098154 is about to apply for 240064 bytes of memory, and the dynamic_used_memory memory value is 18770MB. The sum of the two is greater than max_dynamic_memory (18770MB), which exceeds the database limit, and the memory application fails.
The version after 811 will also print the top3 memoryContext memory usage, the example is as follows
----debug_query_id=72339069014641088, sessId: 1670914731.140604465997568.coordinator1, sessType: postgres, contextName: ExprContext, level: 5, parent: FunctionScan_140604465997568, totalSize: 950010640, freeSize: 0, usedSize: 950010640
----debug_query_id=72339069014641053, pid=140604465997568, application_name=gsql, query=select * from pv_total_memory_detail, state=retrying, query_start=2022-12-13 14:59:22.059805+08, enqueue=no waiting queue, connection_info={"driver_name":"gsql","driver_version":"(GaussDB 8.2.0 build bc4cec20) compiled at 2022-12-13 14:45:14 commit 3629 last mr 5138 debug","driver_path":"/data3/x00574567/self/gaussdb/mppdb_temp_install/bin/gsql","os_user":"x00574567"}
----debug_query_id=72339069014641088, sessId: 1670914731.140604738627328.coordinator1, sessType: postgres, contextName: ExprContext, level: 5, parent: FunctionScan_140604738627328, totalSize: 900010080, freeSize: 0, usedSize: 900010080
----debug_query_id=72339069014641057, pid=140604738627328, application_name=gsql, query=select * from pv_total_memory_detail, state=retrying, query_start=2022-12-13 14:59:22.098775+08, enqueue=no waiting queue, connection_info={"driver_name":"gsql","driver_version":"(GaussDB 8.2.0 build bc4cec20) compiled at 2022-12-13 14:45:14 commit 3629 last mr 5138 debug","driver_path":"/data3/x00574567/self/gaussdb/mppdb_temp_install/bin/gsql","os_user":"x00574567"}
----debug_query_id=72339069014641088, sessId: 1670914731.140603779163904.coordinator1, sessType: postgres, contextName: ExprContext, level: 5, parent: FunctionScan_140603779163904, totalSize: 890009968, freeSize: 0, usedSize: 890009968
----debug_query_id=72339069014641058, pid=140603779163904, application_name=gsql, query=select * from pv_total_memory_detail, state=retrying, query_start=2022-12-13 14:59:22.117463+08, enqueue=no waiting queue, connection_info={"driver_name":"gsql","driver_version":"(GaussDB 8.2.0 build bc4cec20) compiled at 2022-12-13 14:45:14 commit 3629 last mr 5138 debug","driver_path":"/data3/x00574567/self/gaussdb/mppdb_temp_install/bin/gsql","os_user":"x00574567"}
----allBackendSize=34, idleSize=7, runningSize=7, retryingSize=20
Explanation of important fields:
sessId: thread start time + thread ID (string information is timestamp.threadid)
sessType: thread name
contextName: memoryContext name
totalSize: memory usage size, unit Byte
freeSize: the total amount of memory released by the current memoryContext, in Byte
usedSize: the total amount of memory used by the current memoryContext, in Byte
application_name: the name of the application connected to this backend
query: query statement
enqueue: queuing status
allBackendSize: total number of threads, idleSize: number of idle threads, runningSize: number of active threads, retryingSize: number of retried threads
The database will also check in the complex job to see if the estimated memory of the complex job exceeds the actual memory used, and if so, print the following information for analysis.
----debug_query_id=76279718689098154, Total estimated Memory is 15196 MB, total current cost Memory is 16454 MB, the difference is 1258 MB.The count of complicated queries is 17 and the count of uncontrolled queries is 1.The above information indicates that all complex jobs are expected to use 15196 MB of memory, but the actual usage is 16454 MB, exceeding 1258 MB.
There are 17 complex jobs, one of which actually uses more memory than expected.
----debug_query_id=76279718689098154, The abnormal query thread id 140664667547392.It current used memory is 13618 MB and estimated memory is 1102 MB.It also is the query which costs the maximum memory.The above information shows that the abnormal thread ID is 140664667547392, and the estimated memory consumption of this thread is 1102MB, but the actual memory consumption is 13618MB.
----debug_query_id=76279718689098154, It is not the current session and beentry info : datid<16389>, app_name<cn_5001>, query_id<76279718688746485>, tid<140664667547392>, lwtid<173496>, parent_tid<0>, thread_level<0>, query_string<explainperformance with ws as (select d_year AS ws_sold_year, ws_item_sk, ws_bill_customer_sk ws_customer_sk, sum(ws_quantity) ws_qty, sum(ws_wholesale_cost) ws_wc, sum(ws_sales_price) ws_sp from web_sales left join web_returns on wr_order_number=ws_order_number and ws_item_sk=wr_item_sk join date_dim on ws_sold_date_sk = d_date_sk where wr_order_number is null group by d_year, ws_item_sk, ws_bill_customer_sk ), cs as (select d_year AS cs_sold_year, cs_item_sk, cs_bill_customer_sk cs_customer_sk, sum(cs_quantity) cs_qty, sum(cs_wholesale_cost) cs_wc, sum(cs_sales_price) cs_sp from catalog_sales left join catalog_returns on cr_order_number=cs_order_number and cs_item_sk=cr_item_sk join date_dim on cs_sold_date_sk =d_date_sk where cr_order_number is null group by d_year, cs_item_sk, cs_bill_customer_sk ), ss as (select d_year AS ss_sold_year, ss_item_sk, ss_customer_sk, sum(ss_quantity) ss_qty, sum(ss_wholesale_cost) ss_wc, sum(ss_sales_price) ss_spfrom store_sales left join store_returns on sr_ticket_numbe>.The above information further displays the sql information of the job information whose memory usage exceeds the estimated memory, where datid indicates the OID of the database, app_name indicates the application name, and query_string indicates the query sql.
----debug_query_id=76279718689098154, WARNING: the common memory context 'HashContext' is using 1059 MB size larger than 989 MB.----debug_query_id=76279718689098154, WARNING: the common memory context 'VecHashJoin_76279718688746485_6' is using 12359 MB size larger than 10 MB.The above information indicates that the memcontext exceeds the limit. In the query No. 76279718689098154, the maximum value of the memory context preset value is 989MB, and 1059 MB is actually used.
2)reaching the OS memory limitation
When the memory usage of GaussDB conforms to the relevant parameter limit in GUC, but the available memory of the operating system is insufficient, a log message similar to that in 1.1 will appear, and the format is as follows
----debug_query_id=%lu, FATAL: memory allocation failed due to reaching the OS memory limitation. Current thread is consuming about %d MB, allocating %ld bytes.
----debug_query_id=%lu, Please check the sysctl configuration and GUC variable max_process_memory.
----debug_query_id=%lu, Memory information of whole process in MB:"
                            "max_dynamic_memory: %d, dynamic_used_memory: %d,
dynamic_peak_memory: %d, dynamic_used_shrctx: %d,
dynamic_peak_shrctx: %d, max_sctpcomm_memory: %d,
sctpcomm_used_memory: %d, sctpcomm_peak_memory: %d,
comm_global_memctx: %d, gpu_max_dynamic_memory: %d,
gpu_dynamic_used_memory: %d,
gpu_dynamic_peak_memory: %d, large_storage_memory: %d,
process_used_memory: %d, cstore_used_memory: %d,
shared_used_memory: %d, other_used_memory: %d,
os_totalmem: %d, os_freemem: %d
Among them, os_totalmem is the total memory in the current OS, that is, the total information in the "free" command. os_freemem is the available memory in the current OS, that is, the free information in the "free" command.
If the memory to be requested in "allocating %ld bytes" in the first log is greater than the "os_freemem" item in the third log, and the database can run without other abnormalities, it is as expected, indicating that the OS memory is insufficient.
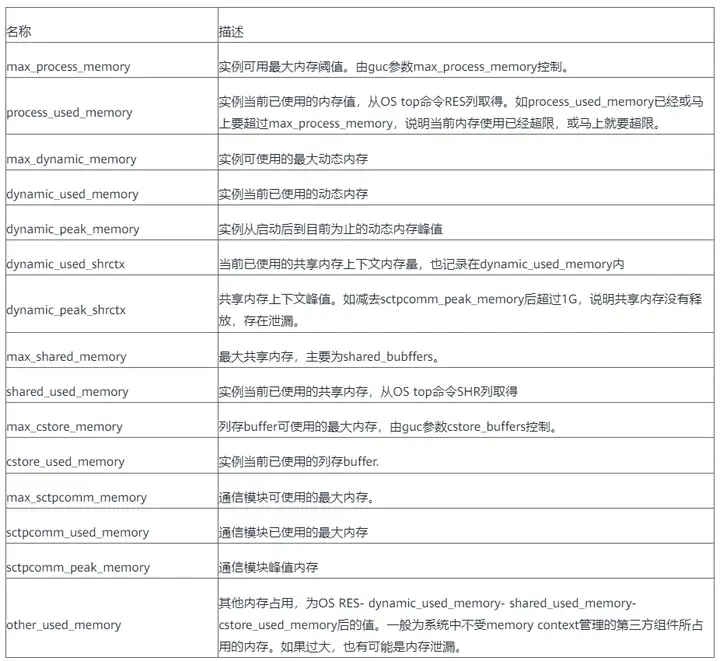
2. For the memory usage of each instance, query pgxc_total_memory_detail
After the memory error is reported, the memory used by the statement will be released. At that time, the statement that occupied a lot of memory may be lost due to the error report, and the query memory view cannot be queried.
with a as (select *from pgxc_total_memory_detail where memorytype='dynamic_used_memory'), b as(select * from pgxc_total_memory_detail wherememorytype='dynamic_peak_memory'), c as (select * from pgxc_total_memory_detailwhere memorytype='max_dynamic_memory'), d as (select * frompgxc_total_memory_detail where memorytype='process_used_memory'), e as (select* from pgxc_total_memory_detail where memorytype='other_used_memory'), f as(select * from pgxc_total_memory_detail where memorytype='max_process_memory')select a.nodename,a.memorymbytes as dynamic_used_memory,b.memorymbytes asdynamic_peak_memory,c.memorymbytes as max_dynamic_memory,d.memorymbytes asprocess_used_memory,e.memorymbytes as other_used_memory,f.memorymbytes asmax_process_memory from a,b,c,d,e,f where a.nodename=b.nodename andb.nodename=c.nodename and c.nodename=d.nodename and d.nodename=e.nodename ande.nodename=f.nodename order by a.nodename;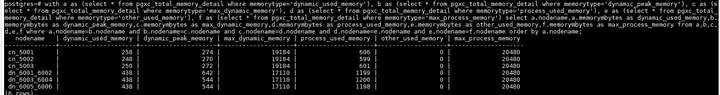
When querying this view, it may report memory is temporarily unavailable due to insufficient memory, causing the view to be unavailable. In this case, you need to set disable_memory_protect to off.
set disable_memory_protect=off; After that, no error will be reported when querying the view.
Through the above view, you can find which node in the cluster has abnormal memory usage, and then connect to that node to find the problematic memory context through the pv_session_memory_detail view.
SELECT * FROM pv_session_memory_detail ORDER BY totalsize desc LIMIT 100;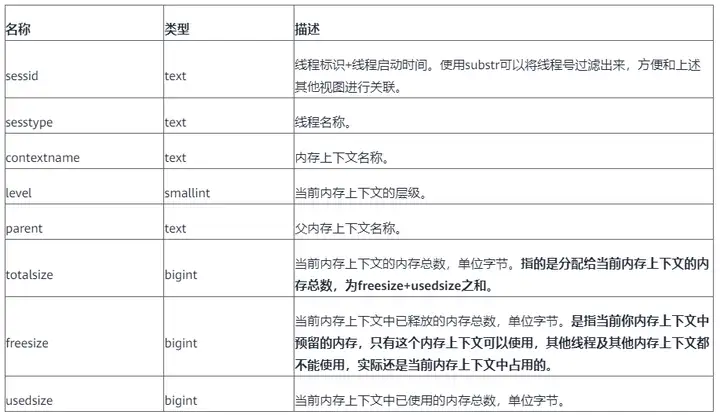
Combined with the pg_stat_activity view, you can find which statement uses the most memcontext.
select sessid, contextname, level,parent, pg_size_pretty(totalsize) as total ,pg_size_pretty(freesize) as freesize, pg_size_pretty(usedsize) as usedsize, datname,query_id, query from pv_session_memory_detail a , pg_stat_activity b where split_part(a.sessid,'.',2) = b.pid order by totalsize desc limit 100;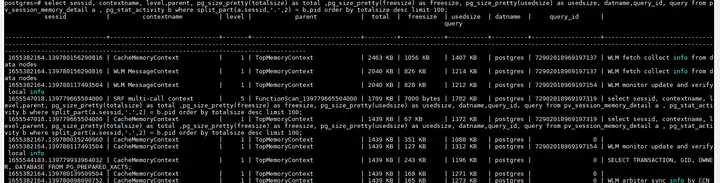
emergency recovery
EXECUTE DIRECT ON(cn_5001) 'SELECT pg_terminate_backend(139780156290816)';2. Analysis of scenarios with high memory usage
1. Too many idle connections lead to memory usage
First confirm which instance has a high memory usage. The confirmation method is as above to query pgxc_total_memory_detail, and then connect to the cn or dn to query the following sql
select b.state, sum(totalsize) as totalsize, sum(freesize) as freesize, sum(usedsize) as usedsize from pv_session_memory_detail a , pg_stat_activity b where split_part(a.sessid,'.',2) = b.pid group by b.state order by totalsize desc limit 100;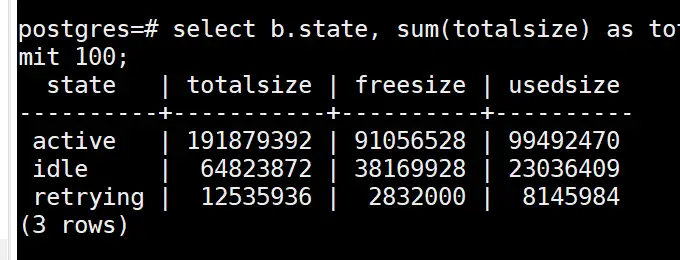
If the totalsize in the idle state in the above figure takes up a lot of memory, you can try to clean up the idle connections in the idle state to release the memory
Solution: Clean up idle connections in idle state
CLEAN CONNECTION TO ALL FORCE FOR DATABASE xxxx;clean connection can only clean up the idle connections whose in_used state is f in pg_pooler_status, but cannot clean up the connections whose in_used state is t. In_used is t. Generally, the pbe statement is executed and the idle connections of cn and dn cannot be released.
If the above method cannot be cleaned up, you can only try to clean up the connection between cn and the client, and then execute clean connection to clean up the connection between cn and dn, you can try to find an idle connection on cn, this operation will break cn To connect with the client, you need to confirm with the client whether it can be executed
select 'execute direct on ('||coorname||') ''select pg_terminate_backend('||pid||')'';' from pgxc_stat_activity where usename not in ('Ruby', 'omm') and state='idle';Execute the results of select in sequence.
2. The statement occupies too much memory. If the first statement in the first step queries the statement in the active state and occupies a large amount of memory, it means that the memory occupied by the statement being executed is caused by too much memory.
Query the statement below to find the statement that takes up a lot of memory
select b.state as state, a.sessid as sessid, b.query_id as query_id, substr(b.query,1,100) as query, sum(totalsize) as totalsize, sum(freesize) as freesize, sum(usedsize) as usedsize from pv_session_memory_detail a , pg_stat_activity b where split_part(a.sessid,'.',2) = b.pid and usename not in ('Ruby', 'omm') group by state,sessid,query_id,query order by totalsize desc limit 100;After finding the statement, search and kill the abnormal sql on the corresponding cn according to the query_id
3. dynamic_used_shrctx uses more memory
dynamic_used_shrctx is the memory used by the shared memory context, which is also divided by MemoryContext and shared between threads. View through pg_shared_memory_detail view
select * from pg_shared_memory_detail order by totalsize desc limit 10;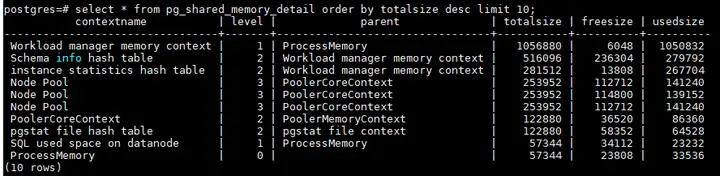
Generally, the allocation of shared memory context is related to the statement. The contextname will have the thread number or query_id, and the abnormal sql will be checked and killed according to the query_id or thread number. In addition, the shared memory context is generally the memory used by each module in the kernel, such as topsql. It is necessary to check whether the memory usage is reasonable and the release mechanism.
4. In the memory view pv_total_memory_detail, dynamic_used_memory > max_dynamic_memory
1) When the GUC parameter disable_memory_protect is on
2) When allocating memory, debug_query_id is 0
3) When the kernel executes key code segments
4) Memory allocation within the kernel Postmaster thread
5) In the transaction rollback phase
The above situations are all special treatments taken by the kernel to ensure that the operation cannot be interrupted. In theory, the memory (dynamic_used_memory) used by the SQL executed by the user will not exceed the memory of max_dynamic_memory on a large scale.
Click to follow and learn about Huawei Cloud's fresh technologies for the first time~