Regarding the monitoring of Docker containers, google cAdvisor is a good tool, but it only displays real-time data by default, and does not store historical data. In order to store and display historical data and customize the display graph, you can integrate cAdvisor with InfluxDB and Grafana. Brian Christner, a foreign expert, wrote an article "How to setup Docker Monitoring" , which describes the deployment method.
Brian's method is to manually run the docker run command to deploy. In order to automatically deploy on the Mesos Marathon platform, I have made some modifications to his method. The following is my deployment process.
Note:
Readers need to understand the basic operations of mesos, marathon, InfluxDB and especially Grafana in advance.
1. Set up shared storage
In order to achieve persistent storage of InfluxDB database and Grafana configuration, so that they will not lose historical data after redeployment, I enabled nfs4 as shared storage, and put the /data directory in the InfluxDB container and the /var/lib/grafana directory in the Grafana container. Mapped to nfs4 shared storage.
1.1 nfs4 server:
/ var / nfsshare 172.31.17.0/24(rw,sync,no_root_squash,no_all_squash)
1.2 months slaves
172.31.17.74:/var/nfsshare/ / var / nfsshare / nfs defaults 0 0
2. Pull the image file
Pull the following images on each mesos slave:
attitude/influxdb
google/cadvisor
grafana / grafana
3. Set DNS or hosts
172.31.17.34 influxdb.gkkxd.com
172.31.17.34 cadvisor-1.gkkxd.com
172.31.17.34 cadvisor-2.gkkxd.com
172.31.17.34 cadvisor-3.gkkxd.com
172.31.17.34 grafana.gkkxd.com
4. Deploy InfluxDB
- InfluxDB only needs one instance;
- The UI is distributed through the virtual host of marathon-lb;
- The data port 8086 is published to the slaves where marathon-lb is located through servicePort;
- servicePort needs to be set to a fixed value, such as: 28086, so that cAdvisor and Grafana can connect;
- The data directory /data is mapped to the nfs4 shared directory;
{
  "id": "influxdb",
  "instances": 1,
  "cpus": 0.5,
  "mem": 128,
  "constraints": [["hostname", "LIKE", "slave[1-3]"]],
  "labels": {
    "HAPROXY_GROUP":"external",
    "HAPROXY_0_VHOST":"influxdb.gkkxd.com"
  },
  "container": {
    "type": "DOCKER",
    "docker": {
      "image": "172.31.17.36:5000/influxdb:latest",
      "network": "BRIDGE",
      "portMappings": [
        { "containerPort": 8083, "hostPort": 0, "servicePort": 0, "protocol": "tcp" },
        { "containerPort": 8086, "hostPort": 0, "servicePort": 28086, "protocol": "tcp" }
      ]
    },
    "volumes": [
      {
        "containerPath": "/etc/localtime",
        "hostPath": "/etc/localtime",
        "mode": "RO"
      },
      {
        "containerPath": "/data",
        "hostPath": "/var/nfsshare/influxdb",
        "mode": "RW"
      }
    ]
  }
}
设置marathon-lb所在主机的防火墙:
{
  "id": "influxdb-fw",
  "instances": 2,
  "cpus": 0.2,
  "mem": 64,
  "cmd": "firewall-cmd --add-port=28086/tcp && sleep 3 && curl -X DELETE master1:8080/v2/apps/influxdb-fw",
  "constraints": [["hostname", "LIKE", "slave[4-5]"]]
}
5. 创建监控数据库
打开 http://influxdb.gkkxd.com ,设置 Host 和 Port 分别为 influxdb.gkkxd.com 和 28086:
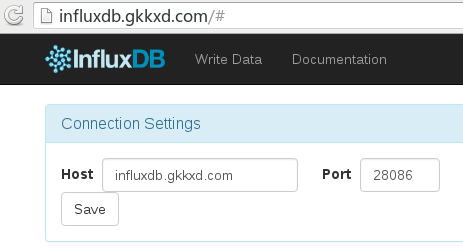
为每个mesos slave创建一个单独的数据库,分别为:cadvisor_1, cadvisor_2, cadvisor_3 ...

6. 部署 cAdvisor
- 每个mesos slave都要部署一个实例;
- UI 通过marathon-lb的虚拟主机发布;
- 设置 storage_drive 为 influxdb;
{
  "id": "cadvisor-6",
  "instances": 1,
  "cpus": 0.5,
  "mem": 128,
  "constraints": [["hostname", "LIKE", "slave[6]"]],
  "labels": {
    "HAPROXY_GROUP":"external",
    "HAPROXY_0_VHOST":"cadvisor-6.gkkxd.com"
  },
  "container": {
    "type": "DOCKER",
    "docker": {
      "image": "172.31.17.36:5000/cadvisor:latest",
      "network": "BRIDGE",
      "portMappings": [
        { "containerPort": 8080, "hostPort": 0, "servicePort": 0, "protocol": "tcp" }
      ]
    },
    "volumes": [
      {
        "containerPath": "/etc/localtime",
        "hostPath": "/etc/localtime",
        "mode": "RO"
      },
      {
        "containerPath": "/rootfs",
        "hostPath": "/",
        "mode": "RO"
      },
      {
        "containerPath": "/var/run",
        "hostPath": "/var/run",
        "mode": "RW"
      },
      {
        "containerPath": "/sys",
        "hostPath": "/sys",
        "mode": "RO"
      },
      {
        "containerPath": "/var/lib/docker",
        "hostPath": "/var/lib/docker",
        "mode": "RO"
      },
      {
        "containerPath": "/cgroup",
        "hostPath": "/cgroup",
        "mode": "RO"
      }
    ]
  },
  "args": [
     "-storage_driver", "influxdb",
     "-storage_driver_host", "cadvisor.gkkxd.com:28086",
     "-storage_driver_db", "cadvisor_6"
  ]
}
查看cAdvisor UI:
http://cadvisor-6.gkkxd.com
7. 部署 Grafana
- 只需要部署一个实例;
- UI 通过 marathon-lb 虚拟主机发布;
- 数据目录 /var/lib/grafana 映射到 nfs4 共享存储,以便于持久化存储;
{
  "id": "grafana",
  "instances": 1,
  "cpus": 0.5,
  "mem": 128,
  "constraints": [["hostname", "LIKE", "slave[4-5]"]],
  "labels": {
    "HAPROXY_GROUP":"external",
    "HAPROXY_0_VHOST":"grafana.gkkxd.com"
  },
  "container": {
    "type": "DOCKER",
    "docker": {
      "image": "172.31.17.36:5000/grafana:latest",
      "network": "BRIDGE",
      "portMappings": [
        { "containerPort": 3000, "hostPort": 0, "servicePort": 0, "protocol": "tcp" }
      ]
    },
    "volumes": [
      {
        "containerPath": "/etc/localtime",
        "hostPath": "/etc/localtime",
        "mode": "RO"
      },
      {
        "containerPath": "/var/lib/grafana",
        "hostPath": "/var/nfsshare/grafana",
        "mode": "RW"
      }
    ]
  }
}
8. 创建数据分析图
打开 Grafana UI:
http://grafana.gkkxd.com/
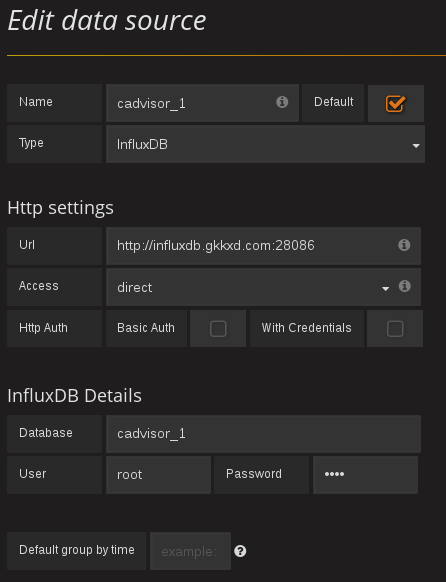
8.1 设置数据源:
- 类型:InfluxDB
- URL:http://influxdb.gkkxd.com:28086
- Access:direct
- Database:选择一个slave的数据库,如:cadvisor_1
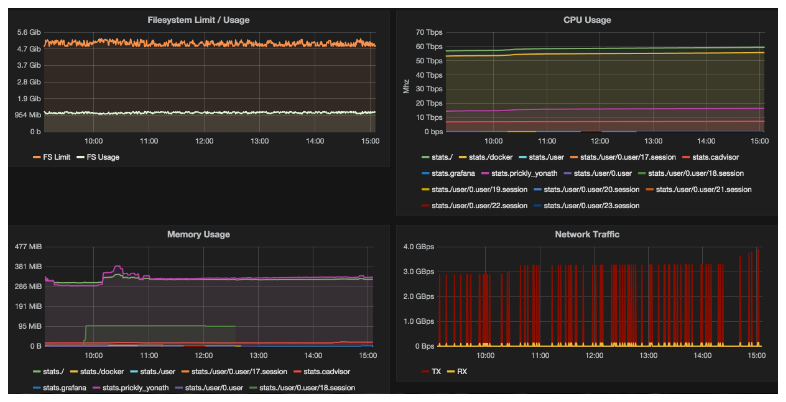
创建graph:
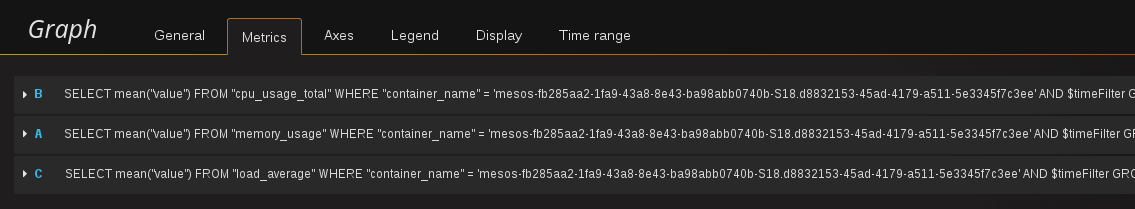
效果图:
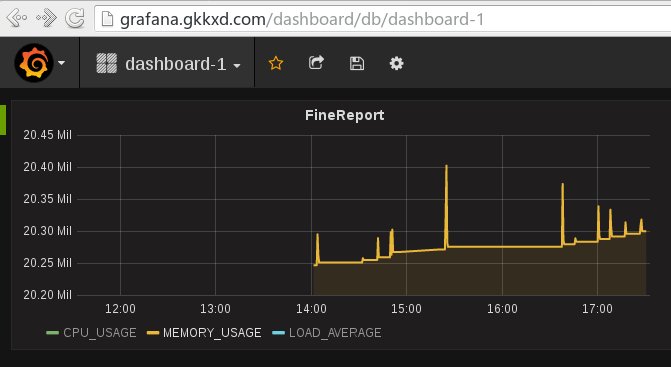
9 其他问题
9.1 怎样设置报警
可以将Prometheus集成进来,后续我将进行相关测试;
9.2 怎样在mesos上获取docker容器名
我们在 Grafana 上创建针对app实例的监控图的时候,往往需要通过 "where container_name=容器名" 的条件筛选相关的数据,但是mesos marathon部署的docker 容器名称是以mesos-uuid形式命名的(docker ps 查看),没有明显的特征可以识别。
下面的方法可以查看一个app ID对应的docker 容器名称:
打开 mesos 管理页面:
http://master1:5050
In the mesos task, click the Sandbox behind the app ID you want to find,
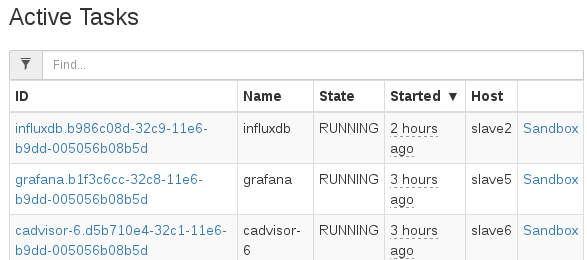
Click stdout to see the docker container name corresponding to this app ID:
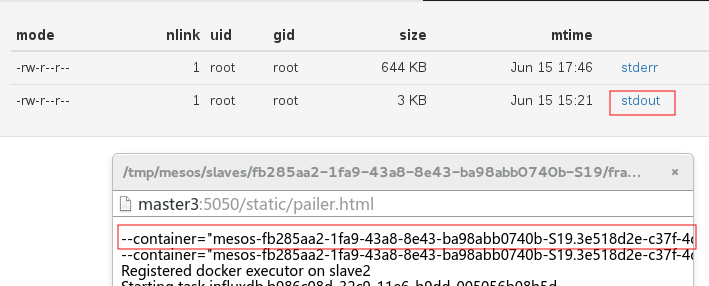
http://www.mamicode.com/info-detail-1393800.html