jstack - Prints Java thread stack traces for a Java process, core file, or remote debug server.
The main function of Jstack is to generate information about all threads in the current process, that is, the thread snapshot of the JVM at the current moment. Through the thread information, we can locate problems such as long pauses and high CPU usage in the program.
The information in the thread snapshot is the stack collection of the methods being executed by each thread in the current java virtual machine. With the stack information, we can analyze where our program problems occur, such as deadlocks between threads, external resource request time elapsed long, infinite loop, etc.
use:
jstack [ options ] pid

jstack [ options ] executable core

jstack [ options ] [ server-id@ ] remote-hostname-or-IP


OPTIONS
       -F
              Force a stack dump when jstack [-l] pid does not respond.

       -l
              Long listing. Prints additional information about locks such as a list of owned java.util.concurrent ownable synchronizers. See the
              AbstractOwnableSynchronizer class description at
              http://docs.oracle.com/javase/8/docs/api/java/util/concurrent/locks/AbstractOwnableSynchronizer.html

       -m
              Prints a mixed mode stack trace that has both Java and native C/C++ frames.
- -F Force stack information to be output when normal requests are not answered.
- -l Additional print lock information, when a deadlock occurs, you can view the lock information
- -m If you call the information of the native method stack, you can print the C/C++ stack
Take an example of a deadlock to see the information viewed using Jstack
public class Jstack {


    private static Object obj1 = new Object();
    private static Object obj2 = new Object();

    public static void main(String[] args) {


        new Thread(() -> {


            synchronized (obj1) {


                try {


                    Thread.sleep(2000);
                } catch (InterruptedException e) {


                    e.printStackTrace();
                }
                synchronized (obj2) {


                }
            }
        }).start();
        new Thread(() -> {


            synchronized (obj2) {


                try {


                    Thread.sleep(2000);
                } catch (InterruptedException e) {


                    e.printStackTrace();
                }
                synchronized (obj1) {


                }
            }
        }).start();
    }
}
In the above code, the first thread gets the lock of obj1 and waits for the lock of obj2, and the second thread gets the lock of obj2 and waits for the lock of obj1, so a deadlock will occur.
jpsFirst get the current process pid through the command, and then get the thread information through jstack. You can see that both threads are blocked.
"Thread-1" #12 prio=5 os_prio=0 tid=0x00007fdff871c800 nid=0x3cc2 waiting for monitor entry [0x00007fdfce0fc000]
   java.lang.Thread.State: BLOCKED (on object monitor)
	at com.example.demo.jstack.Jstack.lambda$main$1(Jstack.java:36)
	- waiting to lock <0x000000076e925a90> (a java.lang.Object)
	- locked <0x000000076e925aa0> (a java.lang.Object)
	at com.example.demo.jstack.Jstack$$Lambda$2/2052001577.run(Unknown Source)
	at java.lang.Thread.run(Thread.java:748)

"Thread-0" #11 prio=5 os_prio=0 tid=0x00007fdff871a800 nid=0x3cc1 waiting for monitor entry [0x00007fdfce1fc000]
   java.lang.Thread.State: BLOCKED (on object monitor)
	at com.example.demo.jstack.Jstack.lambda$main$0(Jstack.java:25)
	- waiting to lock <0x000000076e925aa0> (a java.lang.Object)
	- locked <0x000000076e925a90> (a java.lang.Object)
	at com.example.demo.jstack.Jstack$$Lambda$1/1174361318.run(Unknown Source)
	at java.lang.Thread.run(Thread.java:748)
The first line displays information such as thread name, thread priority, thread id, thread state description, etc.
The second line shows the status of the current thread
The status of threads in Java is divided into NEW, RUNNABLE, BLOCKED, WATING, TIMED_WATING, TERMINATED, but the NEW status does not appear in the snapshot.
The following is the information of the call stack of the current thread. The call stack contains lock information.
Indicates thatlocked the use of synchronized to apply for an object lock is successful, and the owner of the monitor
Indicates thatwaiting to lock the application for object lock using synchronized was unsuccessful and entered the waiting area.
Indicates thatwaiting on after successfully applying for the object lock with synchronized, the wait method is called to enter the waiting area of the object to wait.
parkparking to wait for is the basic thread blocking primitive that does not block on objects through monitors. The new mechanism that will appear with the concurrent package is different from the synchronized system.
At the end it also shows the message that there is a deadlock in the code
Found one Java-level deadlock:
=============================
"Thread-1":
  waiting to lock monitor 0x00007fdfac006638 (object 0x000000076e925a90, a java.lang.Object),
  which is held by "Thread-0"
"Thread-0":
  waiting to lock monitor 0x00007fdfac003da8 (object 0x000000076e925aa0, a java.lang.Object),
  which is held by "Thread-1"

Java stack information for the threads listed above:
===================================================
"Thread-1":
	at com.example.demo.jstack.Jstack.lambda$main$1(Jstack.java:36)
	- waiting to lock <0x000000076e925a90> (a java.lang.Object)
	- locked <0x000000076e925aa0> (a java.lang.Object)
	at com.example.demo.jstack.Jstack$$Lambda$2/2052001577.run(Unknown Source)
	at java.lang.Thread.run(Thread.java:748)
"Thread-0":
	at com.example.demo.jstack.Jstack.lambda$main$0(Jstack.java:25)
	- waiting to lock <0x000000076e925aa0> (a java.lang.Object)
	- locked <0x000000076e925a90> (a java.lang.Object)
	at com.example.demo.jstack.Jstack$$Lambda$1/1174361318.run(Unknown Source)
	at java.lang.Thread.run(Thread.java:748)

Found 1 deadlock.
Well, familiar with Jstack, we use an infinite loop of code to locate the line of code that makes the CPU occupy 100% through Jstack
public class JstackDemo {


    public static Executor executor = Executors.newFixedThreadPool(3);
    private static Object lock = new Object();

    public static void main(String[] args) {


        Task task1 = new Task();
        Task task2 = new Task();
        executor.execute(task1);
        executor.execute(task2);
    }

    public static class Task implements Runnable {


        @Override
        public void run() {


            synchronized (lock) {


                run0();
            }
        }

        private void run0() {


            int i = 0;
            while (true) {


                i++;
            }
        }
    }
}
1. First, by topviewing the process id that makes the CPU occupy 100%

2. Use to top -Hp 进程idview the thread id that occupies the most CPU

3. Convert the thread id to hexadecimal
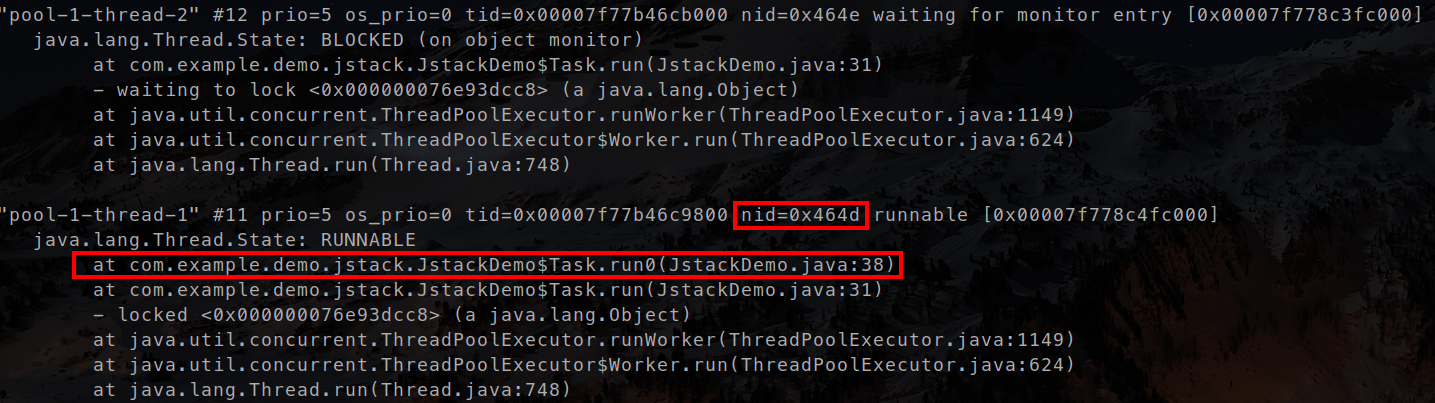
17997 -> 464d
4. Use Jstack to view the process where Java is located and find the corresponding thread