When we send important emails, in order to confirm that the other party has read it, we will set a "read receipt" label in the email to confirm when the other party reads the letter.
This pattern is very useful, for example:
- When sending a flyer, make sure the other party has read it
- How many users clicked when promoting the page
- Mobile App operation activity page to analyze user access
For such personalized collection and statistics, CNZZ, Baidu Statistics, Mobile Talking Data, Youmeng, etc. are not competent. The main difficulty is:
- Personalized requirements are difficult to meet: user-generated behaviors are not mobile scenarios, which include some operational personalized requirements fields, such as: source, channel, environment, behavior and other parameters
- Difficulty/high cost of development: In order to complete a data collection and analysis requirement, you first need to purchase cloud hosts, public network IPs, develop data receiving servers, message middleware, etc., and ensure high availability of services through mutual backup; then you need to develop services end and test
- It is not easy to use: After the data reaches the server, engineers need to clean the results and import them into the database to generate the data required for operation
- Inelasticity: The usage of users cannot be estimated, so a large resource pool needs to be reserved
From the above points, when an operational requirement for content delivery comes, how to meet such user behavior collection and analysis requirements in a very fast way is a big challenge.
The Web Tracking/JS/Tracking Pixel SDK provided by Log Service is designed to solve the above lightweight tracking point collection scenarios. We can complete tracking and data reporting within 1 minute. In addition, the log service provides a free quota of 500MB per account* per month , allowing you to do things without spending money.
Program introduction
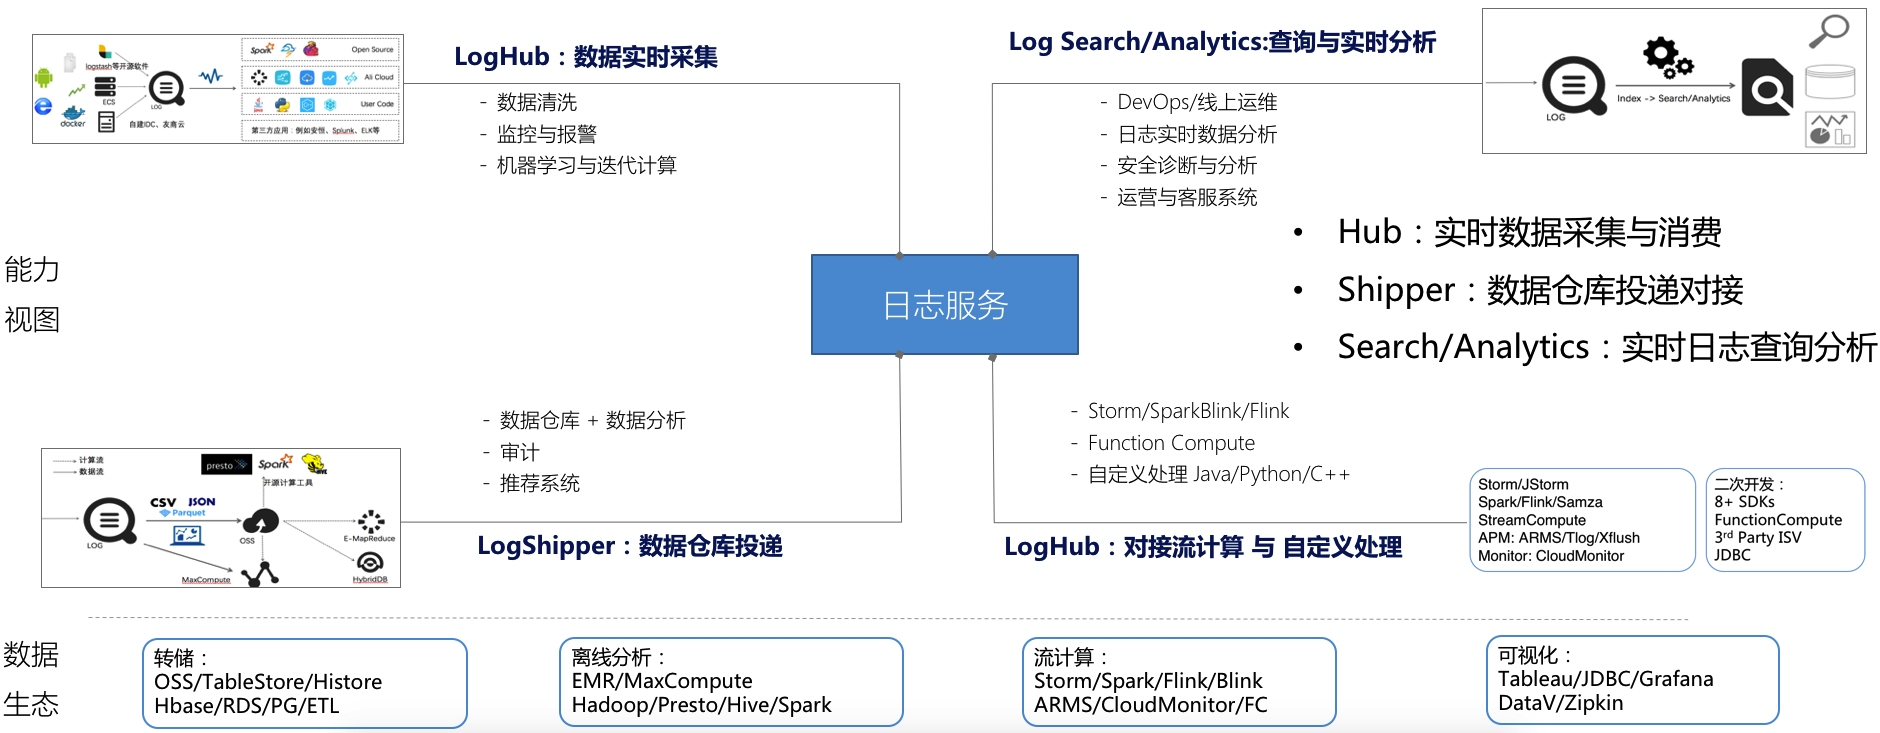
The collection + analysis solution introduced here is based on the Alibaba Cloud log service, which is a one-stop service for log data. It can quickly complete the collection, consumption, delivery, query analysis and other functions of massive log data without development. Operational efficiency. Service features include:
- LogHub: Real-time collection and consumption. Connect with Blink, Flink, Spark Streaming, Storm, and Kepler.
- Data delivery: LogShipper. Connected with MaxCompute, E-MapReduce, OSS, and FunctionCompute
- Query and real-time analysis: LogSearch/Analytics. Connect with DataV, Grafana, Zipkin, Tableua, etc.
Introduction to the collection terminal
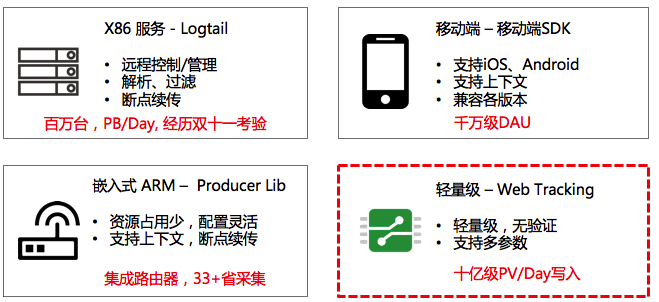
The log service provides 30+ data collection methods , and provides complete solutions for servers, mobile terminals, embedded devices and various development languages. The typical ones are:
- Logtail: Designing Agent for X86 Servers
- Android/iOS: SDK for mobile
- Producer Library: for constrained CPU/memory smart devices
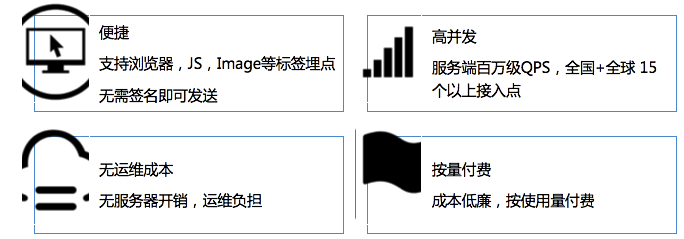
The lightweight collection solution (Web Tracking) introduced here, this solution only needs one http get request to transfer data to the Logstore side of the log service, and is suitable for various static web pages without any verification, advertisement placement, promotional materials, mobile terminals data collection. Compared with other log collection solutions, the features are as follows:
WebTracking access steps
The term Web Tracking (also called Tracking Pixel) comes from the image tag in HTML syntax: we can embed a 0 Pixel image on the page, which is invisible to the user by default. When visiting the page to display the loading image, a The Get request is sent to the server, and the parameters will be passed to the server at this time.
The steps to use Web Tracking are as follows:
- Enable the Web Tracking tab for Logstore (Logstore does not allow anonymous writing by default, and you need to enable the Web Tracking switch of Logstore before using it)
-
There are three options for writing data to Logstore by burying points:
-
Report data directly through HTTP Get
curl --request GET 'http://${project}.${sls-host}/logstores/${logstore}/track?APIVersion=0.6.0&key1=val1&key2=val2' -
By embedding the Image tag under HTML, the data is automatically reported when the page is in the mode
<img src='http://${project}.${sls-host}/logstores/${logstore}/track.gif?APIVersion=0.6.0&key1=val1&key2=val2'/> or <img src=‘http://${project}.${sls-host}/logstores/${logstore}/track_ua.gif?APIVersion=0.6.0&key1=val1&key2=val2’/> track_ua.gif除了将自定义的参数上传外,在服务端还会将http头中的UserAgent、referer也作为日志中的字段。 -
Reporting data through the Java Script SDK
<script type="text/javascript" src="loghub-tracking.js" async></script>

var logger = new window.Tracker('${sls-host}','${project}','${logstore}');
logger.push('customer', 'zhangsan');
logger.push('product', 'iphone 6s');
logger.push('price', 5500);
logger.logger();
-
For detailed steps , see the WebTracking access documentation .
Case: Multi-channel promotion of content
When we have a new content (such as new features, new activities, new games, new articles), as an operator, we can't wait to convey it to users as soon as possible, because this is the first and most important step in acquiring users step.
Take game distribution as an example:
- There is a large amount of money in the market for game promotion, for example, 1W advertisements are placed
- 2,000 people successfully loaded the ad, accounting for about 20%
- Among them, 800 people clicked
- In the end, there are very few people who download and register an account to try it out.

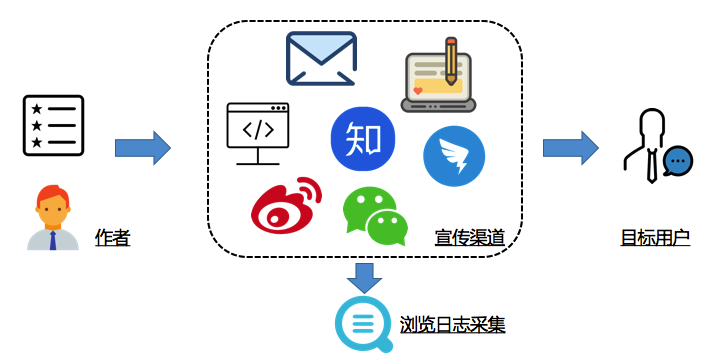
It can be seen from the above that it is very important for business to be able to obtain the effectiveness of content promotion in an accurate and real-time manner. In order to achieve the overall promotion goal, operators often choose various channels for promotion, such as:
- User site letter (Mail), official website blog (Blog), homepage copy (Banner, etc.)
- SMS, User Email, Leaflet, etc.
- Sina Weibo, DingTalk user group, WeChat public account, Zhihu forum, Toutiao and other new media
Design
- Create a Logstore (for example: myclick) in our log service and enable the WebTracking function
-
Add a label to each promotion channel for the document to be promoted (article=1001), and generate a Web Tracking tag (take the Img tag as an example), as follows:
-
Station letter channel (mailDec):
<img src="http://example.cn-hangzhou.log.aliyuncs.com/logstores/myclick/track_ua.gif?APIVersion=0.6.0&from=mailDec&article=1001" alt="" title=""> -
Official website channel (aliyunDoc):
<img src="http://example.cn-hangzhou.log.aliyuncs.com/logstores/myclick/track_ua.gif?APIVersion=0.6.0&from=aliyundoc&article=1001" alt="" title=""> -
User mailbox channel (email):
<img src="http://example.cn-hangzhou.log.aliyuncs.com/logstores/myclick/track_ua.gif?APIVersion=0.6.0&from=email&article=1001" alt="" title=""> -
其他更多渠道可以在from参数后加上,也可以在URL中加入更多需要采集的参数
-
- Put the img tag in your promotional content and you can spread the word and we can go for a walk and drink coffee
Collection log analysis
After completing the collection of buried points, we can use the LogSearch/Analytics function of the log service to perform real-time query and analysis of massive log data. In the visualization of result analysis, in addition to the built-in Dashboard , it also supports connection methods such as DataV , Grafana , Tableua, etc. Here we do some basic demonstrations:
The following is the log data collected so far, we can enter keywords in the search box to query:

You can also enter SQL for real-time analysis and visualization in seconds after querying:

In addition to analysis in the log service,
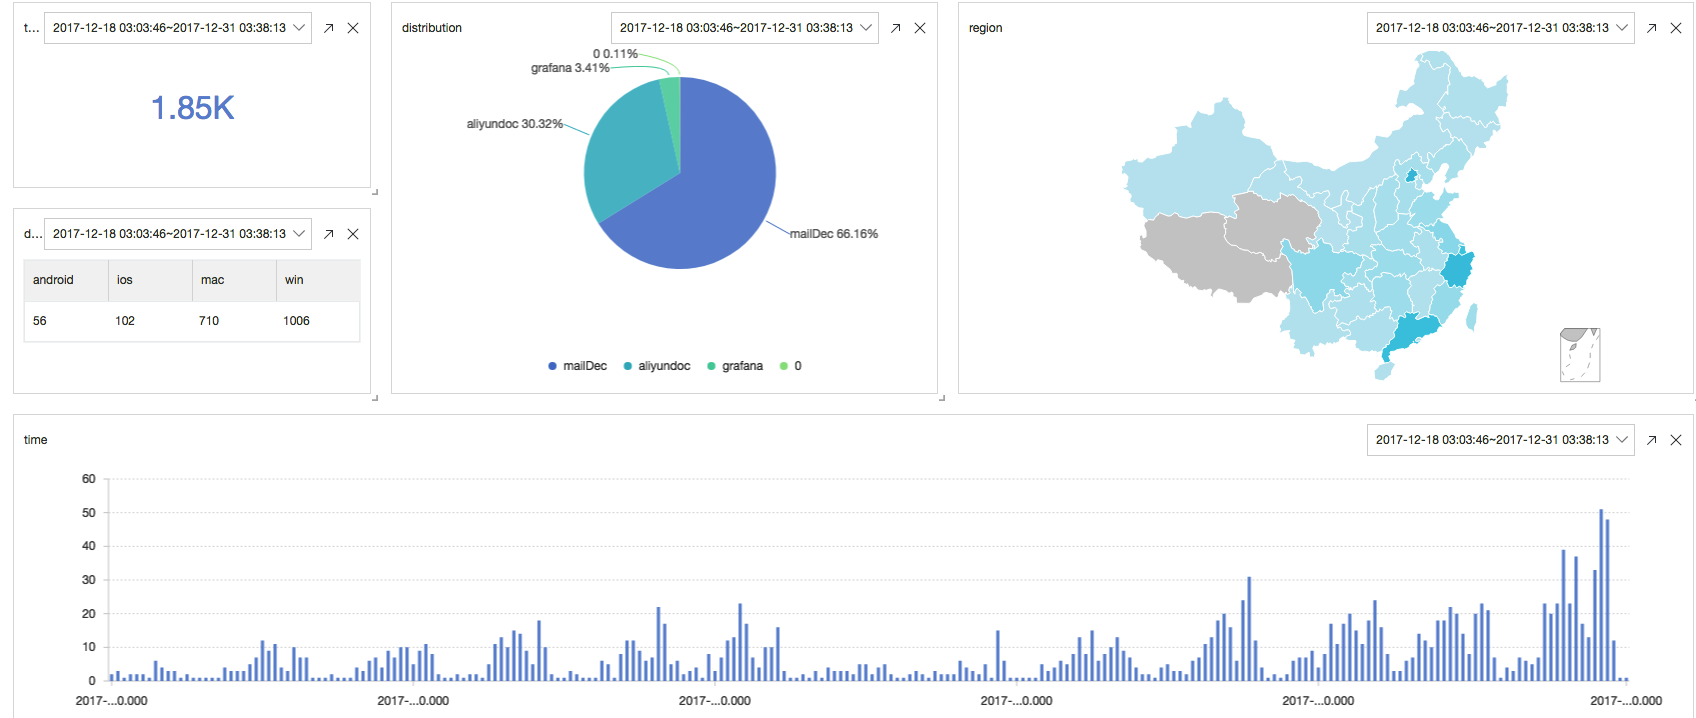
Below is our real-time analysis of user click/read logs:
- Current total traffic and readings
* | select count(1) as c- The curve of readings per hour
* | select count(1) as c, date_trunc('hour',from_unixtime(__time__)) as time group by time order by time desc limit 100000- Percentage of reads per channel
* | select count(1) as c, f group by f desc- Which devices did the readings come from?
* | select count_if(ua like '%Mac%') as mac, count_if(ua like '%Windows%') as win, count_if(ua like '%iPhone%') as ios, count_if(ua like '%Android%') as android- Which provinces and cities did the readings come from?
* | select ip_to_province(__source__) as province, count(1) as c group by province order by c desc limit 100- For more fields and analysis scenarios, see Analysis Grammar and Best Practices
Finally, these real-time data can be configured into a real-time refresh Dashboard, the effect is as follows:
write at the end
When you read this article, you can notice that there is an invisible Img tag under this line of text to record this visit, look for it :)
 Original address: http://click.aliyun.com/m/40929/