Summary: Log Service provides **SQL real-time statistical analysis function** in version 2.5, which can support real-time statistical analysis on the basis of second-level query
Log Service (formerly SLS) is a real-time storage and query service for large-scale logs. Within half a year, we gradually provide text, numerical, fuzzy, context and other query capabilities. In version 2.5, Log Service provides SQL real-time statistical analysis function , which can support real-time statistical analysis on the basis of second-level query.
Supported SQL includes: Aggregation, Group By (including Cube, Rollup), Having, Sorting, String, Date, Numerical operations, as well as statistical and scientific calculations (see Analysis Syntax ).
how to use?
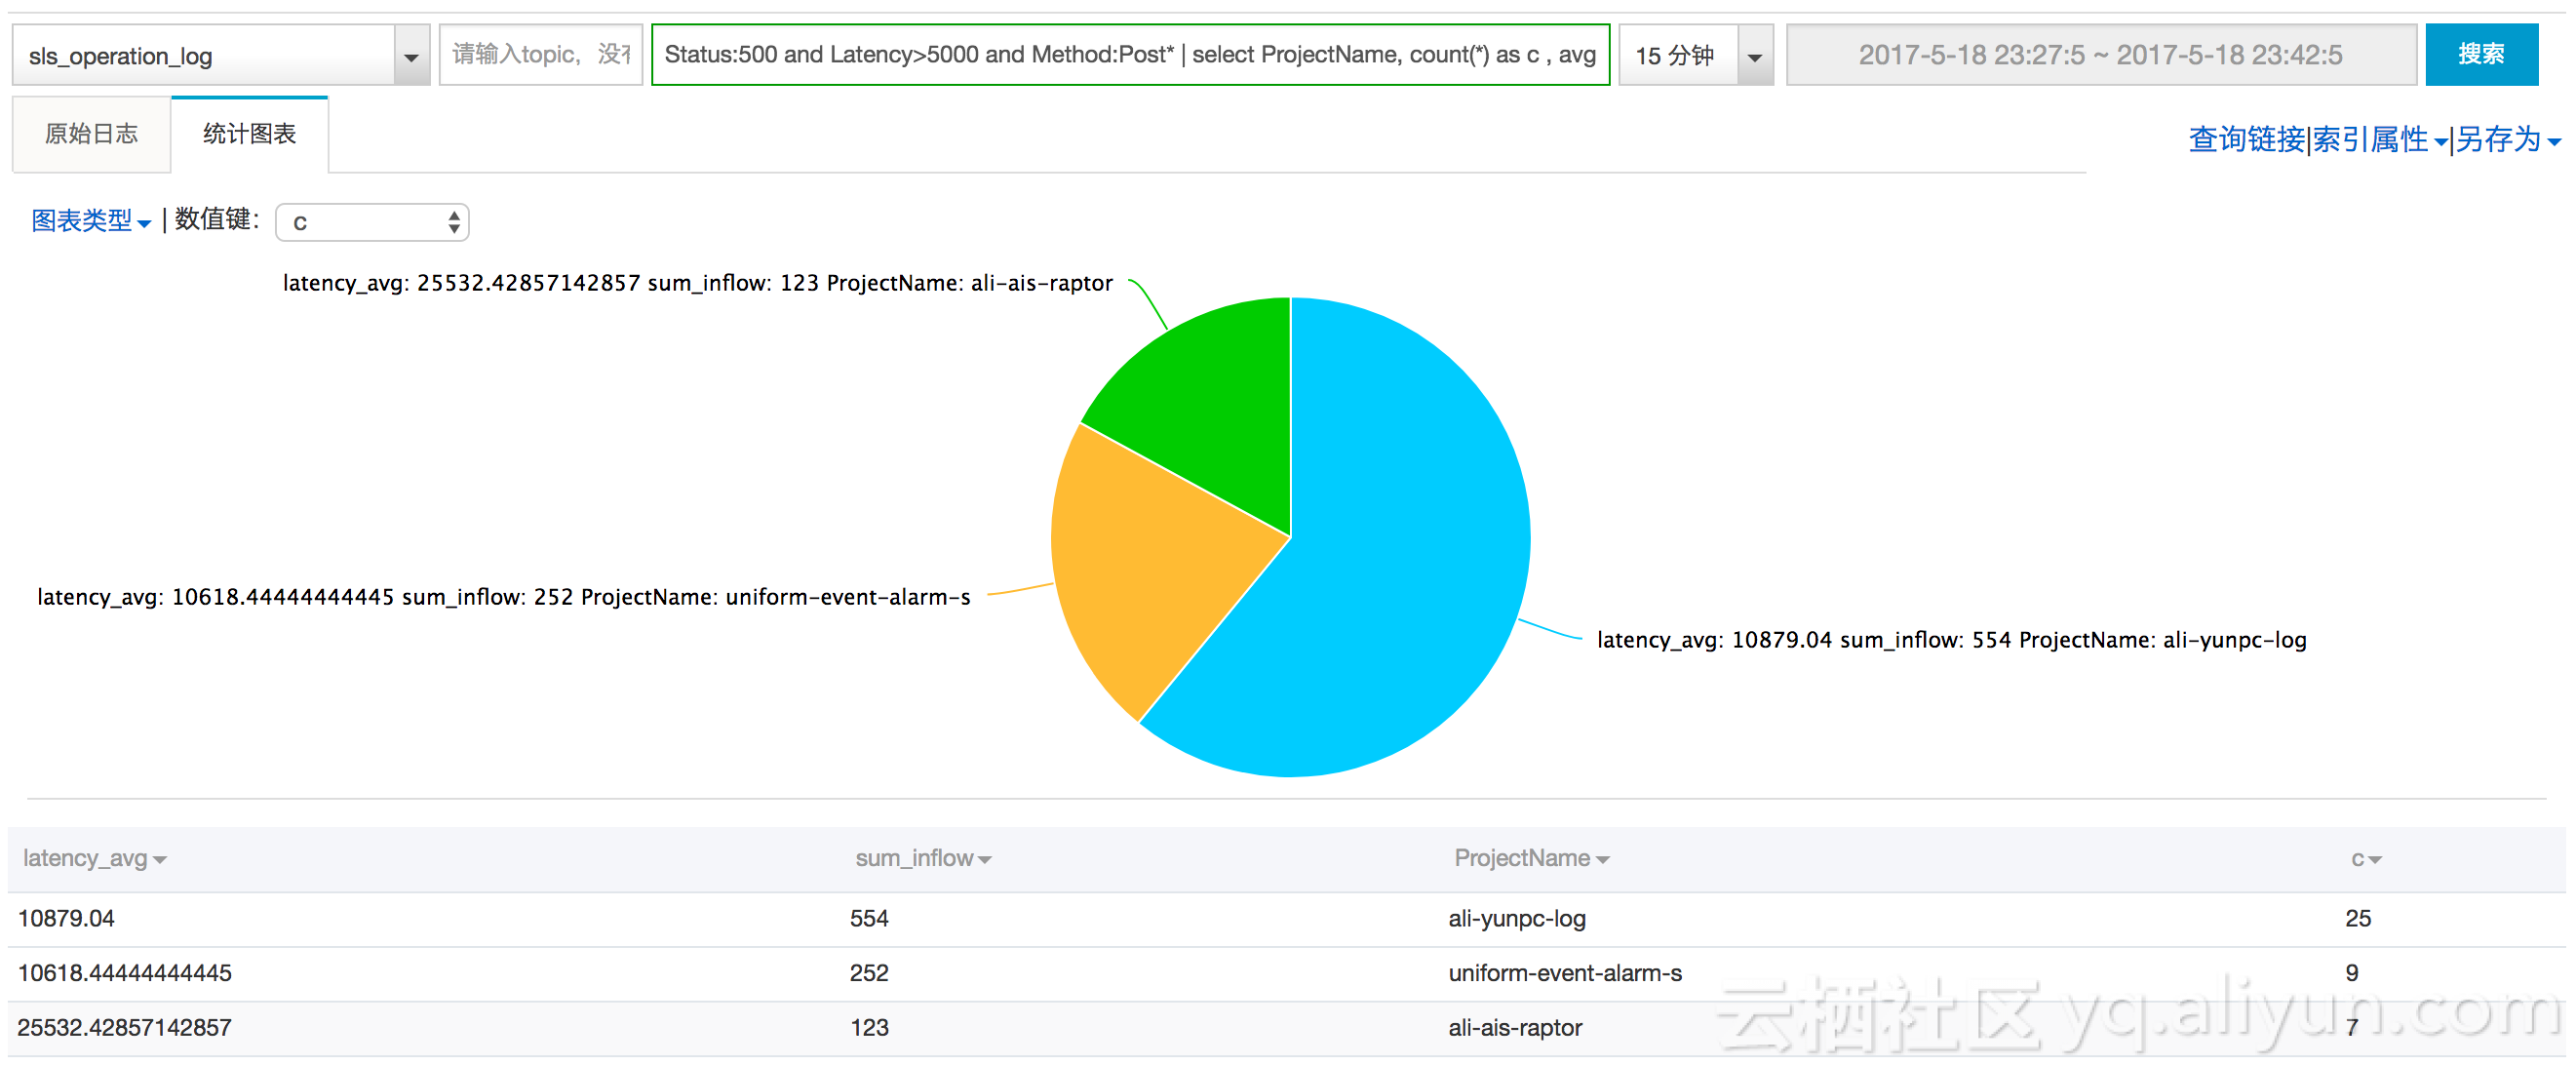
For example, query all logs of "status code=500, Latency>5000 us, request method starts with Post" from the access log (access-log):
Status:500 and Latency>5000 and Method:Post*
Add the pipeline operator "|" after the query, and after the SQL (no need for from and where, that is, query from the current Logstore, where condition is before the pipeline):
Status:500 and Latency>5000 and Method:Post* | select count(*) as c , avg(Latency) as latency_avg, sum(Inflow) as sum_inflow, ProjectName Group by ProjectName order by c Desc limit 10
The results are available on the console (including some basic graphs to help understand):
For a better experience, we limit the amount of SQL execution data (refer to the last part of SQL parsing syntax ). After the expansion of the computer room and the next optimization (about 2 months), we will release this restriction, so stay tuned.
Case (real-time analysis of online logs)
It is very challenging to locate problems in hundreds of machines, dozens of applications, and 10,000-level users. It is necessary to conduct real-time investigations in multiple dimensions and condition variables. For example, in a network attack, the attacker will constantly change the source IP, target, etc., making it impossible for us to respond in real time.
Such scenarios not only require massive processing power, but also require very real-time means. SLS+LogHub can ensure that logs are generated from the server to query within 3 seconds (99.9% of cases), allowing you to always be one step ahead.
For example, if there is a non-200 access error on the monitoring line, the general investigation method of the old driver is as follows:
-
该错误影响了多少用户? 是个体,还是全局
Status in (200 500] | Select count(*) as c, ProjectName group by ProjectName -
确定大部分都是从Project为“abc”下引起的,究竟是哪个方法触发的?
Status in (200 500] and ProjectName:"abc"| Select count(*) as c, Method Group by Method -
我们可以获取到,都是写请求(Post开头)触发,我们可以将查询范围缩小,调查写请求的延时分布
Status in (200 500] and ProjectName:"abc" and Method:Post* | select numeric_histogram(10,latency) -
我们可以看到,写请求中有非常高的延时。那问题变成了,这些高延时是如何产生的
-
通过时序分析,这些高请求延时是否在某个时间点上分布,可以进行一个时间维度的划分
Status in (200 500] and ProjectName:"abc" and Method:Post* |select from_unixtime( __time__ - __time__ % 60) as t, truncate (avg(latency) ) , current_date group by __time__ - __time__ % 60 order by t desc limit 60 -
通过机器Ip来源看,是否分布在某些机器上
Status in (200 500] and ProjectName:"abc" and Method:Post* and Latency>150000 | select count(*) as c, ClientIp Group by ClientIp order by c desc
-
-
最终大致定位到了延时高的机器,找到RequestId,可以顺着RequestId继续在SLS中进行查询与搜索
-
这些操作都可以在控制台/API 上完成,整个过程基本是分钟级别
什么场景适合使用SLS?
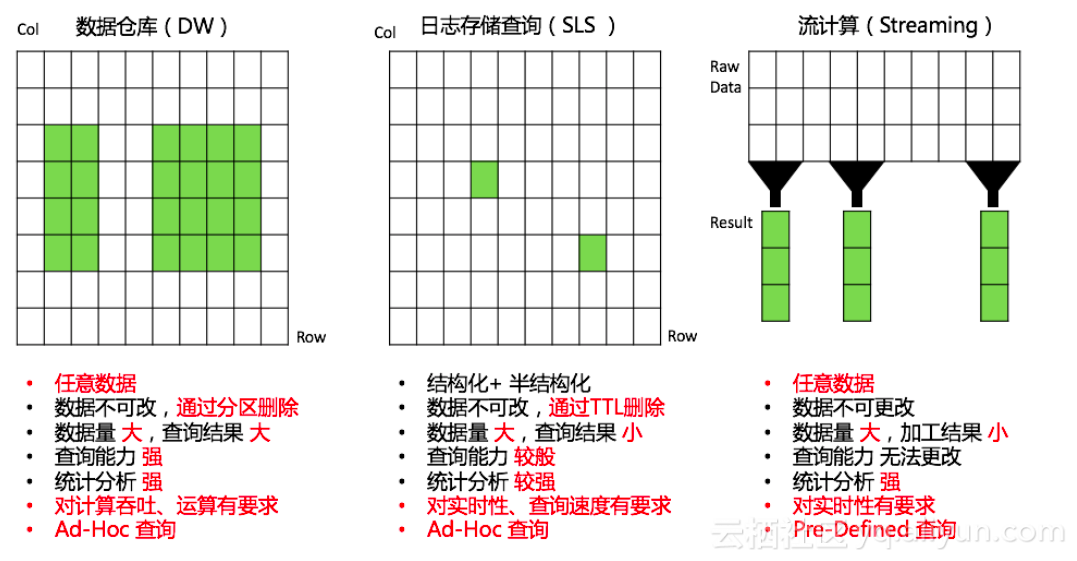
和数据仓库、流计算等分析引擎相比,有如下特点:
- 针对结构化、半结构化数据
- 对实时性、查询延时有较高要求
- 数据量大,查询结果集合相对较小
除此之外SLS与 MaxCompute、OSS(E-MapReduce、Hive、Presto)、TableStore、流计算(Spark Streaming、Stream Compute)、Cloud Monitor等已打通,可以方便地将日志数据以最舒服姿势进行处理。
