What is a stress test
As the name implies: stress test is the system to be tested, under a certain access pressure, to see whether the program runs stably/server runs stably (resource occupancy)For example: 2000 users go to a shopping website to shop at the same time, will the speed of these users open the page slow down, or whether the website will crash
Common tools for stress testing
To do a stress test, you generally need to use tools, which cannot be done manually. The most commonly used tool is LoadRunner, but LoadRunner is a paid software after all, and it is more complicated to use. Now more and more people are using Jmeter for stress testing. It's free and very easy to use.
The steps to do a stress test are as follows:
1. Write a script or record a script
2. Using user-defined parameters
3. Scene Design
4. Use the controller to control how many users to simulate.
5. Use the listener to view the test results
An example of stress testing in this article
The example given in this article is: Use Jmeter to simulate 200 users on a computer, and use bing to search for different keywords at the same time, and check whether the time returned by the page is within the normal range.
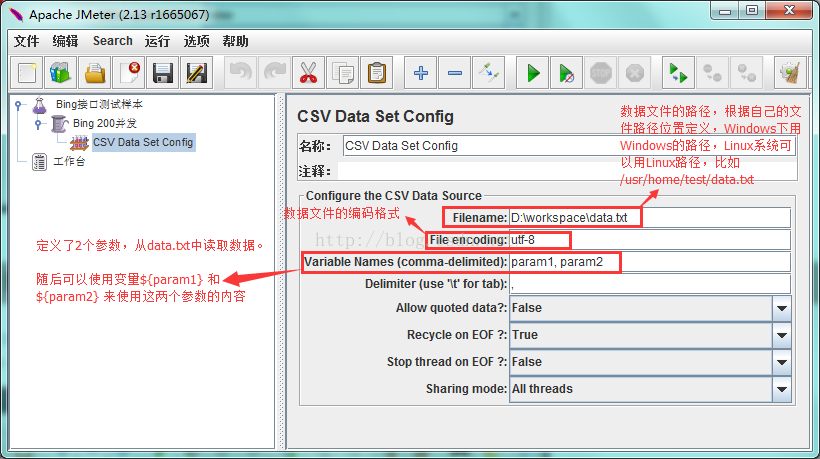
Step 1: Parameterize using CSV Data Set Config
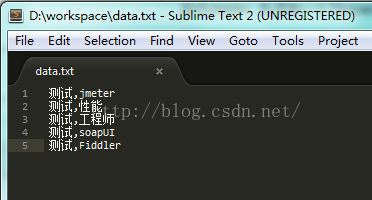
First, we put the 2 parameters needed for the test in the txt file,
Create a new data.txt file, enter some data, there are two data in one line, separated by commas.
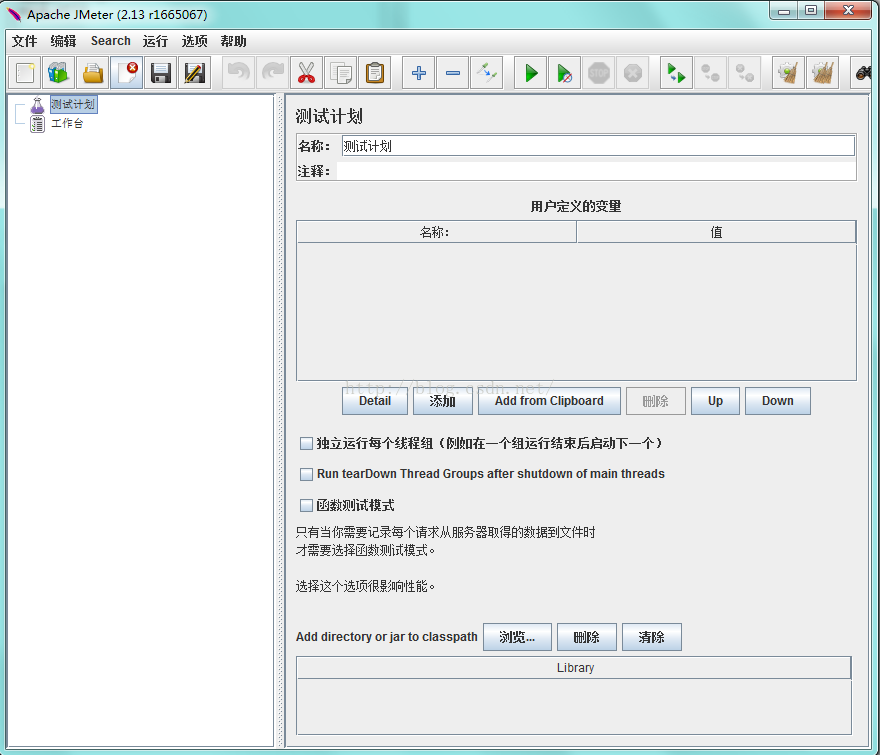
1. Start Jmeter, the following interface will appear, the system automatically adds a Test Plan (test plan), you can change the name of the test plan in the name position, for example: Bing interface test sample
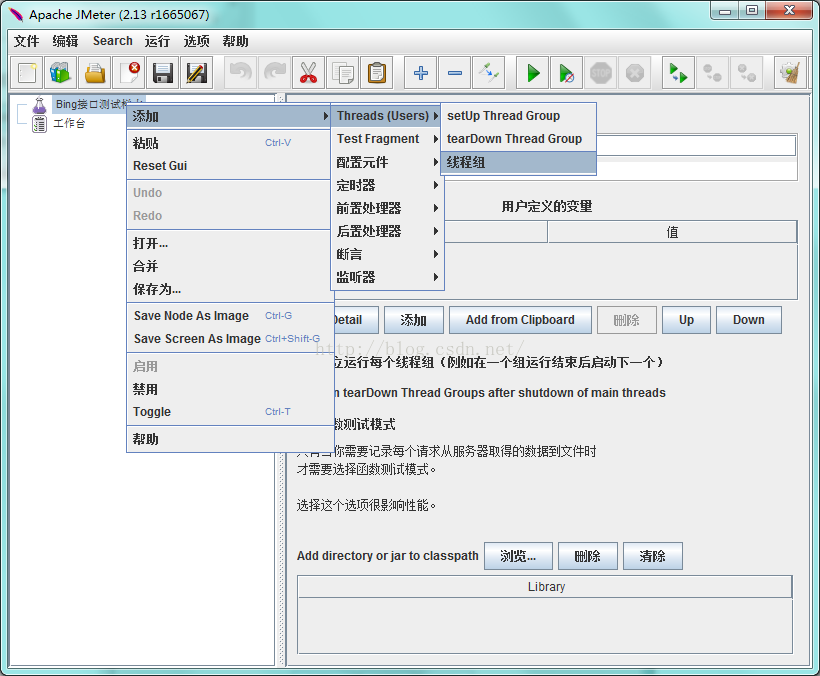
2. First add a Thread Group (right-click Test Plan -> Add -> Thread (Users) -> Thread Group);
Thread groups can also be renamed, for example: Bing 200 Concurrency
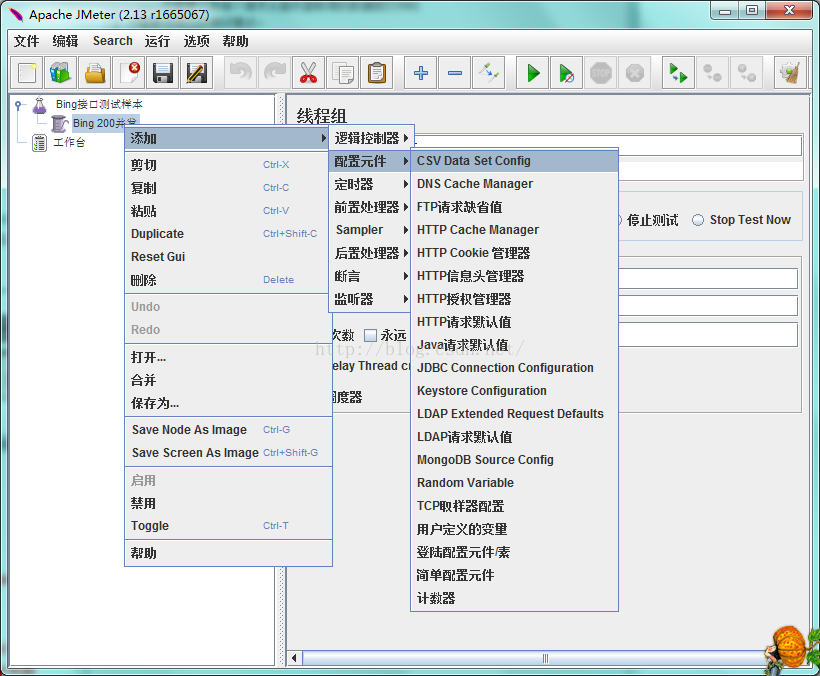
3. Then add a CSV Data Set Config under "Thread Group" (right click on the thread group -> Add -> Config Element -> CSV Data Set Config);
Configure the file content information used in the test in CSV Data Set Config,
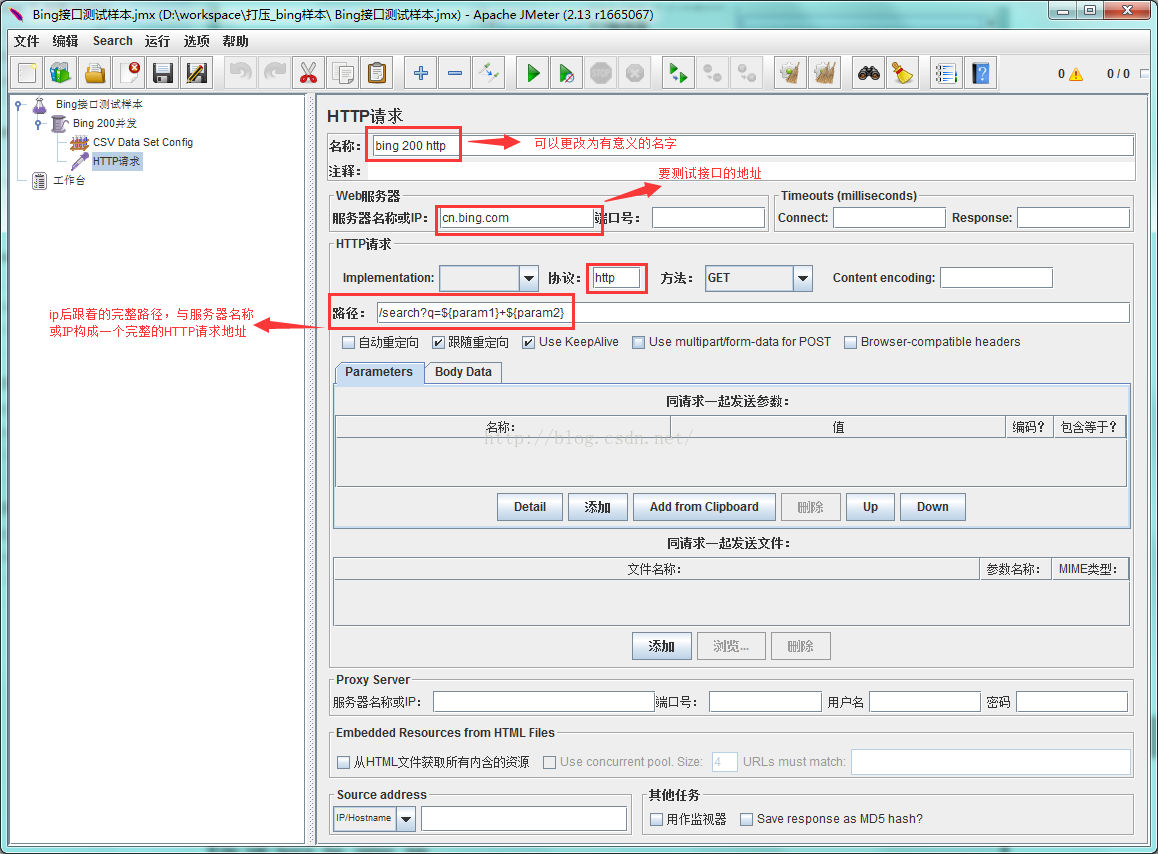
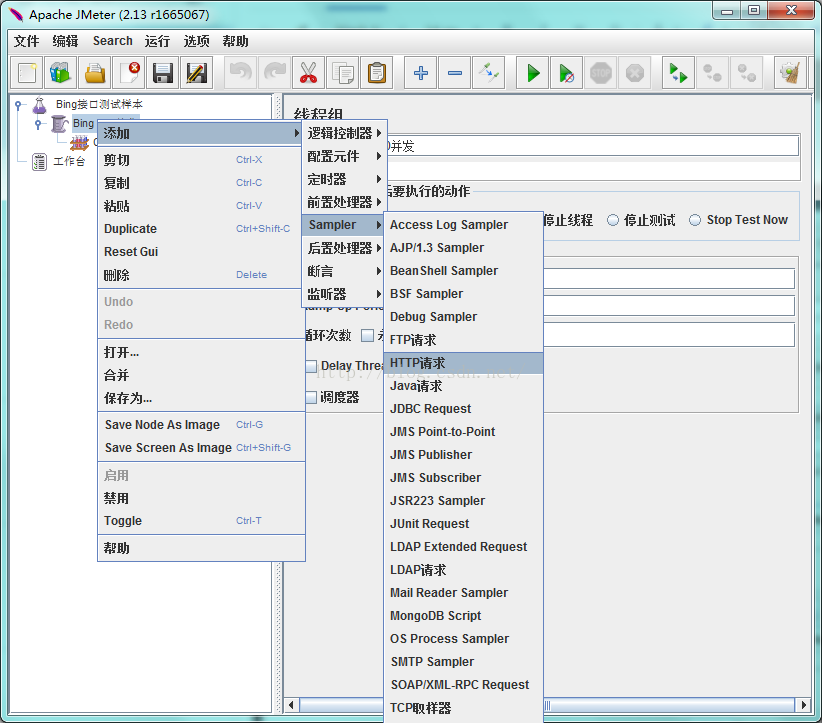
Step 2: Add HTTP Request.
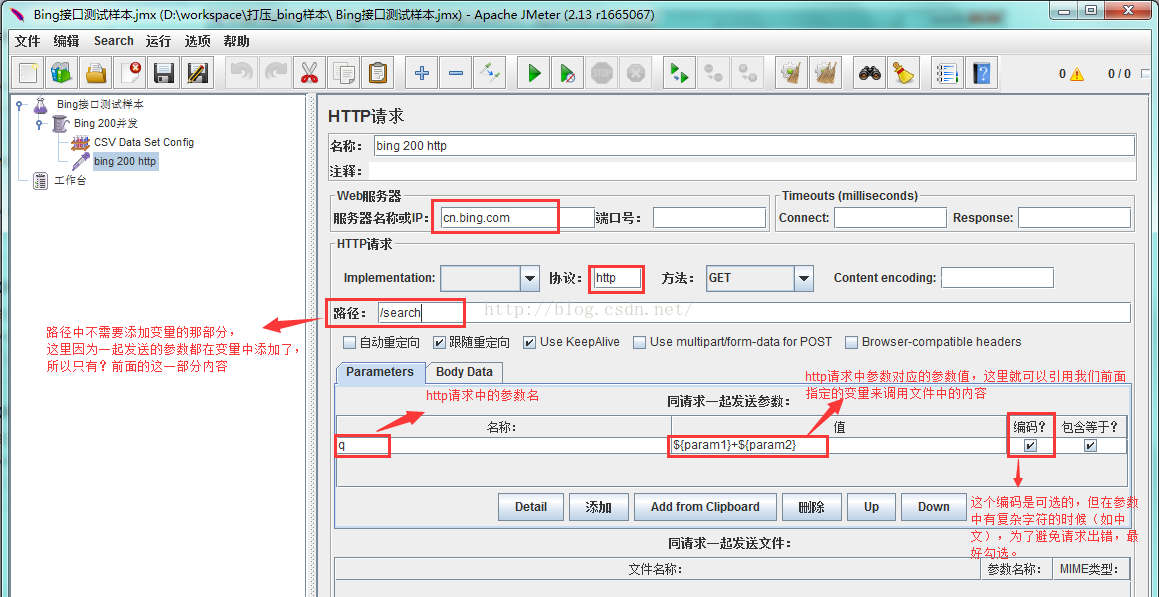
We add http request, send get to http://cn.bing.com/search?q= ${param1}+${param2} ()
1. Right-click on Thread Group (Add -> Sampler -> HTTP Request),
2. The data to be filled in are as follows:
A. Using variables in paths
B. Add variables in the variable column
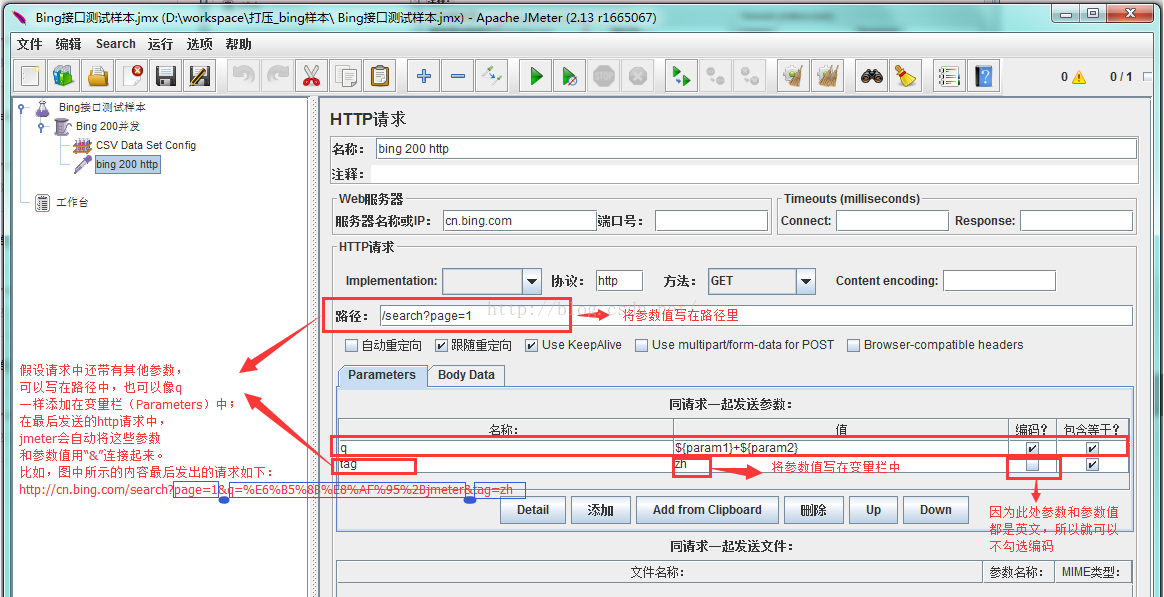
C. Add variables to variables, and the path also contains variables
This article follows the second method
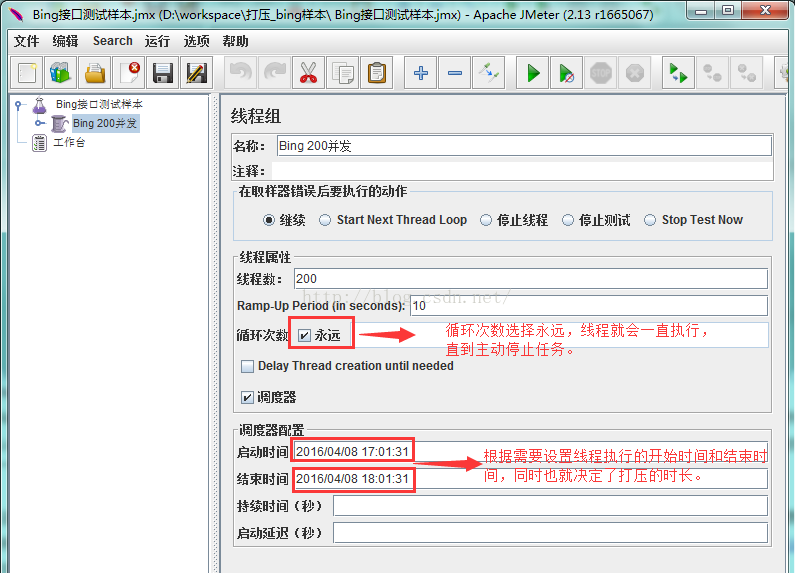
Step 3: Use Thread Group to control how many users to simulate
Check Thread Group
Number of Threads (users thread number): One user occupies one thread, 200 threads is to simulate 200 users
Ramp-Up Period(in seconds): Sets how long it takes for the thread to start up completely. If the number of threads is 200 and the preparation time is 10, it will take 1 second to start 20 threads. That is, 20 threads are started every second.
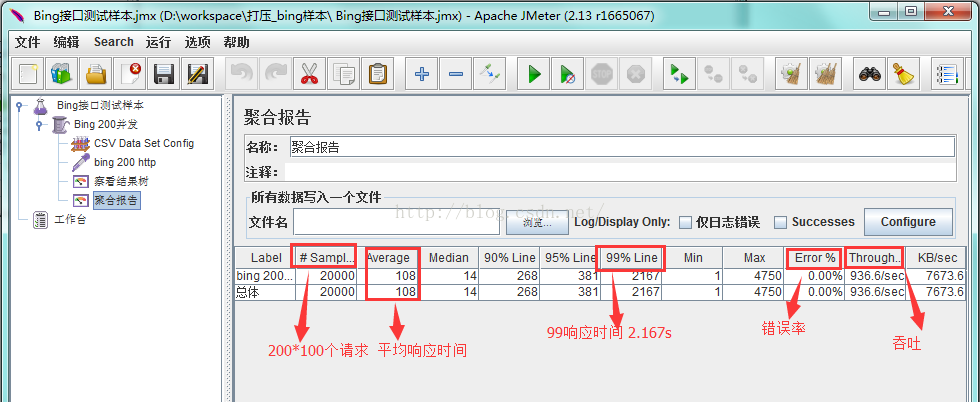
Loop Count: The number of times each thread sends a request. If the number of threads is 200 and the number of loops is 100, then each thread sends 100 requests. The total number of requests is 200*100=20000. If "Forever" is checked, all threads will keep sending requests until you choose to stop running the script.
Note: If you want to ensure that the threads in the number of threads can execute at the same time, the execution time of all threads must be greater than the time of the Ramp-up Period. The maximum number of running threads that Jmeter suppresses will not exceed the number of threads we set.
For an explanation of the relationship between Number of Threads, Ramp-Up Period and Loop Count, please refer to: http://blog.csdn.net/hsd412237463/article/details/49929173
Mainly for the understanding of Ramp-Up Period parameters ( http://www.knowsky.com/367353.html ).
(Each thread runs the test plan independently. Therefore, thread groups are often used to simulate concurrent user access. If the client does not have enough power to simulate a heavy load, Jmeter's distributed testing capabilities can be used to test through a Jmeter console. Remotely control multiple Jmeter engines to complete tests.
The parameter ramp-up period is used to tell JMeter how long to set up all threads. The default value is 0. If the ramp-up period is not specified, that is to say, the ramp-up period is zero, JMeter will create all threads immediately. Assuming that the ramp-up period is set to T seconds and the number of all threads is set to N, JMeter will set up every T/N seconds to create a thread.
Most of the parameters of the thread group are self-explanatory, only the ramp-up period is somewhat difficult to understand, because how to set the appropriate value is not easy. First, ramp-up period should generally not be set to zero if a large number of threads are to be used. Because if it is set to zero, Jmeter will create all threads at the beginning of the test and send access requests immediately, so it is easy to saturate the server, and more importantly, it will increase the load implicitly, which means that the server Will be overloaded, not because of high average access rate but because of abnormal initial access spikes caused by the first concurrent access of all threads, which can be seen through Jmeter's aggregate report listener.
This kind of anomaly is not what we need, so the rule for determining a reasonable ramp-up period is to have the initial CTR close to the average CTR. Of course, some tests may need to be run to determine reasonable traffic.
For the same reason, an excessively large ramp-up period is also inappropriate, because it will reduce the load of the access peak. In other words, some threads that were started at the beginning may have ended when some threads have not yet started. )
In addition, for the setting of the number of loops of the Thread Group, the scheduler can be used to specify:
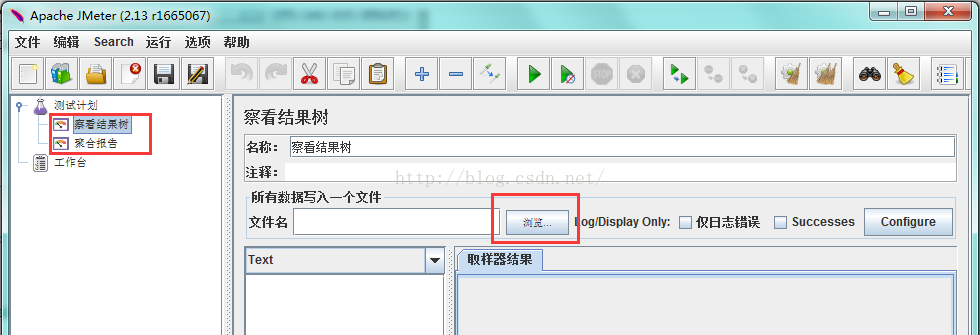
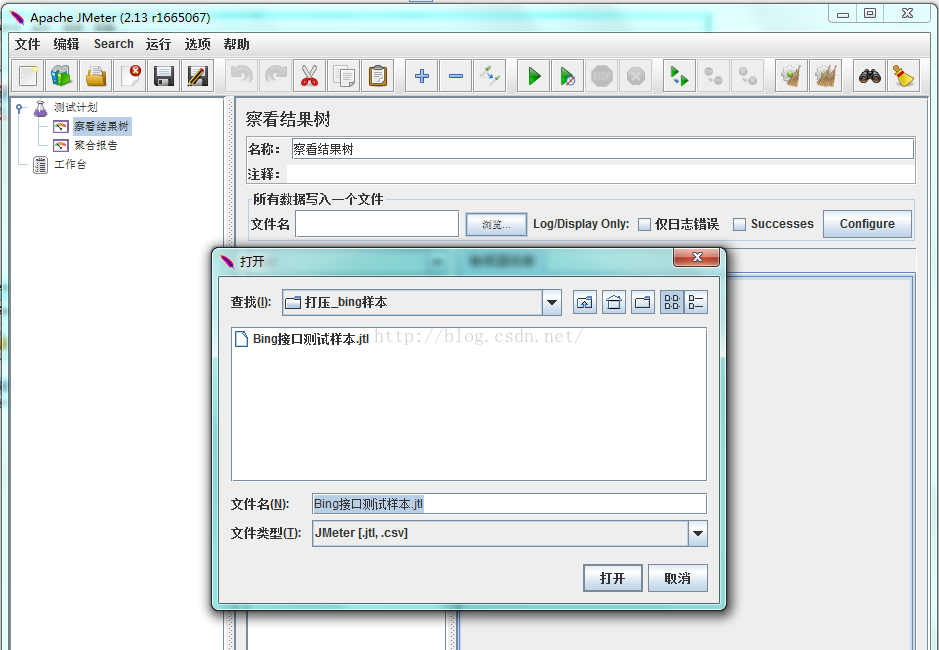
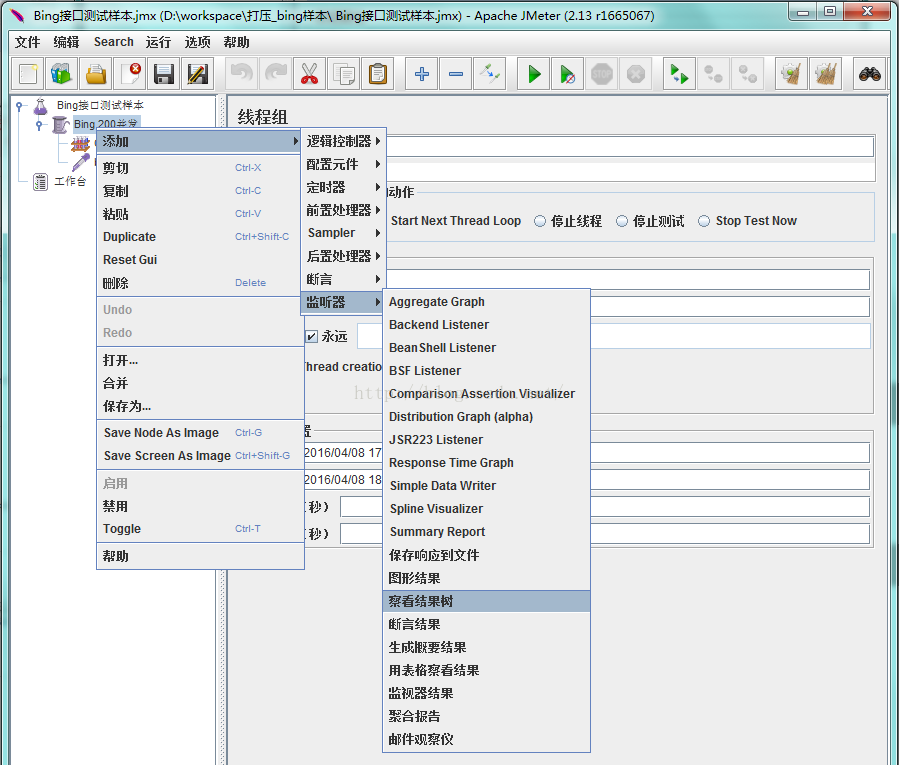
Step 4: Add a listener to view the test results
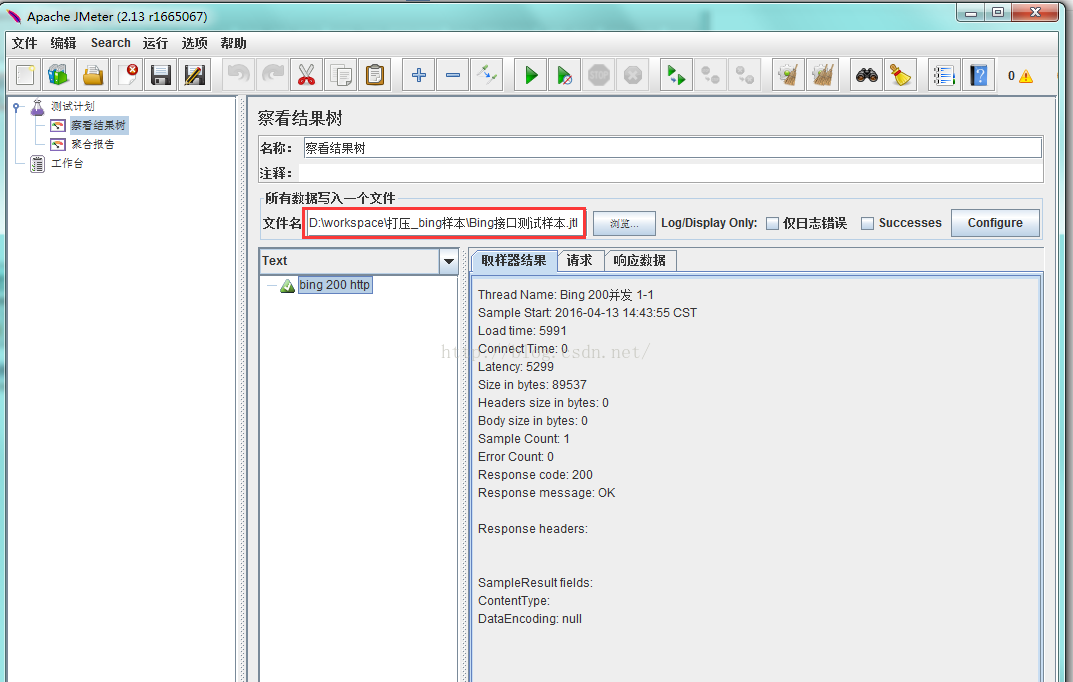
There are two commonly used listeners, one is to view the result tree (View Result Tree), right-click the thread group -> Add -> Listener (listener) -> View Result Tree (view the result tree)
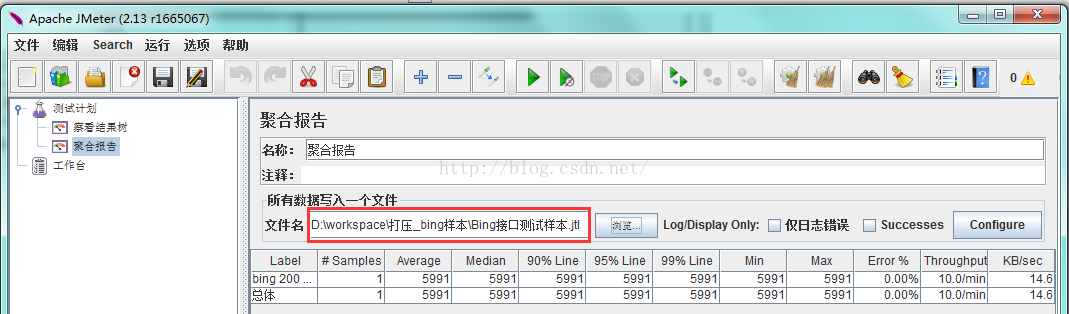
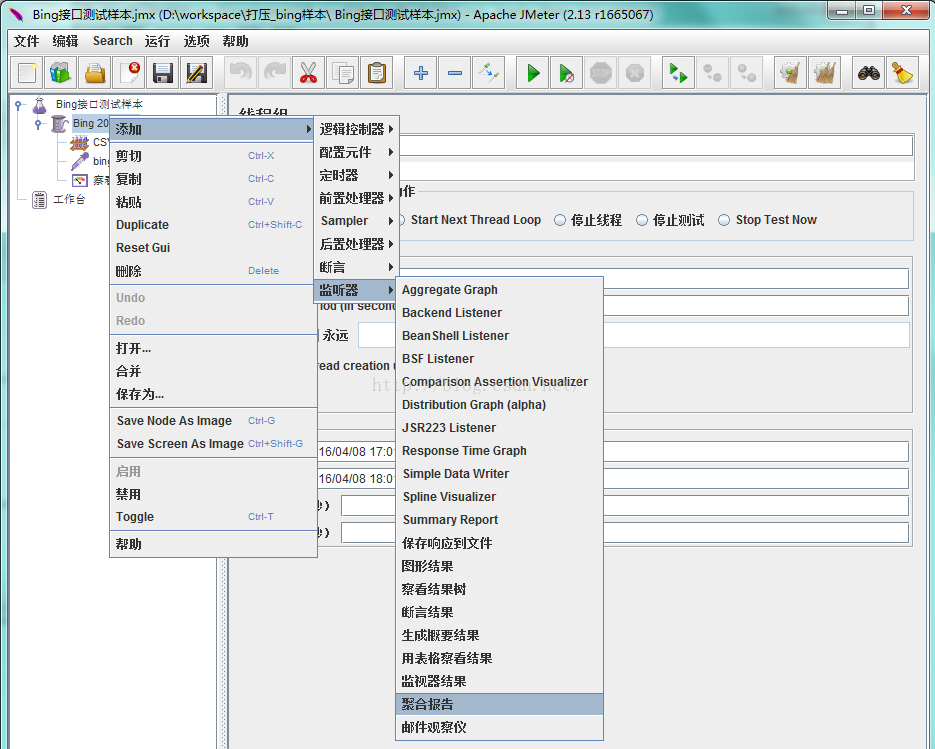
One is the Aggregate Report, right-click the thread group -> Add -> Listener (listener) -> Aggregate Report (aggregate report)
After the following operation is completed, I will briefly explain the role of these two listeners
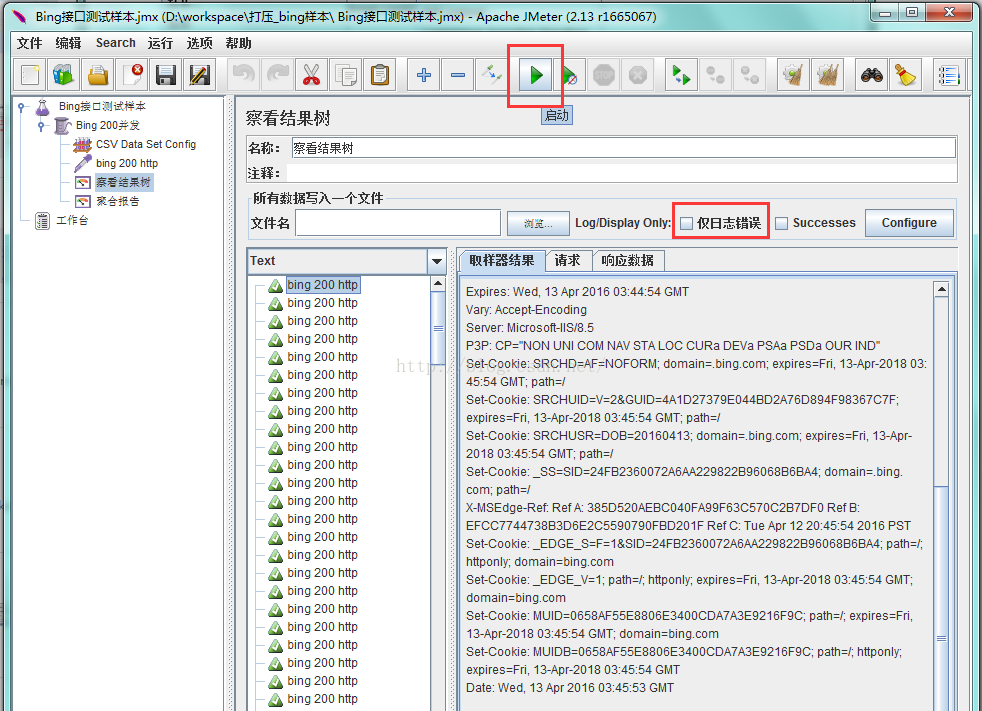
Step 5: Run it
So far, the script is all written, let's run it, how to see the test results
After clicking Start, the script will be executed, and you will see the specific information and response data of the request we sent in the "View Results" interface.
In practical applications, it is recommended to check "Only log errors", because when there are too many running requests, if all of them are displayed, the system is prone to crash, and we are more concerned about the wrong results.
Aggregated reports show many details, number of requests, 99 response times, error rates, and throughput. For a detailed explanation, please refer to "JMeter Aggregation Report" ( http://www.cnblogs.com/jackei/archive/2007/01/17/623166.html ).

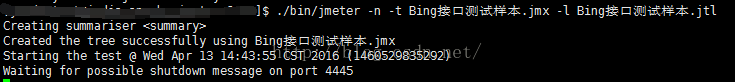
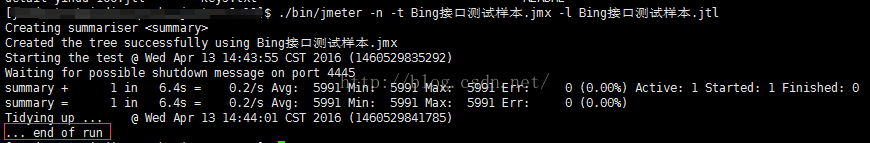
1.2 Running the script on the command line
Parameter Description:
-n means run the test plan in nogui mode
-t means test plan followed by the test plan name
-l indicates the test result, followed by the test result file name