Kind of problem
time complexity
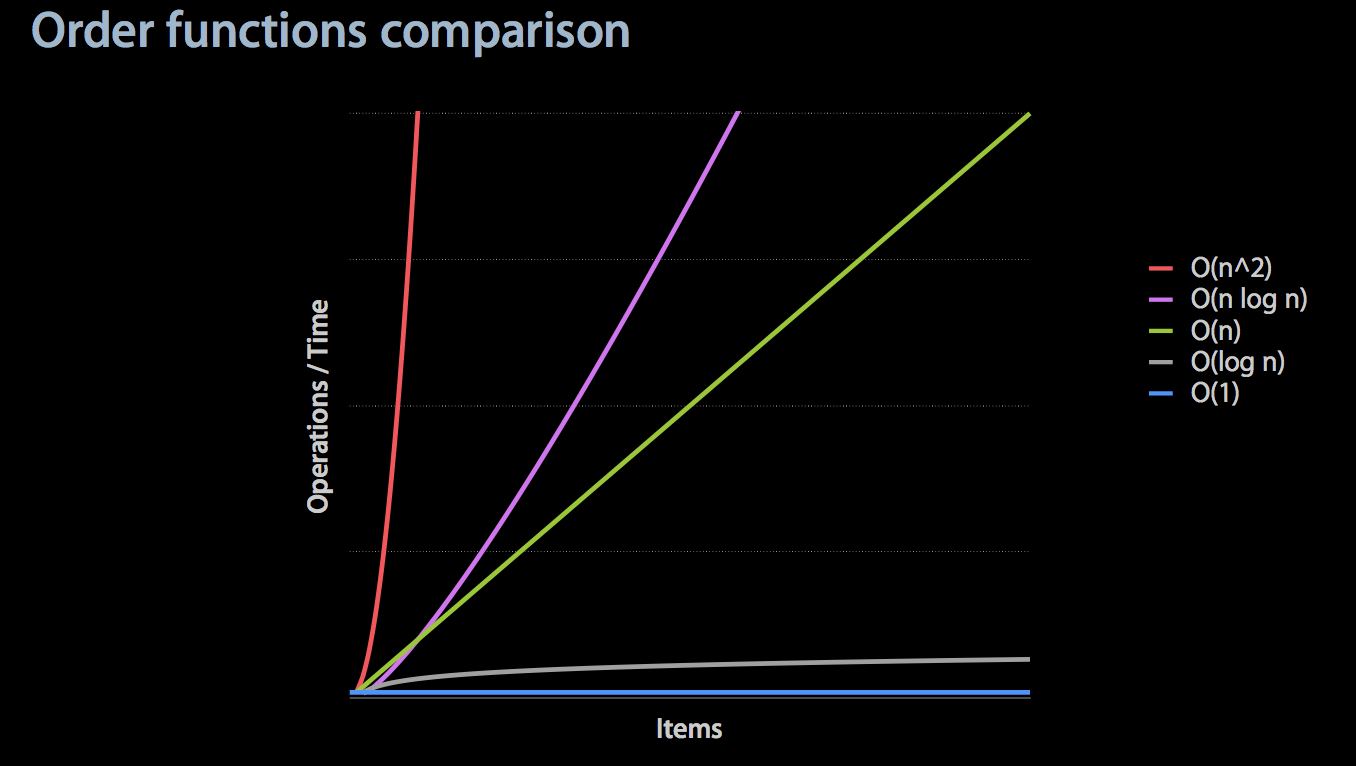
The impact of time complexity on performance appears to be minimal in the case of small amounts of data in the collection. However, if a developed function is a public function and the amount of data passed in by the caller cannot be predicted, the optimization of this complexity is very important. The above figure lists the time complexity of various situations. For example, efficient sorting algorithms are generally O(n log n). Next, take a look at the following figure: It can be seen from the figure that O(n) is a watershed, and if it is greater than it, it has a great potential impact on performance. If it is a public interface, you must add a description, and you must be aware of your own calls. . Of course, it is best to optimize the algorithm or use an appropriate system interface method to weigh the memory consumption and strive to exchange space for time.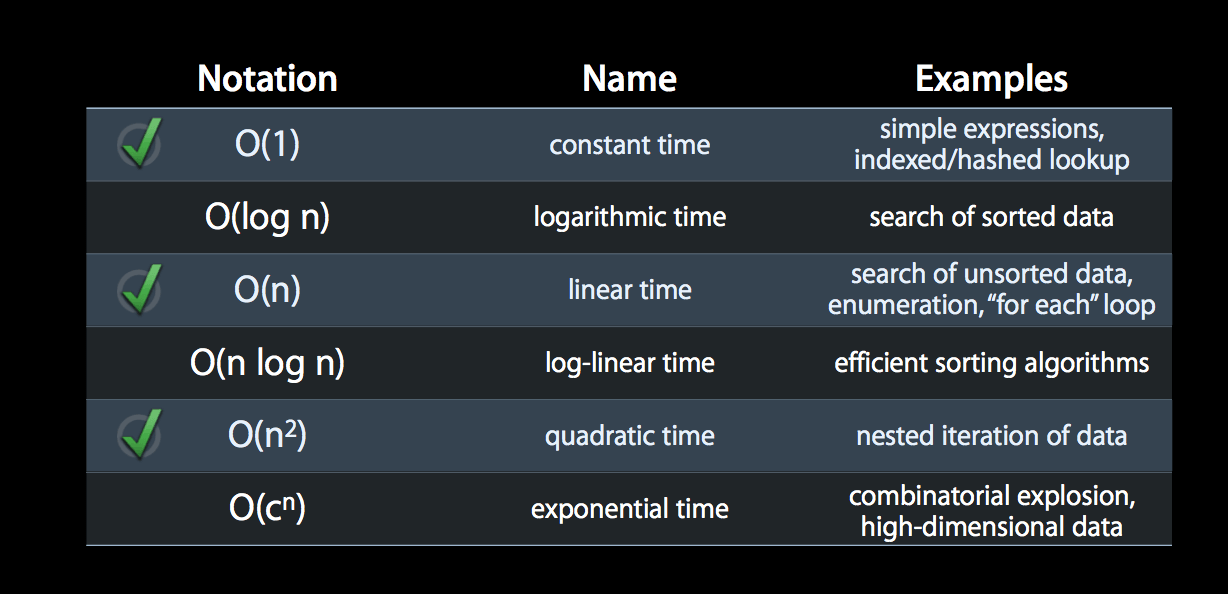
The following is an example of whether there is a certain value in the collection:
So what is the time complexity of the interface methods provided by several common collection objects in OC.
NSArray / NSMutableArray
First of all, we found that they are sorted and allow duplicate elements to exist, so this design shows that the collection storage cannot use the elements inside as the key of the hash table to perform related fast operations. Therefore, the performance of different functional interface methods will be very different.
- containsObject:, containsObject:, indexOfObject*, removeObject: will traverse the elements inside to see if they match, so the complexity is equal to or greater than O(n)
- objectAtIndex:, firstObject:, lastObject:, addObject:, removeLastObject: The time complexity of these operations only for the top and bottom of the stack is O(1)
- indexOfObject:inSortedRange:options:usingComparator: binary search is used, and the time complexity is O(log n)
NSSet / NSMutableSet / NSCountedSet
These collection types are unordered with no repeating elements. This allows fast operations through the hash table. For example, addObject:, removeObject:, containsObject: are all in O(1). It should be noted that when the array is converted into a Set, the duplicate elements will be combined into one, and the ordering will be lost.
NSDictionary / NSMutableDictionary
Similar to Set, there are more key-value correspondences. Add delete and lookup are O(1). Note that Keys must be NSCopying compliant.
Different implementation of containsObject method in array and Set
implementation in array
You can see that it will traverse all elements and return after finding them.
Next, you can look at the implementation of containsObject in Set:
When finding an element, it is extracted from the map mapping table by key value. Because the element in the Set is unique, the hash element object can be used as the key to achieve the purpose of quickly obtaining the value.
Optimizing with GCD
We can use the methods provided by GCD to put some time-consuming operations on non-main threads, so that the App can run more smoothly and respond faster. However, when using GCD, you need to pay attention to avoid situations that may cause thread explosion and deadlock, and non-main thread processing tasks are not omnipotent. If a processing requires a lot of memory or a lot of CPU to operate GCD can not help you, only through It is more appropriate to dismantle and divide the processing into steps and time.
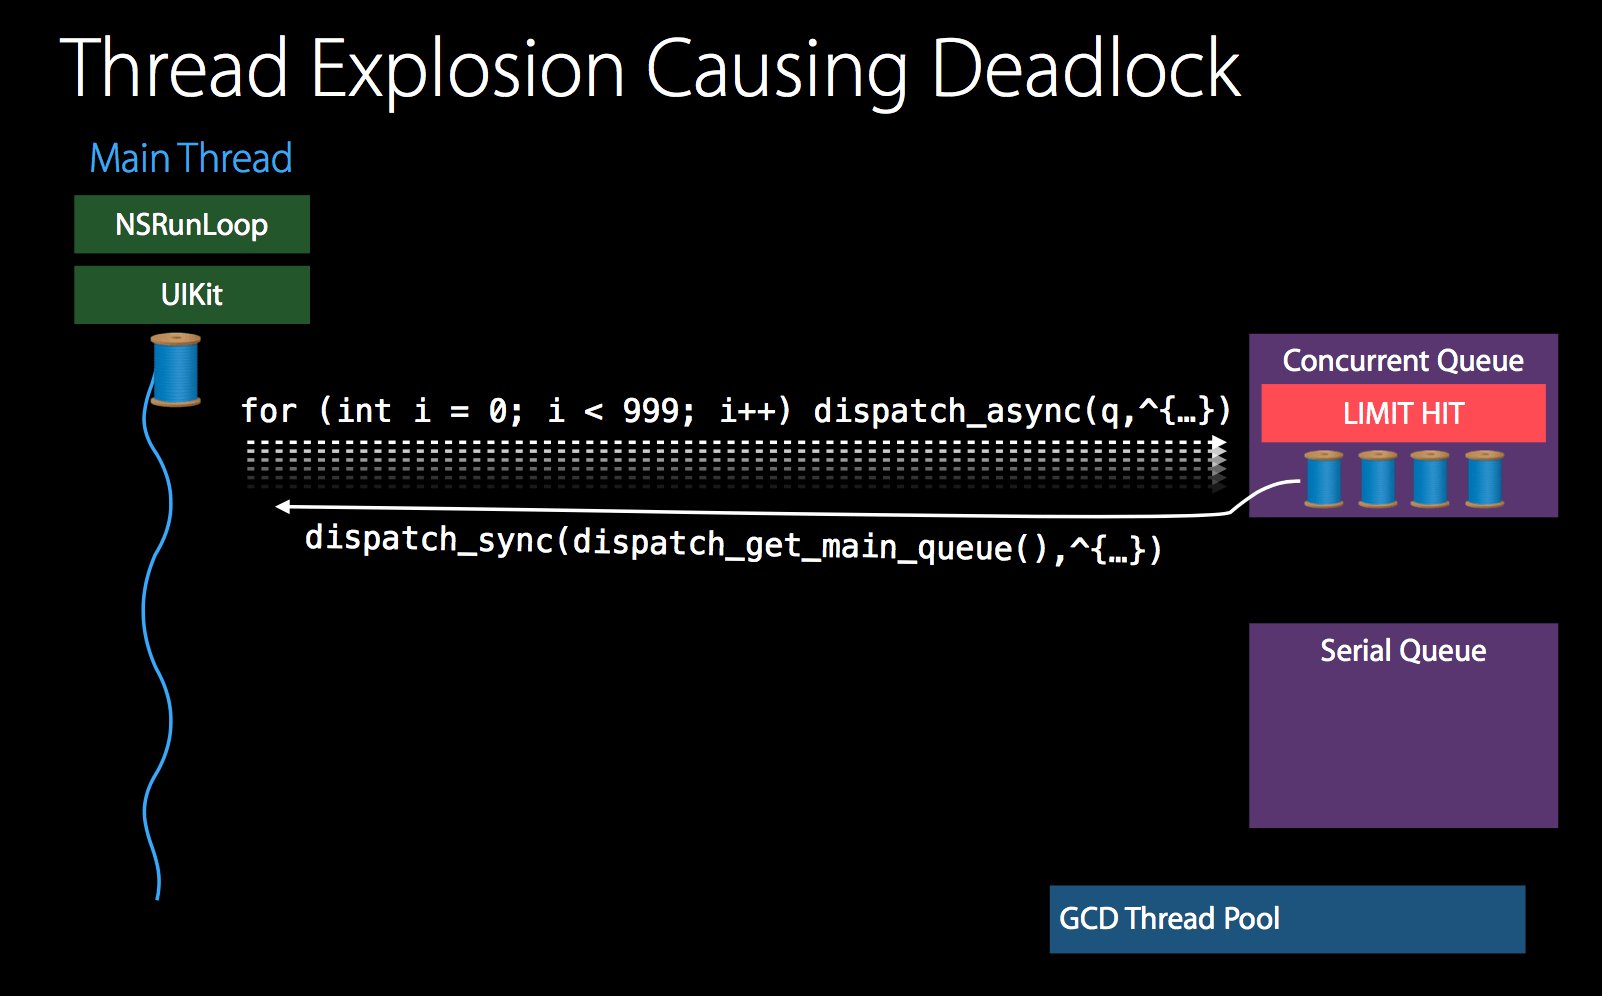
Process events asynchronously
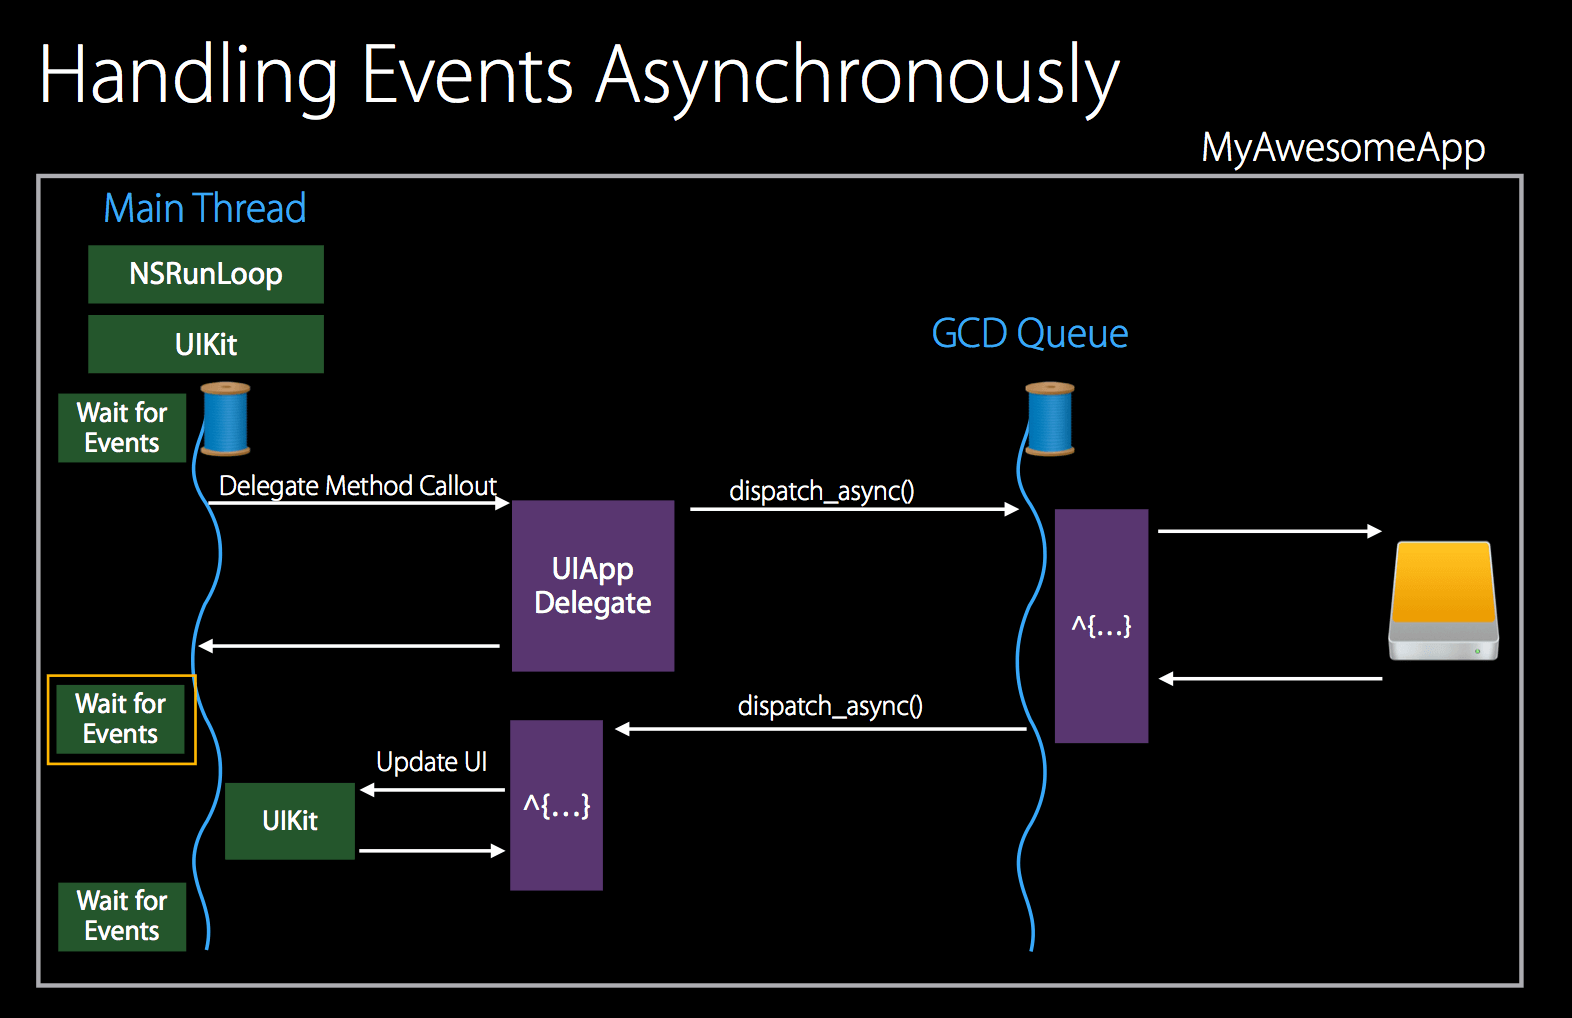
The above picture is the most typical method of asynchronously processing events
Time-consuming tasks
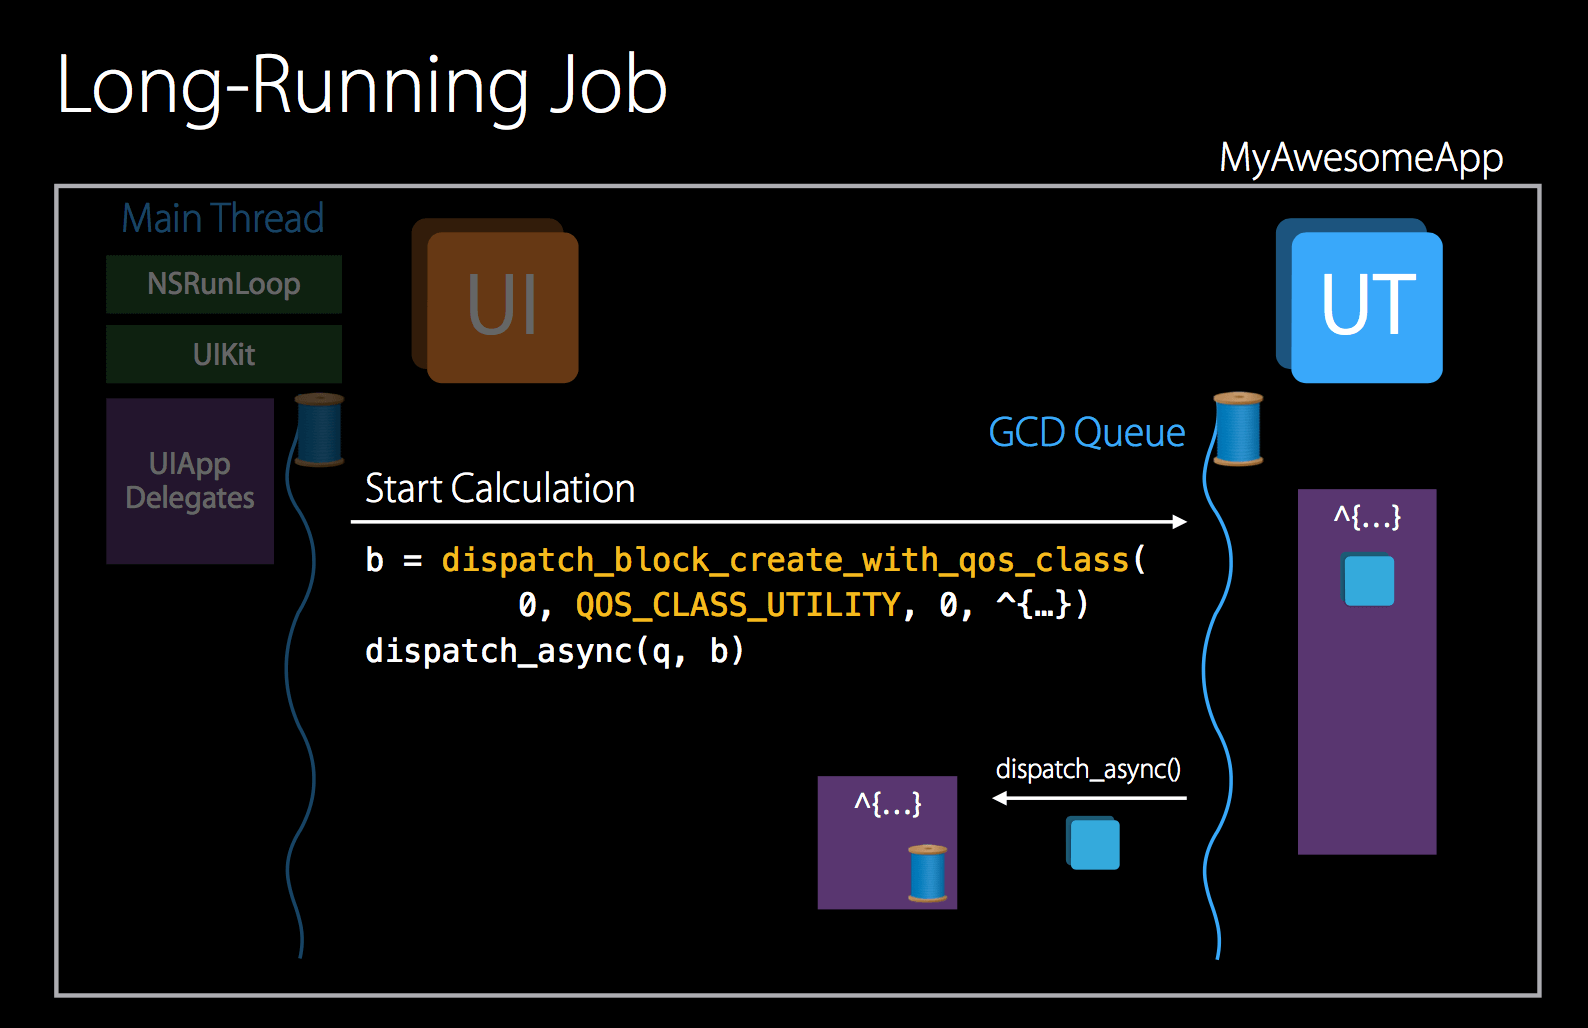
Specify the QoS of the queue as QOS_CLASS_UTILITY for the block of GCD through the dispatch_block_create_with_qos_class method. This QoS system is power-optimized for large computing, I/O, networking, and complex data processing.
Avoid thread explosion
- use serial queue
- Use the concurrency limit method NSOperationQueue.maxConcurrentOperationCount of NSOperationQueues
For example, the following way of writing is more dangerous and may cause thread explosion and deadlock
So how can it be avoided? First you can use dispatch_apply
or use dispatch_semaphore
GCD related Crash logs
Manage thread issues
When the thread is idle
When the thread is active
When the main thread is idle
main queue
I/O performance optimization
I/O is a big consumer of performance. Any I/O operation will break the low-power state. Therefore, reducing the number of I/Os is the key point of this performance optimization. In order to achieve this goal, some methods are listed below.
- Write the bits and pieces as a whole
- Use the appropriate I/O operation API
- Use the right thread
- Using NSCache for caching can reduce I/O
NSCache
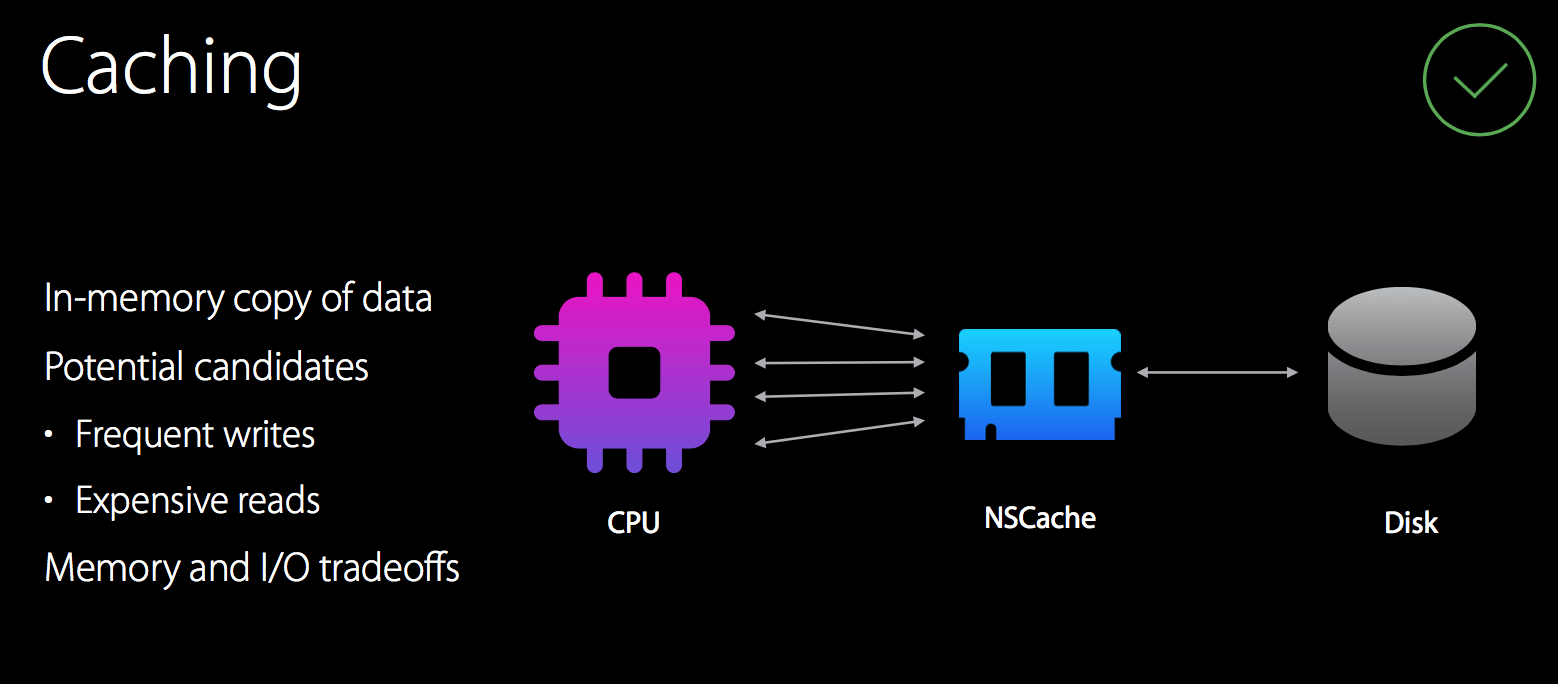
To achieve the purpose of the picture, why not use the dictionary directly?
NSCache has all the functions of a dictionary, but also has the following features:
- Automatically clean up system memory
- NSCache is thread safe
- -(void)cache:(NSCache *)cache willEvictObject:(id)obj; the callback when the cache object will be cleared
- evictsObjectsWithDiscardedContent can control whether to clean up
So how does NSCache achieve these features?
Next, learn how NSCache does it. First of all NSCache will hold an NSMutableDictionary.
Need to design a Cached object structure to hold some additional information
When the Cache is read, the addition and deletion of the _accesses array will ensure thread-safe operations through the isEvictable boolean value. Use the accessCount property in the Cached object to perform +1 operation to prepare for the conditional judgment of automatic cleaning later. The specific implementation is as follows:
Every time Cache is added, it will first check whether it is automatically cleaned up. A Cached object will be created to record the key, object, cost and other information and add it to the _accesses array and _objects dictionary.
So how is the above-mentioned method of automatically cleaning up memory implemented?
Since it is automatic cleaning, there must be a trigger timing and a conditional judgment for entering the cleaning. The trigger timing occurs when the Cache content is added, and the other occurs when the memory warning occurs. The conditional judgment code is as follows:
Therefore, the value of the totalCostLimit of NSCache will be compared with the sum of the cost added to the Cache each time. Exceeding the limit will inevitably trigger memory cleanup.
When cleaning, the frequently accessed objects will not be cleaned up, mainly through _totalAccesses and the total number to obtain the average access frequency. If the number of accesses of that object is less than the average, it needs to be cleaned up.
Some preparations are required before cleanup, including marking the Cached object's isEvictable to prevent unsafe thread operations later. Put the cleanup objects that meet the conditions into the cleanup array. If the space is freed enough, you don't need to add more objects to the cleanup array. Finally, you can traverse the cleanup array to clean up one by one.
The callback content will be executed during cleanup, so that if some cached data needs to be persisted, it can be processed in the callback.
The complete implementation can be viewed in the NSCache.m file of the GNUstep Base.
Let's see how NSCache works in SDWebImage:
It can be seen that pictures are placed in NSCache by using the feature of NSCache to automatically release memory, so that when the memory is not enough, those pictures that are not commonly used can be automatically cleaned up. Only then will I/O be performed to read pictures from the disk. In this way, the space can be used to reduce disk operations, and the space can be more effectively controlled and released.
Control the number of App Wakes
Notifications, VoIP, location, Bluetooth, etc. will all cause the device to wake up from the Standby state. Arousing this process will have a relatively large consumption and should be avoided frequently. In terms of notification, more consideration should be given to the product level. In terms of positioning, you can take a look at some of the positioning APIs below to see their different effects on performance, so that you can consider using the appropriate interface.
Continuous location updates
This method will work while the device is always active.
Delay effective positioning
It will be more energy efficient, and can be used for applications that only need callbacks when there is a large change in location, such as weather applications.
Regional monitoring
It is also an energy-saving positioning method. For example, applications such as monitoring and displaying different information in different areas in a museum are more suitable for this positioning.
frequently visited place
In general, don't use startUpdatingLocation() lightly, unless absolutely necessary, use stopUpdatingLocation() as soon as possible to end the location and save the user a power-saving device.
The impact of memory on performance
First of all, it takes time to reclaim memory, and a sudden large amount of memory demand will affect the response.
How to prevent these performance problems, do you need to prevent them deliberately?
Adhere to the following principles to avoid some performance problems during the coding phase.
- Optimize the computational complexity to reduce CPU usage
- Stop unnecessary task processing while the app responds to interactions
- Set appropriate QoS
- Combine timer tasks to keep the CPU in idle state more often
So if it is too late to pay attention to these problems when writing requirements, can you avoid these problems by automating code inspection?
how to check
Check in the code based on these questions, write a tool or use a tool to automate the check? Although it is possible, there are too many situations to be considered, the existing tools are not well supported, and it takes too long to write too many points to be considered, so what is the best way?
Monitor by listening to the main thread
First, use CFRunLoopObserverCreate to create an observer that accepts the callback of CFRunLoopActivity, and then use CFRunLoopAddObserver to add the observer to the kCFRunLoopCommonModes mode of the main thread Runloop of CFRunLoopGetMain() for observation.
Next, create a sub-thread for monitoring, and use dispatch_semaphore_wait to define the interval time. If the standard is 16 or 20 microseconds for monitoring, you can basically find out everything that affects the response. The standard for monitoring the results is to judge whether it is stuck according to whether the status of the two Runloops BeforeSources and AfterWaiting can be detected in the interval time.
How to print stack info, save field
The overall idea of printing the stack is to obtain the information of the thread and the state of the thread to obtain the pointers of all the stacks in the thread. According to these pointers, the corresponding description is found in the symbol table, that is, symbolic analysis, so that the readable stack information can be displayed. What is the specific implementation? Let's talk about it in detail:
Get thread information
The first thing here is to get all the threads through task_threads,
Get detailed information of each thread through thread_info when traversing
Get information about all stacks in a thread
You can get all the stack pointers in the thread stack in the machine context through thread_get_state.
Create a stack structure to store stack data
Symbolic
The main idea of symbolization is to get the ASLR offset by subtracting the Slide address from the stack pointer address, through which the position of the string and symbol table can be found in the __LINKEDIT segment. The specific code is implemented as follows:
Points to pay attention to
It should be noted that this program has thread get state where it consumes performance. This is also checked by monitoring, so stack messages like this can be filtered out.
Ways to get more information
What's the benefit of getting more information like full-level method calls and time spent per method?
Time consumption can be measured in more detail, and time-consuming methods can be found. Faster interactive operations can make user experience better. Here are some scenarios that can be measured:
- Responsiveness
- button click
- Gesture operation
- Tab switching
- vc switching and transition
You can set a target for optimization, such as scrolling and animations to 60fps, and responding to user actions within 100ms. Then detect them one by one and fix them.
How to get more information?
All the called methods can be obtained through the hook objc_msgSend method, the tree structure of method calls can be obtained by recording the depth, and the time consumption of each method can be obtained by recording the time before and after execution, so that a complete performance consumption information can be obtained. .
The hook c function can use facebook's fishhook , and the method call tree structure can be obtained using InspectiveC . The following is a detailed introduction to their implementation:
Get method call tree structure
首先设计两个结构体,CallRecord 记录调用方法详细信息,包括 obj 和 SEL 等,ThreadCallStack 里面需要用 index 记录当前调用方法树的深度。有了 SEL 再通过 NSStringFromSelector 就能够取得方法名,有了 obj 通过 object_getClass 能够得到 Class 再用 NSStringFromClass 就能够获得类名。
存储读取 ThreadCallStack
pthread_setspecific() 可以将私有数据设置在指定线程上,pthread_getspecific() 用来读取这个私有数据,利用这个特性可以就可以将 ThreadCallStack 的数据和该线程绑定在一起,随时进行数据的存取。代码如下:
记录方法调用深度
因为要记录深度,而一个方法的调用里会有更多的方法调用,所以方法的调用写两个方法分别记录开始 pushCallRecord 和记录结束的时刻 popCallRecord,这样才能够通过在开始时对深度加一在结束时减一。
在 objc_msgSend 前后插入执行方法
最后是 hook objc_msgSend 需要在调用前和调用后分别加入 pushCallRecord 和 popCallRecord。因为需要在调用后这个时机插入一个方法,而且不可能编写一个保留未知参数并跳转到 c 中任意函数指针的函数,那么这就需要用到汇编来做到。
下面针对 arm64 进行分析,arm64 有31个64 bit 的整数型寄存器,用 x0 到 x30 表示,主要思路就是先入栈参数,参数寄存器是 x0 - x7,对于objc_msgSend方法来说 x0 第一个参数是传入对象,x1 第二个参数是选择器 _cmd。 syscall 的 number 会放到 x8 里。然后交换寄存器中,将用于返回的寄存器 lr 移到 x1 里。先让 pushCallRecord 能够执行,再执行原始的 objc_msgSend,保存返回值,最后让 popCallRecord 能执行。具体代码如下:
记录时间的方法
为了记录耗时,这样就需要在 pushCallRecord 和 popCallRecord 里记录下时间。下面列出一些计算一段代码开始到结束的时间的方法
第一种: NSDate 微秒
第二种:clock_t 微秒clock_t计时所表示的是占用CPU的时钟单元
第三种:CFAbsoluteTime 微秒
第四种:CFTimeInterval 纳秒
第五种:mach_absolute_time 纳秒
最后两种可用,本质区别
NSDate 或 CFAbsoluteTimeGetCurrent() 返回的时钟时间将会会网络时间同步,从时钟 偏移量的角度。mach_absolute_time() 和 CACurrentMediaTime() 是基于内建时钟的。选择一种,加到 pushCallRecord 和 popCallRecord 里,相减就能够获得耗时。
如何 hook msgsend 方法
那么 objc_msgSend 这个 c 方法是如何 hook 到的呢。首先了解下 dyld 是通过更新 Mach-O 二进制的 __DATA segment 特定的部分中的指针来邦定 lazy 和 non-lazy 符号,通过确认传递给 rebind_symbol 里每个符号名称更新的位置就可以找出对应替换来重新绑定这些符号。下面针对关键代码进行分析:
遍历 dyld
首先是遍历 dyld 里的所有的 image,取出 image header 和 slide。注意第一次调用时主要注册 callback。
找出符号表相关 Command
接下来需要找到符号表相关的 command,包括 linkedit segment command,symtab command 和 dysymtab command。方法如下:
获得 base 和 indirect 符号表
进行方法替换
有了符号表和传入的方法替换数组就可以进行符号表访问指针地址的替换,具体实现如下:
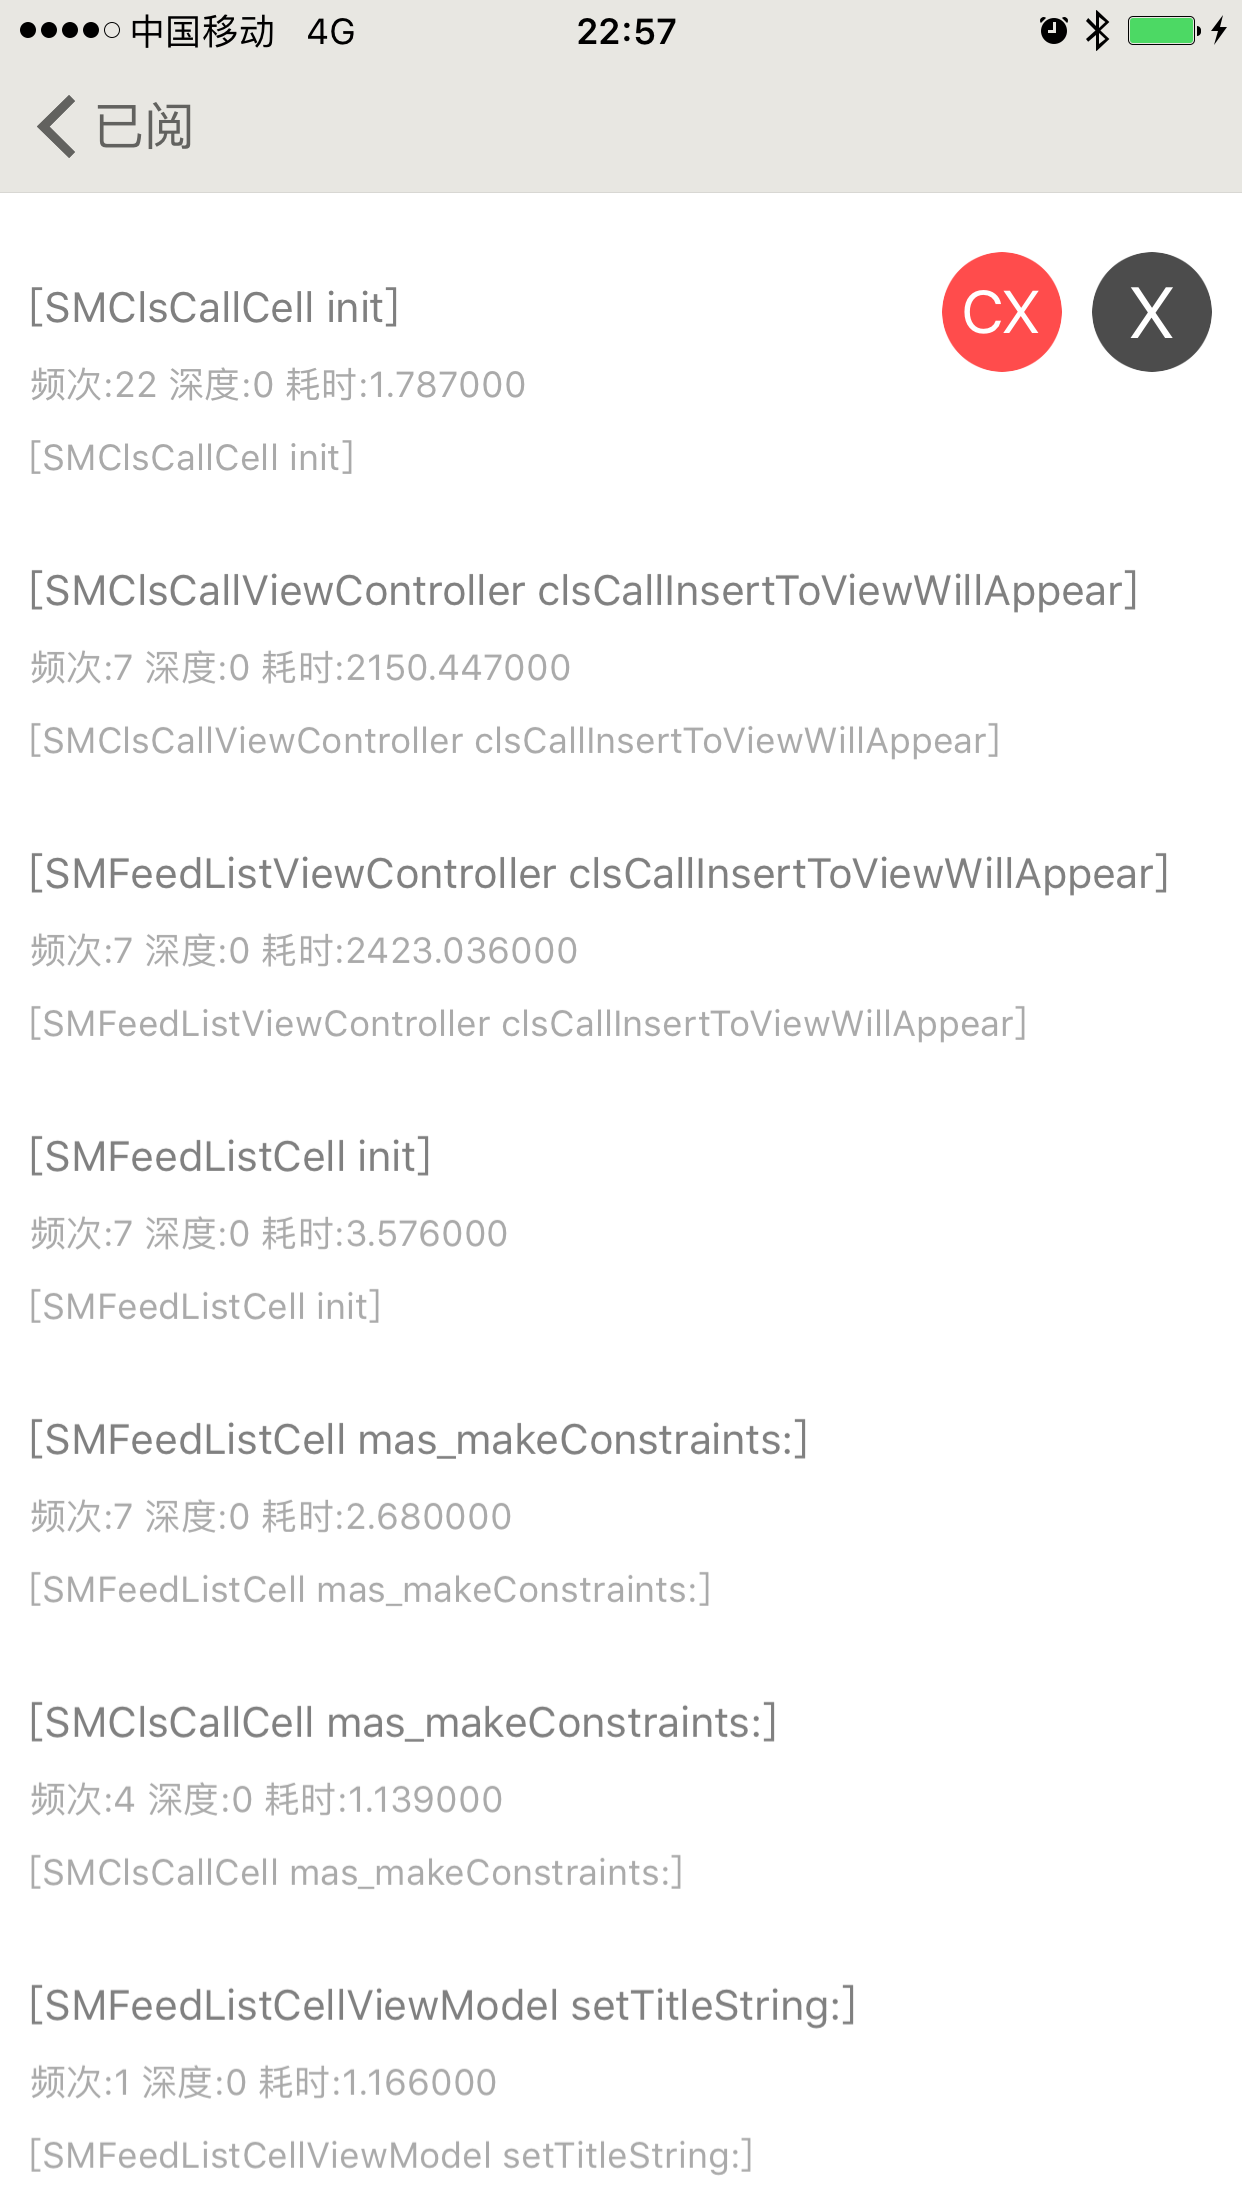
统计方法调用频次
在一些应用场景会有一些频繁的方法调用,有些方法的调用实际上是没有必要的,但是首先是需要将那些频繁调用的方法找出来这样才能够更好的定位到潜在的会造成性能浪费的方法使用。这些频繁调用的方法要怎么找呢?
大致的思路是这样,基于上面章节提到的记录方法调用深度的方案,将每个调用方法的路径保存住,调用相同路径的相同方法调用一次加一记录在数据库中,最后做一个视图按照调用次数的排序即可找到调用频繁的那些方法。下图是完成后展示的效果:
接下来看看具体实现方式
设计方法调用频次记录的结构
在先前时间消耗的 model 基础上增加路径,频次等信息
拼装方法路径
在遍历 SMCallTrace 记录的方法 model 和 遍历方法子方法时将路径拼装好,记录到数据库中
记录方法调用频次数据库
创建数据库
这里的 lastcall 是记录是否是最后一个方法的调用,展示时只取最后一个方法即可,因为也会有完整路径可以知道父方法和来源方法。
添加记录
添加记录时需要先检查数据库里是否有相同路径的同一个方法调用,这样可以给 frequency 字段加一已达到记录频次的目的。
检索记录
检索时注意按照调用频次字段进行排序即可。
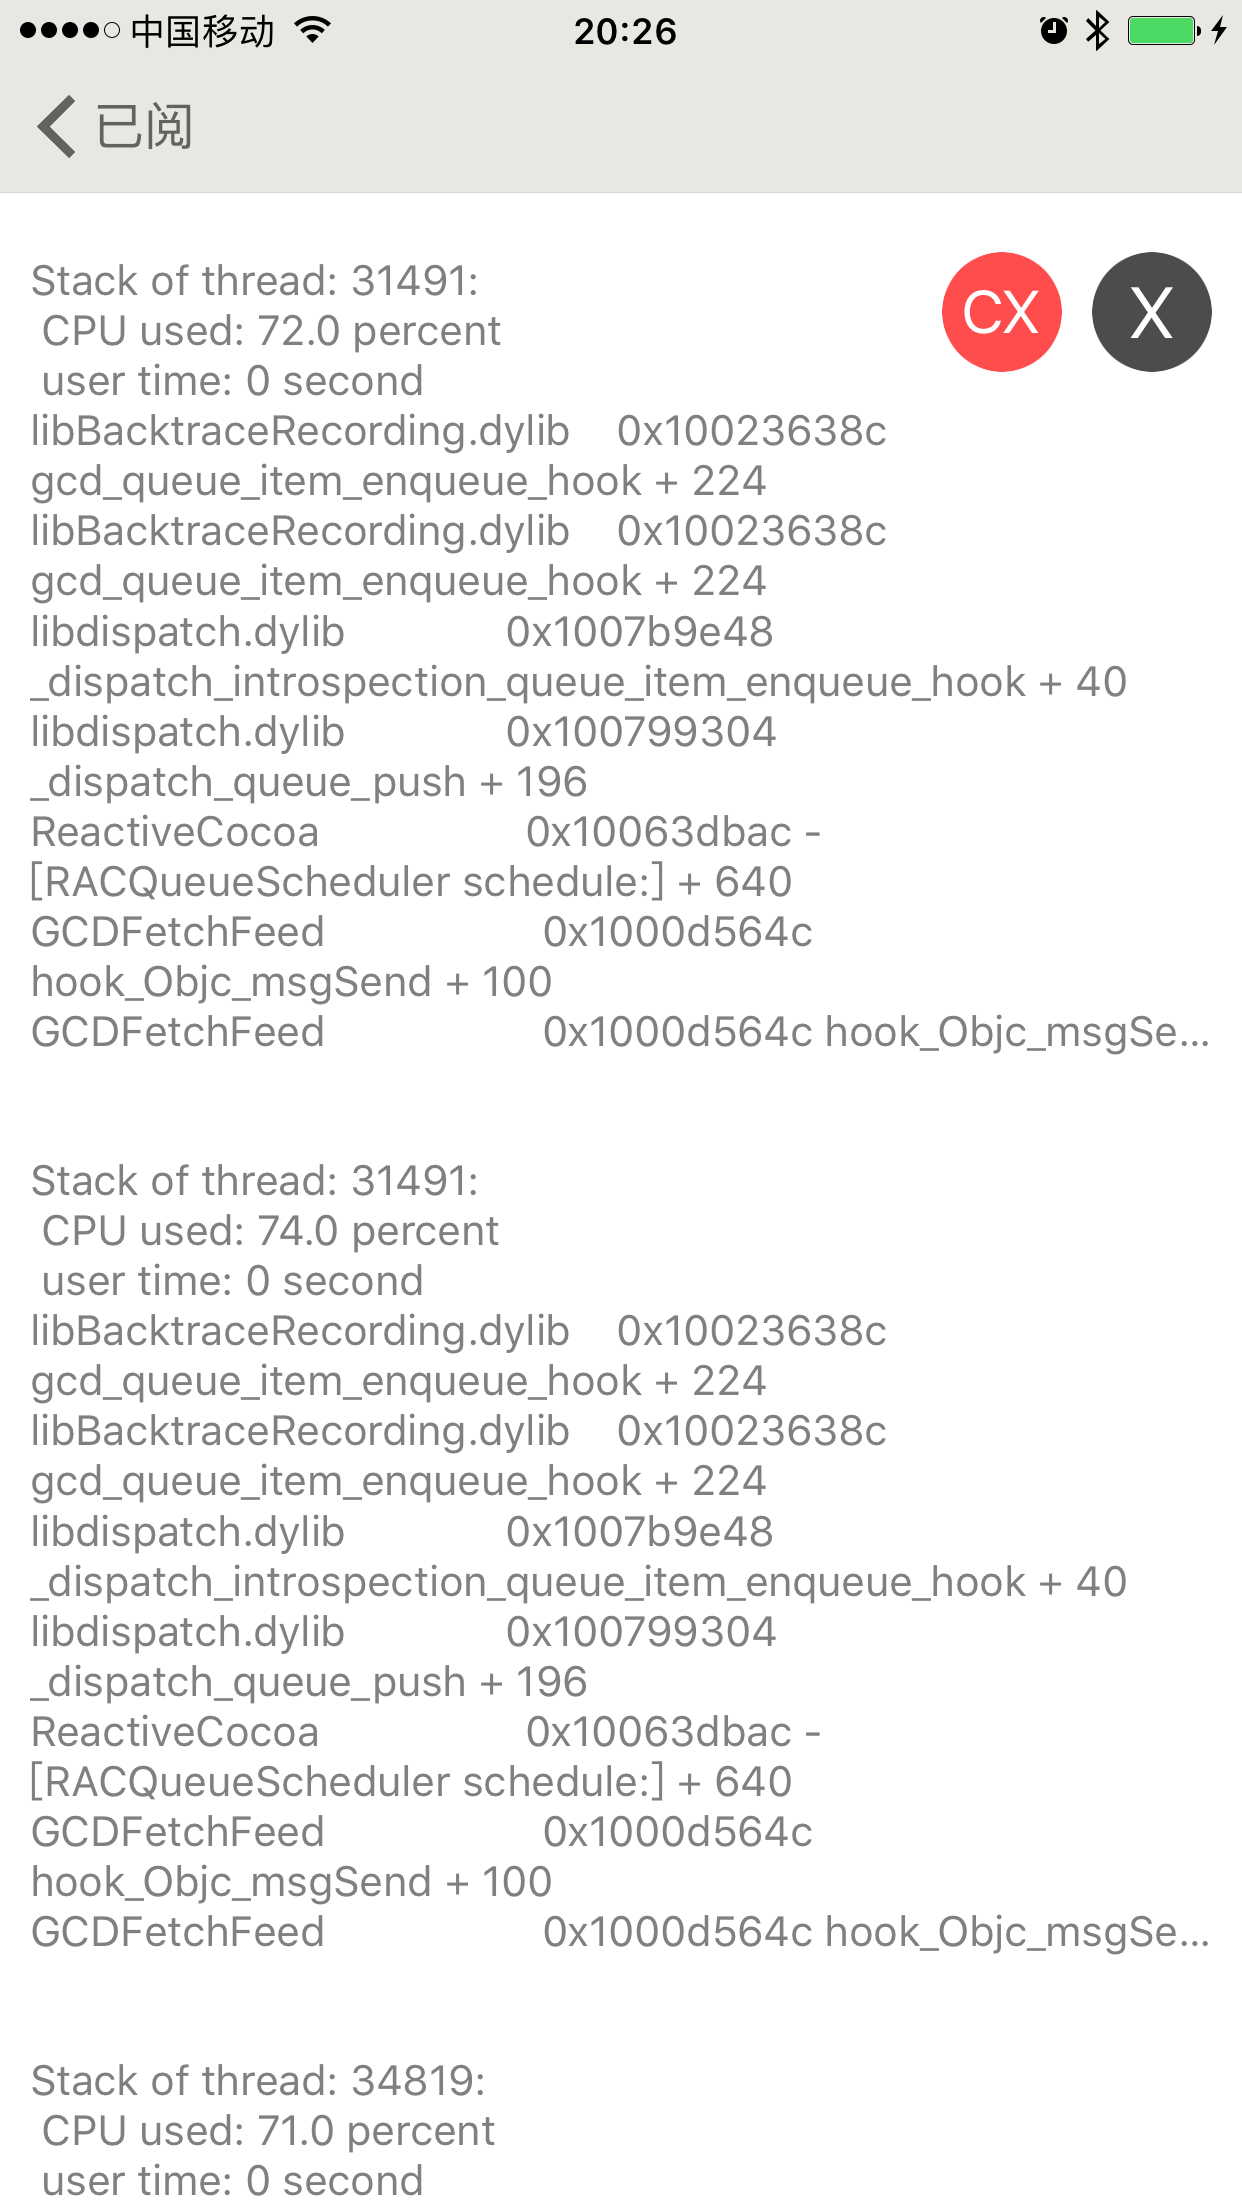
找出 CPU 使用大的线程堆栈
在前面检测卡顿打印的堆栈里提到使用 thread_info 能够获取到各个线程的 cpu 消耗,但是 cpu 不在主线程即使消耗很大也不一定会造成卡顿导致卡顿检测无法检测出更多 cpu 消耗的情况,所以只能通过轮询监控各线程里的 cpu 使用情况,对于超过标准值比如70%的进行记录来跟踪定位出耗电的那些方法。下图是列出 cpu 过载时的堆栈记录的展示效果:
有了前面的基础,实现起来轻松多了
Demo
工具已整合到先前做的 GCDFetchFeed 里。
- 子线程检测主线程卡顿使用的话在需要开始检测的地方添加 [[SMLagMonitor shareInstance] beginMonitor]; 即可。
- 需要检测所有方法调用的用法就是在需要检测的地方调用 [SMCallTrace start]; 就可以了,不检测打印出结果的话调用 stop 和 save 就好了。这里还可以设置最大深度和最小耗时检测来过滤不需要看到的信息。
- 方法调用频次使用可以在需要开始统计的地方加上 [SMCallTrace startWithMaxDepth:3]; 记录时使用 [SMCallTrace stopSaveAndClean]; 记录到到数据库中同时清理内存的占用。可以 hook VC 的 viewWillAppear 和 viewWillDisappear,在 appear 时开始记录,在 disappear 时记录到数据库同时清理一次。结果展示的 view controller 是 SMClsCallViewController,push 出来就能够看到列表结果。
资料
https://ming1016.github.io/2017/06/20/deeply-ios-performance-optimization/
WWDC
- WWDC 2013 224 Designing Code for Performance
- WWDC 2013 408 Optimizing Your Code Using LLVM
- WWDC 2013 712 Energy Best Practices
- WWDC 2014 710 writing energy efficient code part 1
- WWDC 2014 710 writing energy efficient code part 2
- WWDC 2015 230 performance on ios and watchos
- WWDC 2015 707 achieving allday battery life
- WWDC 2015 708 debugging energy issues
- WWDC 2015 718 building responsive and efficient apps with gcd
- WWDC 2016 406 optimizing app startup time
- WWDC 2016 719 optimizing io for performance and battery life
- WWDC 2017 238 writing energy efficient apps
- WWDC 2017 706 modernizing grand central dispatch usage