Chapter 10 Linux Daily Operation and Maintenance Management
10.1 View system load
w command
The w command is used to display a list of users who have logged in to the system and to display the commands that the user is executing. Execute this command to know who are the users who are currently logged in to the system and the programs they are executing. Execute the w command alone to display all users. You can also specify a user name to display only the relevant information of a certain user.
[root@cham2 ~]# w
 14:28:15 up  9:31,  1 user,  load average: 0.02, 0.04, 0.05
USER     TTY      FROM             LOGIN@   IDLE   JCPU   PCPU WHAT
root     pts/0    192.168.230.1    14:25    7.00s  0.42s  0.33s w
[root@cham2 ~]# date
2017年 11月 27日 星期一 14:29:57 CST
Description: The information displayed from the left in the first line is: time, system running time, number of logged-in users, and average load (1min average load, 5min average load, 15min average load).
Load average: The average load, that is, the number of active CPU processes per unit time. The larger the value, the greater the pressure on the server. Generally, the value does not exceed the number of CPUs.
View the number of server CPUs (cat /proc/cpuinfo)
[root@cham2 ~]# cat /proc/cpuinfo
processor	: 0
vendor_id	: GenuineIntel
cpu family	: 6
model		: 158
model name	: Intel(R) Core(TM) i7-7700HQ CPU @ 2.80GHz
stepping	: 9
microcode	: 0x42
cpu MHz		: 2807.818
cache size	: 6144 KB
physical id	: 0
siblings	: 2
core id		: 0
cpu cores	: 2
apicid		: 0
initial apicid	: 0
fpu		: yes
fpu_exception	: yes
cpuid level	: 22
wp		: yes
flags		: fpu vme de pse tsc msr pae mce cx8 apic sep mtrr pge mca cmov pat pse36 clflush dts mmx fxsr sse sse2 ss ht syscall nx pdpe1gb rdtscp lm constant_tsc arch_perfmon pebs bts nopl xtopology tsc_reliable nonstop_tsc aperfmperf pni pclmulqdq ssse3 fma cx16 pcid sse4_1 sse4_2 x2apic movbe popcnt aes xsave avx f16c rdrand hypervisor lahf_lm 3dnowprefetch ida arat epb pln pts dtherm hwp hwp_noitfy hwp_act_window hwp_epp fsgsbase smep
bogomips	: 5615.99
clflush size	: 64
cache_alignment	: 64
address sizes	: 40 bits physical, 48 bits virtual
power management:

processor	: 1
vendor_id	: GenuineIntel
cpu family	: 6
model		: 158
model name	: Intel(R) Core(TM) i7-7700HQ CPU @ 2.80GHz
stepping	: 9
microcode	: 0x42
cpu MHz		: 2807.818
cache size	: 6144 KB
physical id	: 0
siblings	: 2
core id		: 1
cpu cores	: 2
apicid		: 1
initial apicid	: 1
fpu		: yes
fpu_exception	: yes
cpuid level	: 22
wp		: yes
flags		: fpu vme de pse tsc msr pae mce cx8 apic sep mtrr pge mca cmov pat pse36 clflush dts mmx fxsr sse sse2 ss ht syscall nx pdpe1gb rdtscp lm constant_tsc arch_perfmon pebs bts nopl xtopology tsc_reliable nonstop_tsc aperfmperf pni pclmulqdq ssse3 fma cx16 pcid sse4_1 sse4_2 x2apic movbe popcnt aes xsave avx f16c rdrand hypervisor lahf_lm 3dnowprefetch ida arat epb pln pts dtherm hwp hwp_noitfy hwp_act_window hwp_epp fsgsbase smep
bogomips	: 5615.99
clflush size	: 64
cache_alignment	: 64
address sizes	: 40 bits physical, 48 bits virtual
power management:
Note: Here, professor is the number of system CPUs.
uptime command
The >uptime command prints how long the system has been running in total and the system load average. The information displayed by the uptime command is displayed in order: the current time, how long the system has been running, how many users are currently logged in, and the average load of the system in the past 1 minute, 5 minutes, and 15 minutes.
[root@cham2 ~]# uptime
 14:40:13 up  9:43,  1 user,  load average: 0.00, 0.01, 0.05
[root@cham2 ~]# w
 14:40:22 up  9:43,  1 user,  load average: 0.00, 0.01, 0.05
USER     TTY      FROM             LOGIN@   IDLE   JCPU   PCPU WHAT
root     pts/0    192.168.230.1    14:25    6.00s  0.15s  0.02s w
Note: The information obtained by uptime is the same as the result of the first line of w. So just use w command
(tty parsing
>TTY devices include virtual consoles, serial ports, and pseudo-terminal devices.
Under the device special file directory /dev/ of the Linux system, the terminal special device files generally have the following types:
-
Serial Port
A Serial Port Terminal is a terminal device connected using a computer's serial port. The computer sees each serial port as a character device. The device names corresponding to these serial ports are: /dev/tts/0 (or /dev/ttyS0), /dev/tts/1 (or /dev/ttyS1), etc. The device numbers are (4,0), (4,1), etc., corresponding to COM1, COM2, etc. under the DOS system, respectively. -
Pseudo Terminal
Pseudo Terminal (Pseudo Terminal) is a pair of logical terminal devices (ie master and slave devices, the operation of the master will be reflected on the slave). -
Controlling Terminal
If the current process has a Controlling Terminal, then /dev/tty is the device special file of the current process's controlling terminal. You can use the command "ps -ax" to see which controlling terminal a process is connected to. For the shell you are logged into, /dev/tty is the terminal you are using and the device number is (5,0). Use the command "tty" to see which actual terminal device it corresponds to. /dev/tty is somewhat like a link to the actual terminal device in use. -
Console
In Linux systems, the computer monitor is often referred to as the console terminal (Console). It emulates a terminal of type Linux (TERM=Linux) and has some device special files associated with it: tty0, tty1, tty2, etc. When you log in on the console, tty1 is used. When using the Alt+[F1-F6] key combination, we can switch to tty2, tty3, etc. tty1–tty6, etc. are called virtual terminals, and tty0 is an alias of the currently used virtual terminal, and the information generated by the system will be sent to the terminal (also called the console terminal at this time). So no matter which virtual terminal is currently in use, system information is sent to the console terminal. /dev/console is the console, which is a device that interacts with the operating system. The system outputs some information directly to the console. Users are allowed to log in to the console only in single-user mode. -
Virtual terminal
A pseudo terminal in Xwindow mode. For example, konsole is used in Kubuntu, which is a virtual terminal. You can see /dev/pts/name with the tty command, and name is the current user name. )
10.2 The vmstat command
The meaning of the >vmstat command is to display the virtual memory status ("Viryual Memor Statics"), which can report the overall operating status of the system such as processes, memory, and I/O.
vmstat usage
grammar:
vmstat
means to statically display the memory status once. vmstat 1 5
[root@cham2 ~]# vmstat
procs -----------memory---------- ---swap-- -----io---- -system-- ------cpu-----
 r  b   swpd   free   buff  cache   si   so    bi    bo   in   cs us sy id wa st
 2  0      0 740108    876 149756    0    0     2     0   15   22  0  0 100  0  0
vmstat [n] where n represents a number
, which means that the memory status is dynamically displayed at a frequency of n seconds each time (press Ctrl+c to end the command).
vmstat [n] [m]
means to display every n seconds, and the command ends after displaying m times!
[root@adai003 ~]# vmstat 1 3[root@cham2 ~]# vmstat 1
procs -----------memory---------- ---swap-- -----io---- -system-- ------cpu-----
r b swpd free buff cache si so bi bo in cs us sy id wa st
1 0 0 739900 876 149788 0 0 2 0 15 22 0 0 100 0 0
0 0 0 739900 876 149788 0 0 0 0 92 62 0 0 100 0 0
0 0 0 739900 876 149788 0 0 0 0 24 35 0 0 100 0 0
0 0 0 739900 876 149788 0 0 0 0 70 56 0 0 100 0 0
0 0 0 739900 876 149788 0 0 0 0 27 43 0 0 100 0 0
0 0 0 739900 876 149788 0 0 0 0 39 53 0 0 100 0 0
0 0 0 739900 876 149788 0 0 0 0 41 43 0 0 100 0 0
0 0 0 739900 876 149788 0 0 0 0 77 61 0 1 100 0 0
0 0 0 739900 876 149788 0 0 0 0 25 39 0 0 100 0 0
^C
[root@cham2 ~]# vmstat 1 5
procs -----------memory---------- ---swap-- -----io---- -system-- ------cpu-----
r b swpd free buff cache si so bi bo in cs us sy id wa st
1 0 0 739916 876 149788 0 0 2 0 15 22 0 0 100 0 0
0 0 0 739904 876 149788 0 0 0 0 51 50 0 0 100 0 0
0 0 0 739904 876 149788 0 0 0 0 26 39 0 0 100 0 0
0 0 0 739904 876 149788 0 0 0 0 31 42 0 0 100 0 0
0 0 0 739904 876 149788 0 0 0 0 25 37 0 0 100 0 0
illustrate:
- proc displays process related information
- r:=run, indicating the number of processes running or waiting for the CPU to run. If the number is greater than the number of server CPUs for a long time, it means that the CPU is not enough.
- b: Indicates the number of processes waiting for resources, such as waiting for I/O, memory, etc. If the value of this column is greater than 1 for a long time, you need to pay attention.
- memory memory related information
- swpd: Indicates the amount of memory to switch to the swap partition (when the data keeps changing, it means insufficient memory)
- free: Indicates the current amount of free memory
- buff: buffer size
- cache: cache size
- swap memory swap situation
- si:=storage in, indicating the amount of data written to the memory by the swap area
- so:=storage out, indicating the amount of data written to the swap area by the memory
- io disk usage
- bi:=block in, indicating the amount of data read (written to memory) from the block device (ie: read from disk)
- bo:=block out, which means (read from memory) data written to the block device (ie: write to disk)
Note: The data here will be directly related to the value of b output by proc.
- system Displays the number of interrupts that occurred within the acquisition interval
- in: Indicates the number of device interrupts per second observed in a time interval
- cs: Indicates the number of context switches generated per second
- CPU Display CPU usage status (us+sy+id=100%)
- us: Indicates the percentage of CPU spent by user resources (when the value is greater than 50 for a long time, it means that the number of CPUs is insufficient)
- sy: Indicates the percentage of CPU spent by system resources
- id: Indicates the percentage of CPU that is idle
- wa:=wait, indicating the percentage of CPU waiting to be used (a large value indicates insufficient CPU)
- st: Indicates the percentage of stolen CPU (this value is generally 0, do not pay attention)
10.3 top command
The >top command can dynamically view the overall running status of the system in real time (changes every 3 seconds), and is a practical tool that integrates multi-party information to monitor system performance and running information. The interactive interface provided by the top command can be managed with hotkeys. Its characteristic is to put the process that occupies the highest system resources (CPU, memory, disk IO, etc.) at the front to confirm which process occupies the memory.
top usage
Syntax: top [options]
Options:
-b: batch processing mode
-c: display detailed process information
-bn1: statically display all processes (this method is mostly used in shell scripts)
[root@cham2 ~]# top
top - 15:30:59 up 10:34,  1 user,  load average: 0.00, 0.01, 0.05
Tasks:  99 total,   1 running,  98 sleeping,   0 stopped,   0 zombie
%Cpu(s):  0.0 us,  0.0 sy,  0.0 ni,100.0 id,  0.0 wa,  0.0 hi,  0.0 si,  0.0 st
KiB Mem :  1008416 total,   739152 free,   118364 used,   150900 buff/cache
KiB Swap:  3905532 total,  3905532 free,        0 used.   729416 avail Mem

  PID USER      PR  NI    VIRT    RES    SHR S  %CPU %MEM     TIME+ COMMAND
    1 root      20   0  125096   3596   2392 S   0.0  0.4   0:02.24 systemd
    2 root      20   0       0      0      0 S   0.0  0.0   0:00.03 kthreadd
    3 root      20   0       0      0      0 S   0.0  0.0   0:00.00 ksoftirqd/0
    5 root       0 -20       0      0      0 S   0.0  0.0   0:00.00 kworker/0:0H
    7 root      rt   0       0      0      0 S   0.0  0.0   0:00.04 migration/0
    8 root      20   0       0      0      0 S   0.0  0.0   0:00.00 rcu_bh
    9 root      20   0       0      0      0 S   0.0  0.0   0:02.57 rcu_sched
   10 root      rt   0       0      0      0 S   0.0  0.0   0:00.15 watchdog/0
   11 root      rt   0       0      0      0 S   0.0  0.0   0:00.44 watchdog/1
   12 root      rt   0       0      0      0 S   0.0  0.0   0:00.13 migration/1
   13 root      20   0       0      0      0 S   0.0  0.0   0:00.07 ksoftirqd/1
   17 root       0 -20       0      0      0 S   0.0  0.0   0:00.00 khelper
   18 root      20   0       0      0      0 S   0.0  0.0   0:00.00 kdevtmpfs
   19 root       0 -20       0      0      0 S   0.0  0.0   0:00.00 netns
   20 root      20   0       0      0      0 S   0.0  0.0   0:00.01 khungtaskd
   21 root       0 -20       0      0      0 S   0.0  0.0   0:00.00 writeback
   22 root       0 -20       0      0      0 S   0.0  0.0   0:00.00 kintegrityd
   23 root       0 -20       0      0      0 S   0.0  0.0   0:00.00 bioset
   24 root       0 -20       0      0      0 S   0.0  0.0   0:00.00 kblockd
   25 root       0 -20       0      0      0 S   0.0  0.0   0:00.00 md
   26 root      20   0       0      0      0 S   0.0  0.0   0:15.20 kworker/0:1
   32 root      20   0       0      0      0 S   0.0  0.0   0:00.00 kswapd0
   33 root      25   5       0      0      0 S   0.0  0.0   0:00.00 ksmd
   34 root      39  19       0      0      0 S   0.0  0.0   0:00.15 khugepaged
   35 root      20   0       0      0      0 S   0.0  0.0   0:00.00 fsnotify_mark
   36 root       0 -20       0      0      0 S   0.0  0.0   0:00.00 crypto
   44 root       0 -20       0      0      0 S   0.0  0.0   0:00.00 kthrotld
   45 root      20   0       0      0      0 S   0.0  0.0   0:00.00 kworker/u128:1
   46 root       0 -20       0      0      0 S   0.0  0.0   0:00.00 kmpath_rdacd
   47 root       0 -20       0      0      0 S   0.0  0.0   0:00.00 kpsmoused
   49 root       0 -20       0      0      0 S   0.0  0.0   0:00.00 ipv6_addrconf
   68 root       0 -20       0      0      0 S   0.0  0.0   0:00.00 deferwq
  100 root      20   0       0      0      0 S   0.0  0.0   0:00.00 kauditd
  239 root       0 -20       0      0      0 S   0.0  0.0   0:00.00 ata_sff
  241 root      20   0       0      0      0 S   0.0  0.0   0:00.01 scsi_eh_0
  243 root       0 -20       0      0      0 S   0.0  0.0   0:00.00 scsi_tmf_0
  245 root      20   0       0      0      0 S   0.0  0.0   0:00.00 scsi_eh_1
  246 root       0 -20       0      0      0 S   0.0  0.0   0:00.00 scsi_tmf_1
  247 root      20   0       0      0      0 S   0.0  0.0   0:01.19 kworker/u128:2
  250 root       0 -20       0      0      0 S   0.0  0.0   0:00.00 ttm_swap
  257 root       0 -20       0      0      0 S   0.0  0.0   0:00.00 mpt_poll_0
  258 root       0 -20       0      0      0 S   0.0  0.0   0:00.00 mpt/0
  265 root      20   0       0      0      0 S   0.0  0.0   0:00.00 scsi_eh_2
  266 root       0 -20       0      0      0 S   0.0  0.0   0:00.00 scsi_tmf_2
  288 root       0 -20       0      0      0 S   0.0  0.0   0:00.00 xfsalloc
  289 root       0 -20       0      0      0 S   0.0  0.0   0:00.00 xfs_mru_cache
Note: In the top state (press q to exit), press shift+m to sort by memory usage (default is to sort by CPU usage ratio), press shift+p to resume sorting by CPU usage ratio, press the number 1 to sort Displays the status of each CPU.
illustrate:
- The first line is the load information
- The second line is the process information
- The third line is the CPU usage information
- The fourth line is the memory usage information
- The fifth line is the swap area usage information
- At the bottom are the process details:
- PID: Indicates the id number of the process in the system, which can be used with the kill command to end a process
- RES: Indicates the size of the physical memory used by the process (unit: KB)
- %MEM: indicates the percentage of memory usage (unit: KB)
10.4 The sar command
The >sar command is a system running status statistics tool under Linux, which displays the specified operating system status (such as average load, network card traffic, disk status, memory usage, etc.) counters to the standard output device. It is different from other system status monitoring tools in that it can print historical information and display system status information from zero to the current moment.
sar usage
Install the command with 'yum install -y sysstat'! The first use of the sar command (without options and parameters) will report an error because the sar command has not yet generated the corresponding database file. Its database is stored in the '/var/log/sa/' directory, which stores two kinds of files, named in the format of 'sa date' & 'sar date' (the difference is that the sar file is generated on the next day, you can Use the cat command to view; the sa file is generated in real time <every full '10' minutes>, it is a binary file and cannot be viewed), and it is retained for a maximum of one month.
Syntax: sar [options] [parameters]
Options:
-f: Extract report from specified file
- sar -n DEV mn View network card traffic (the usage of m and n here is the same as the vmstat command!)
[root@cham2 ~]# yum install -y sysstat   没有sar命令的话需要安装
已加载插件:fastestmirror


已安装:
  sysstat.x86_64 0:10.1.5-12.el7

作为依赖被安装:
  lm_sensors-libs.x86_64 0:3.4.0-4.20160601gitf9185e5.el7

完毕!
[root@cham2 ~]# sar
无法打开 /var/log/sa/sa27: 没有那个文件或目录
[root@cham2 ~]# ls /var/log/sa
sa27
[root@cham2 ~]# date
2017年 11月 27日 星期一 18:40:52 CST
[root@cham2 ~]# sar -n DEV 1 10
Linux 3.10.0-514.el7.x86_64 (cham2) 	2017年11月27日 	_x86_64_	(2 CPU)

18时41分19秒     IFACE   rxpck/s   txpck/s    rxkB/s    txkB/s   rxcmp/s   txcmp/s  rxmcst/s
18时41分20秒        lo      0.00      0.00      0.00      0.00      0.00      0.00      0.00
18时41分20秒     ens33      0.00      0.00      0.00      0.00      0.00      0.00      0.00

18时41分20秒     IFACE   rxpck/s   txpck/s    rxkB/s    txkB/s   rxcmp/s   txcmp/s  rxmcst/s
18时41分21秒        lo      0.00      0.00      0.00      0.00      0.00      0.00      0.00
18时41分21秒     ens33      1.00      1.00      0.06      0.40      0.00      0.00      0.00

18时41分21秒     IFACE   rxpck/s   txpck/s    rxkB/s    txkB/s   rxcmp/s   txcmp/s  rxmcst/s
18时41分22秒        lo      0.00      0.00      0.00      0.00      0.00      0.00      0.00
18时41分22秒     ens33      1.00      1.00      0.06      0.40      0.00      0.00      0.00

18时41分22秒     IFACE   rxpck/s   txpck/s    rxkB/s    txkB/s   rxcmp/s   txcmp/s  rxmcst/s
18时41分23秒        lo      0.00      0.00      0.00      0.00      0.00      0.00      0.00
18时41分23秒     ens33      1.00      1.00      0.06      0.40      0.00      0.00      0.00

18时41分23秒     IFACE   rxpck/s   txpck/s    rxkB/s    txkB/s   rxcmp/s   txcmp/s  rxmcst/s
18时41分24秒        lo      0.00      0.00      0.00      0.00      0.00      0.00      0.00
18时41分24秒     ens33      1.00      1.00      0.06      0.40      0.00      0.00      0.00

18时41分24秒     IFACE   rxpck/s   txpck/s    rxkB/s    txkB/s   rxcmp/s   txcmp/s  rxmcst/s
18时41分25秒        lo      0.00      0.00      0.00      0.00      0.00      0.00      0.00
18时41分25秒     ens33      1.00      1.00      0.06      0.40      0.00      0.00      0.00

18时41分25秒     IFACE   rxpck/s   txpck/s    rxkB/s    txkB/s   rxcmp/s   txcmp/s  rxmcst/s
18时41分26秒        lo      0.00      0.00      0.00      0.00      0.00      0.00      0.00
18时41分26秒     ens33      1.00      1.00      0.06      0.40      0.00      0.00      0.00

18时41分26秒     IFACE   rxpck/s   txpck/s    rxkB/s    txkB/s   rxcmp/s   txcmp/s  rxmcst/s
18时41分27秒        lo      0.00      0.00      0.00      0.00      0.00      0.00      0.00
18时41分27秒     ens33      1.00      1.00      0.06      0.40      0.00      0.00      0.00

18时41分27秒     IFACE   rxpck/s   txpck/s    rxkB/s    txkB/s   rxcmp/s   txcmp/s  rxmcst/s
18时41分28秒        lo      0.00      0.00      0.00      0.00      0.00      0.00      0.00
18时41分28秒     ens33      1.00      1.00      0.06      0.40      0.00      0.00      0.00

18时41分28秒     IFACE   rxpck/s   txpck/s    rxkB/s    txkB/s   rxcmp/s   txcmp/s  rxmcst/s
18时41分29秒        lo      0.00      0.00      0.00      0.00      0.00      0.00      0.00
18时41分29秒     ens33      1.00      1.00      0.06      0.40      0.00      0.00      0.00

平均时间:     IFACE   rxpck/s   txpck/s    rxkB/s    txkB/s   rxcmp/s   txcmp/s  rxmcst/s
平均时间:        lo      0.00      0.00      0.00      0.00      0.00      0.00      0.00
平均时间:     ens33      0.90      0.90      0.05      0.36      0.00      0.00      0.00
illustrate:
-
rxpck/s: Indicates the number of received data (packets)
-
txpck/s: Indicates the number of sent data (packets)
-
rxKB/s: Indicates the amount of data received
-
txKB/s: indicates the amount of data sent
Note: When the value of rxpck/s is greater than 4000 or the value of rxKB/s is greater than 5000, it may be under attack (need to cooperate with the packet capture tool for further confirmation)!
sar -q View system load (use with -f option to view historical load)
[root@cham2 ~]# sar -n DEV  -f /var/log/sa/sa27
Linux 3.10.0-514.el7.x86_64 (cham2) 	2017年11月27日 	_x86_64_	(2 CPU)

18时40分01秒     IFACE   rxpck/s   txpck/s    rxkB/s    txkB/s   rxcmp/s   txcmp/s  rxmcst/s
18时50分01秒        lo      0.00      0.00      0.00      0.00      0.00      0.00      0.00
18时50分01秒     ens33      0.25      0.18      0.02      0.03      0.00      0.00      0.00
平均时间:        lo      0.00      0.00      0.00      0.00      0.00      0.00      0.00
平均时间:     ens33      0.25      0.18      0.02      0.03      0.00      0.00      0.00
sar -b View disk information
[root@cham2 ~]# sar -b
Linux 3.10.0-514.el7.x86_64 (cham2) 	2017年11月27日 	_x86_64_	(2 CPU)

18时40分01秒       tps      rtps      wtps   bread/s   bwrtn/s
18时50分01秒      0.05      0.00      0.05      0.00      0.57
平均时间:      0.05      0.00      0.05      0.00      0.57
[root@cham2 ~]# sar -b 1 5
Linux 3.10.0-514.el7.x86_64 (cham2) 	2017年11月27日 	_x86_64_	(2 CPU)

18时52分24秒       tps      rtps      wtps   bread/s   bwrtn/s
18时52分25秒      0.00      0.00      0.00      0.00      0.00
18时52分26秒      0.00      0.00      0.00      0.00      0.00
18时52分27秒      0.00      0.00      0.00      0.00      0.00
18时52分28秒      0.00      0.00      0.00      0.00      0.00
18时52分29秒      0.00      0.00      0.00      0.00      0.00
平均时间:      0.00      0.00      0.00      0.00      0.00
10.5 nload command
This command needs to be installed before use:
[root@cham2 ~]# yum install epel-release
已加载插件:fastestmirror


[root@cham2 ~]# yum install -y nload
已加载插件:fastestmirror
Note: Before installing this package, you need to install the yum extension source: epel-release.
Usage: nload
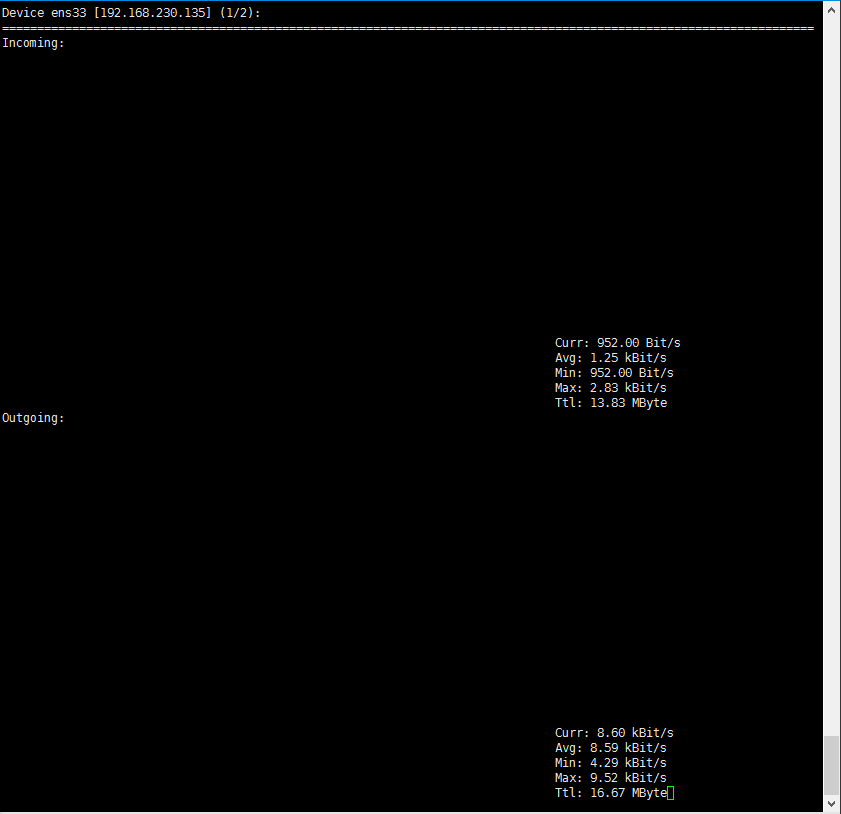
Note: The dynamic information of the system network is displayed in this interface. You can use the arrow keys to switch between different network cards, and press the q key to exit. You can evaluate the network status according to the comparison between the real-time network speed and the total network speed!