Container monitoring environments come in many shapes and sizes. Some are open source, while others are commercial in nature. Some can be deployed with one click of the platform (such as deploying these monitoring applications in the Rancher container management platform's application catalog), while others require manual configuration. Some are generic and some are specific to container environments. Some are hosted in the public cloud, while others require installation on their own cluster hosts.
In this article, I will provide a comprehensive analysis and comparison of 10 monitoring solutions in the container space. The sheer number of monitoring solutions is daunting. New solutions continue to emerge, while existing solutions continue to evolve. Instead of delving into each solution, I took a high-level comparison approach. In this way, readers can "narrow down the list" and perform a more careful assessment of their needs to select the most suitable solution.
The monitoring solutions described and compared in this article include:
● Primitive Docker
● cAdvisor
● Scout
● Pingdom
● Datadog
● Sysdig
● Prometheus
● Heapster / GrafanaPingdom
● ELK
● Sense
In this article, we will introduce the first 5 solutions.
In the following sections, I present an architecture for comparing monitoring solutions and provide a high-level comparison of each solution, then discuss each solution in more detail by discussing how each solution will work with Rancher details. I'll also talk about some other monitoring solutions at the end that aren't included in the "Top 10" of this article, but you may have encountered.
Compare Architecture
One challenge in objectively comparing monitoring solutions is that solutions can vary widely in architecture, functionality, deployment models, and cost. One solution can extract and graph docker-related data from a single host, while another can collect data from many hosts, measure application response time, and send automated alerts under certain conditions.
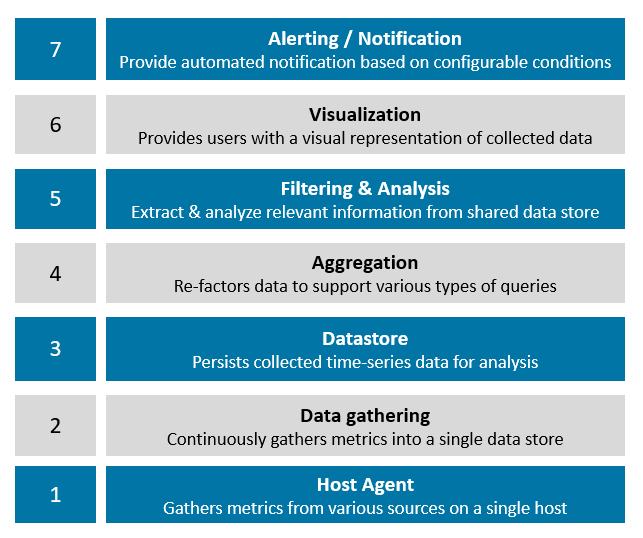
When comparing solutions, first determine a comparison architecture, which will be of great help for later comparison work. I arbitrarily put forward the comparison architecture shown in the figure below, using the functional layer that most monitoring solutions have as the basis for my comparison. This comparison architecture can be divided into 7 layers:
Host Agent - The host agent represents the "limb" of the monitoring solution and pulls in time series data from various sources such as APIs and log files. Host agents are typically installed on each cluster host (whether on-premises or in the cloud), and they are typically packaged into Docker containers for easy deployment and management.
Data Collection Architecture - While single-host data is sometimes useful, administrators may need a unified view of all hosts and applications. Monitoring solutions usually have some mechanism to collect data from each host and save it in a shared data store.
Data Stores - Data stores may be traditional databases, but a more common form is a scalable distributed database optimized for time-series data consisting of key-value pairs. Some solutions have native data storage, while others use open source data storage plugins.
Aggregation Engine - One of the big problems with storing raw data from dozens of hosts is that the amount of data can get too large. Monitoring architectures often provide data aggregation capabilities that periodically transform raw data into unified metrics (such as hourly or daily aggregates), purge old data that is no longer needed, or re-break down data in some way to support expected Inquiry and Analysis.
Filtering and Analysis - A monitoring solution is like the insights you get from your data. Screening and analysis capabilities often vary widely between monitoring solutions. Some solutions only support some prepackaged queries in the form of simple time series graphs, while others have customizable dashboards, embedded query languages, and sophisticated analytics.
Visualization Layer - Monitoring tools typically have a visualization layer where users can interact with the web interface to generate charts, formulate queries, and in some cases define alert conditions. The visualization layer may be tightly coupled with filtering and analysis functions, or it may be separate from it depending on the solution.
Alerting and Notifications - Few administrators have the time to sit and watch monitoring charts all day. Another common feature of monitoring systems is an alerting subsystem that can notify administrators if predefined thresholds are met or exceeded.
In addition to understanding how each monitoring solution implements the above basic functions, the following aspects should also be paid attention to and considered by users when choosing a monitoring solution:
›Integrity of the solution
›Easy to install and configure
›Details about the web user interface
› Ability to forward alerts to external services
›Level of community support and engagement (if the solution is an open source project)
› Availability in the Rancher App Catalog
› Supports monitoring of non-container environments and applications
›Native Kubernetes support (Pods, Services, Namespaces, etc.)
› Extensibility (API, other interfaces)
›Deployment models (self-hosted, hosted on the cloud)
>cost
Top 10 Surveillance Solutions Compared
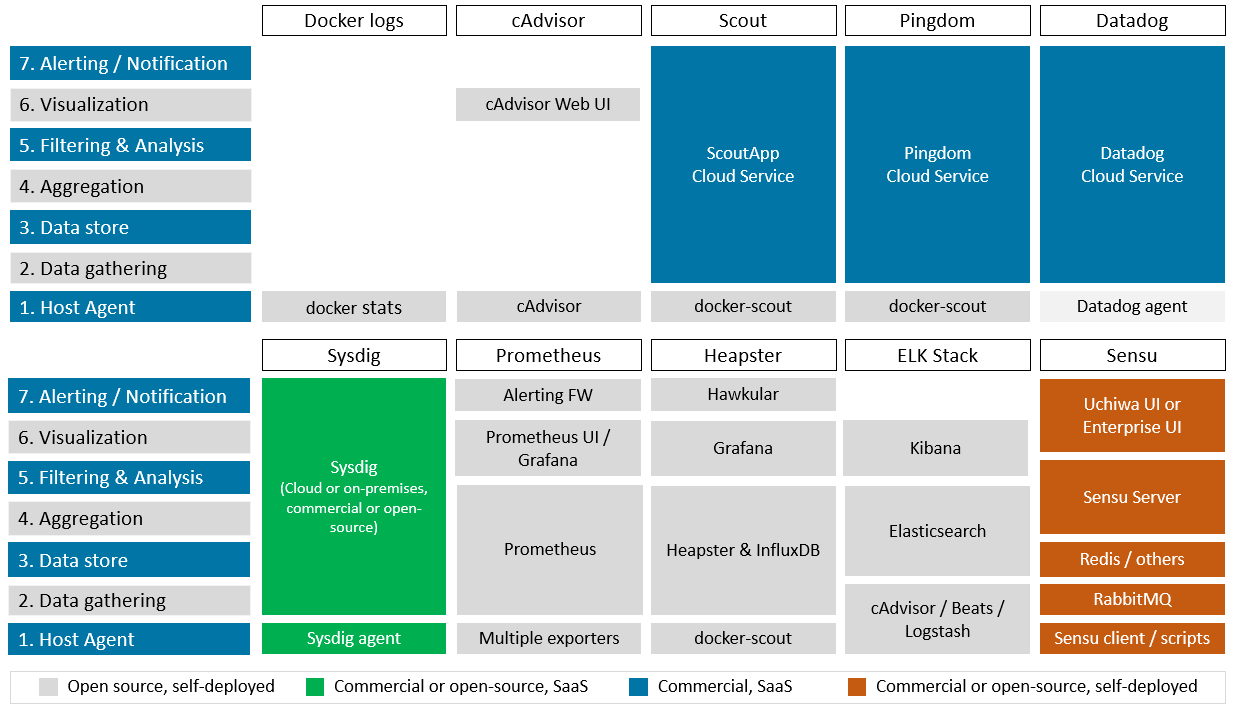
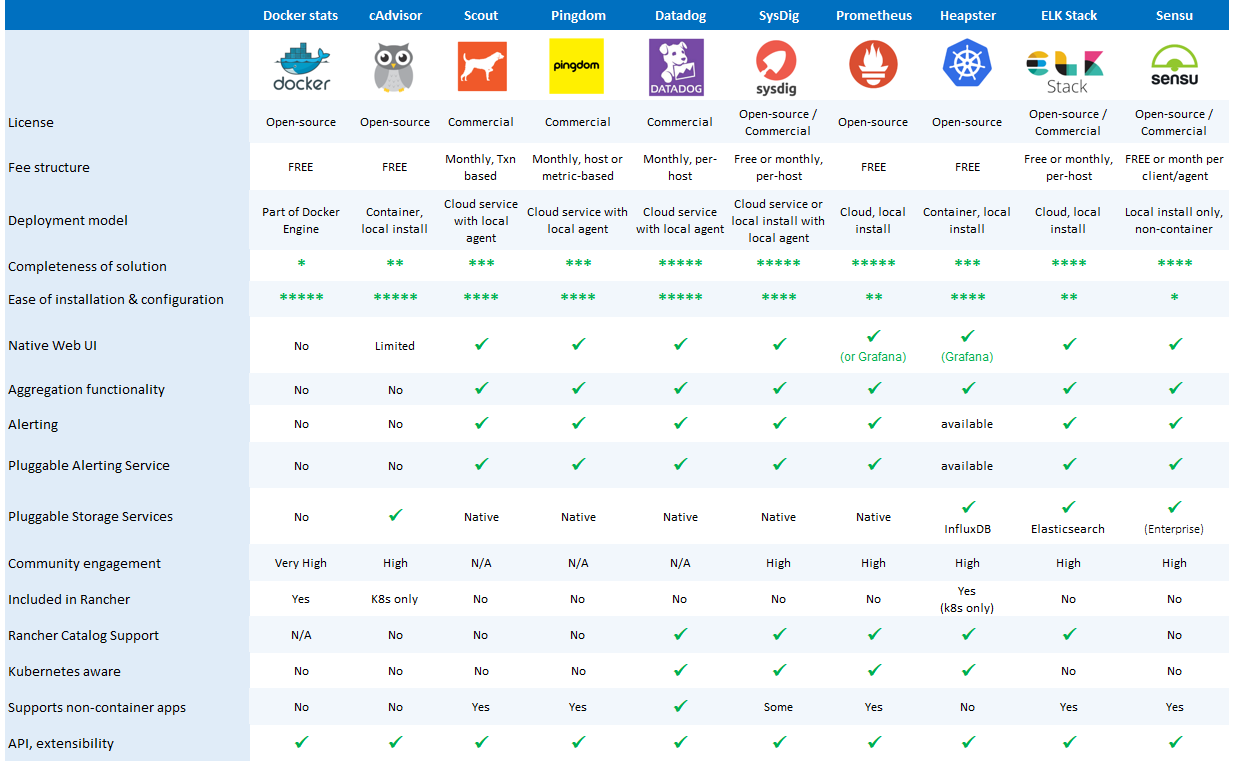
The figure below shows in high-level form how our 10 proposed monitoring solutions correspond to the seven-layer comparison model we proposed above, which components implement the functions of each layer, and where the components are located. Each framework is extremely complex, and the comparison in the diagram below is undoubtedly a simplification, but it will also give you a useful perspective on the function of each component.  The following diagram summarizes the additional properties of each monitoring solution. Some of these solutions have multiple deployment options, so the comparison between them becomes more nuanced.
In-depth study of each solution
DOCKER STATS
https://www.docker.com/docker-community
Docker provides built-in command monitoring capabilities for the Docker host through the docker stats command. Administrators can query the Docker daemon and get detailed real-time information about container resource consumption data, including CPU and memory usage, disk and network I/O, and the number of running processes. Docker stats utilizes the Docker Engine API to retrieve this information. Docker statistics has no concept of history, it can only monitor a single host, but smart administrators can write scripts to collect data from multiple hosts.
Docker stats are of limited use on their own, but Docker stats can be combined with other data sources, such as Docker log files and Docker events, for higher-level monitoring services. Docker can only get data reported by a single host, so Docker stats has limited capabilities for monitoring Kubernetes or Swarm clusters using multi-host application services. With no visual interface, no aggregation, no data storage, and no way to collect data from multiple hosts, Docker's statistics don't work well for our seven-layer model. Since Rancher runs on Docker, Rancher users can automatically use basic docker stats functionality.
CADVISOR
https://github.com/google/cadvisor
cAdvisor is an open source project like Docker stats that provides users with resource usage information about running containers. cAdvisor was originally developed by Google to manage its lmctfy containers, but it now supports Docker as well. As a daemon, it collects, aggregates, processes and exports information about running containers.
cAdvisor has a web interface and can generate multiple graphs, but like Docker stats, it only monitors a single Docker host. It can be installed on a Docker machine as a container, or on the Docker host itself.
cAdvisor itself only retains 60 seconds of information. cAdvisor needs to be set up to log data to an external data repository. Data repositories commonly used for cAdvisor data include Prometheus and InfluxDB. While cAdvisor is not a complete monitoring solution by itself, it is often an integral part of other monitoring solutions. Before Rancher version 1.2, Rancher had cAdvisor embedded in the Rancher agent (for Rancher's internal use), but this is no longer the case. Recent versions of Rancher use Docker statistics to collect information exposed through the Rancher UI, as they reduce overhead.
Administrators can easily deploy cAdvisor on Rancher, which is part of several synthetic monitoring stacks, but cAdvisor is no longer part of Rancher itself.
SCOUT
Scout is a Colorado-based company that provides cloud-based application and database monitoring services, primarily targeting Ruby and Elixir environments. Its existing monitoring and alerting architecture enables it to monitor Docker containers.
We mention Scout because it was mentioned earlier when comparing solutions for monitoring Docker. Scout provides comprehensive data collection, filtering and monitoring capabilities through flexible alerting and integration with third-party alerting services.
Scout's team provides guidance on how to write scripts using Ruby and StatsD to leverage the Docker Stats API, Docker Event API, and pass data to monitor these scripts. They also packaged a Docker-scout container, available on Docker Hub (scoutapp/Docker-scout), which makes installing and configuring the scout agent simpler. Ease of use depends on whether users configure the StatsD agent themselves or use the packaged docker-scout container.
As a managed cloud service, ScoutApp can save you a lot of hassle when it comes to getting your container monitoring solution up and running quickly. If you are deploying Ruby applications or running a Scout-backed database environment, using Scout solutions can help you integrate your Docker, application and database level monitoring well.
However, users may need to be aware of a few things. On most service levels, the platform only allows 30 days of data retention, not per monitored host. As for the price, the standard package with monthly pricing ranges from $99 to $299. This out-of-the-box solution can only extract and deliver limited metrics and is not well suited for Kubernetes-related monitoring. Also, while docker-scout is available on Docker Hub, development is done by Pingdom, and there have been only minor updates to Scout's proxy component over the past two years.
Rancher itself does not natively support Scout by default, but since Scout is a cloud service, it is easy to deploy and use in Rancher, especially when using container-based agents. Currently, the docker-scout agent is not in the Rancher application directory.
PINGDOM
Above we mentioned Scout as a cloud-hosted application, so we also need to mention a similar solution called Pingdom. Pingdom is a managed cloud service operated by Austin, Texas-based SolarWinds, a company focused on monitoring IT infrastructure. Pingdom's primary use case is website monitoring, and as part of its server monitoring platform, Pingdom offers around 90 plugins. In fact, Pingdom maintains docker-scout, and similarly, Scout uses the StatsD proxy.
What makes Pingdom interesting is that its flexible pricing scheme seems to be more suitable for monitoring Docker environments. Users can choose between per-server-based plans based on the amount of StatsD data collected by the plan ($1 per month for 10 data). Easy to set up and manage, Pingdom is a good fit for users who need a complete monitoring solution and those who want to monitor other services beyond a container management platform. Like Scout, Pingdom is a cloud service and easy to use with Rancher.
DATADOG
Datadog is another commercially hosted cloud monitoring service similar to Scout and Pingdom. Datadog also provides a Dockerized agent for installation on each Docker host; however, instead of using StatsD like the aforementioned cloud monitoring solutions, Datadog has developed an enhanced StatsD called DogStatsD . The Datadog agent collects and passes the complete data provided by the Docker API for more detailed and granular monitoring.
Although Datadog does not natively support Rancher, there is a Datadog directory in the Rancher UI where users can easily install and configure the Datadog agent on Rancher. Users can also use Rancher tags, and reports in Datadog reflect the tags you use for hosts and applications in Rancher. Compared to the aforementioned cloud services, Datadog is able to provide better data access and finer-grained definition of alert conditions. Like other services, Datadog can be used to monitor other services and applications and has over 200 integrated libraries. Datadog also retains full-resolution data for 18 months, which is longer than cloud services.
The advantage of Datadog over other cloud services is that it has integration capabilities beyond Docker and can collect data from Kubernetes, Mesos, etcd, and other services running in your Rancher environment. This versatility is important for users running Kubernetes on Rancher as they want to be able to monitor data such as Kubernetes pods, services, namespaces, and kubelet health. The Datadog-Kubernetes monitoring solution automatically deploys data collection agents to each cluster node through DaemonSets in Kubernetes.
Datadog is priced at about $15 per host per month, with the total price increasing based on the services users need and the number of containers monitored per host.
Epilogue
In the next article, we will continue to compare five other monitoring solutions: Sysdig, Prometheus, Heapster/GrafanaPingdom, ELK and Sensu, so stay tuned.