1. Conditional breakpoint
2. Back to the "previous step"
3. Multi-threaded debugging
4. Remote debugging
5. Temporary execution of expressions/modification of the running value of variables
Conditional breakpoint
Conditional breakpoint is when a certain condition (usually an expression) is met, the debug breakpoint will take effect; this is very useful for debugging in the loop; for example, we want to debug in the loop body: when a certain variable satisfies a certain When there are conditions, breakpoint debugging is required to view the detailed execution process and changes.
As we said, the debug function in IDEA is very powerful, and it is also very simple to use conditional breakpoints. The content in Condition in the picture below represents that when the name is eamon:23, the program execution stops at the breakpoint. Right-click on the red origin of the breakpoint and the box will pop up.

Back to the previous step

Or you can also find the Drop Frame 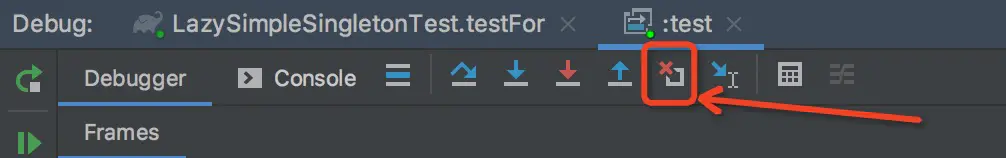
in the following figure: In IDEA, the so-called rollback is called Drop Frame. After selecting Drop Frame, the program will jump back to the place where the current method is called. Of course, the changed value will not be restored. of. But when the method is called again, you can observe when a certain variable is changed, at least we don't have to run the program again.
Note: Curiosity is the ladder of human progress. If you want to know why this feature is called Drop Frame, instead of something like Back To Previous, you can go to the JVM book. The JVM saves the running of threads in stack frames. State, drop frame means throwing away the currently running stack frame, so that the position of the current "pointer" will naturally go to the position of the previous frame.
Multi-threaded debugging
When debugging in idea, there are multiple threads in the code. I want to track the code in the thread. The code is as follows:
        for (int i = 0; i < 5; i++) {
            final int index = i;
            executorService.execute(new Runnable() {
                @Override
                public void run() {
                    System.out.println(index);
                }
            });
        }
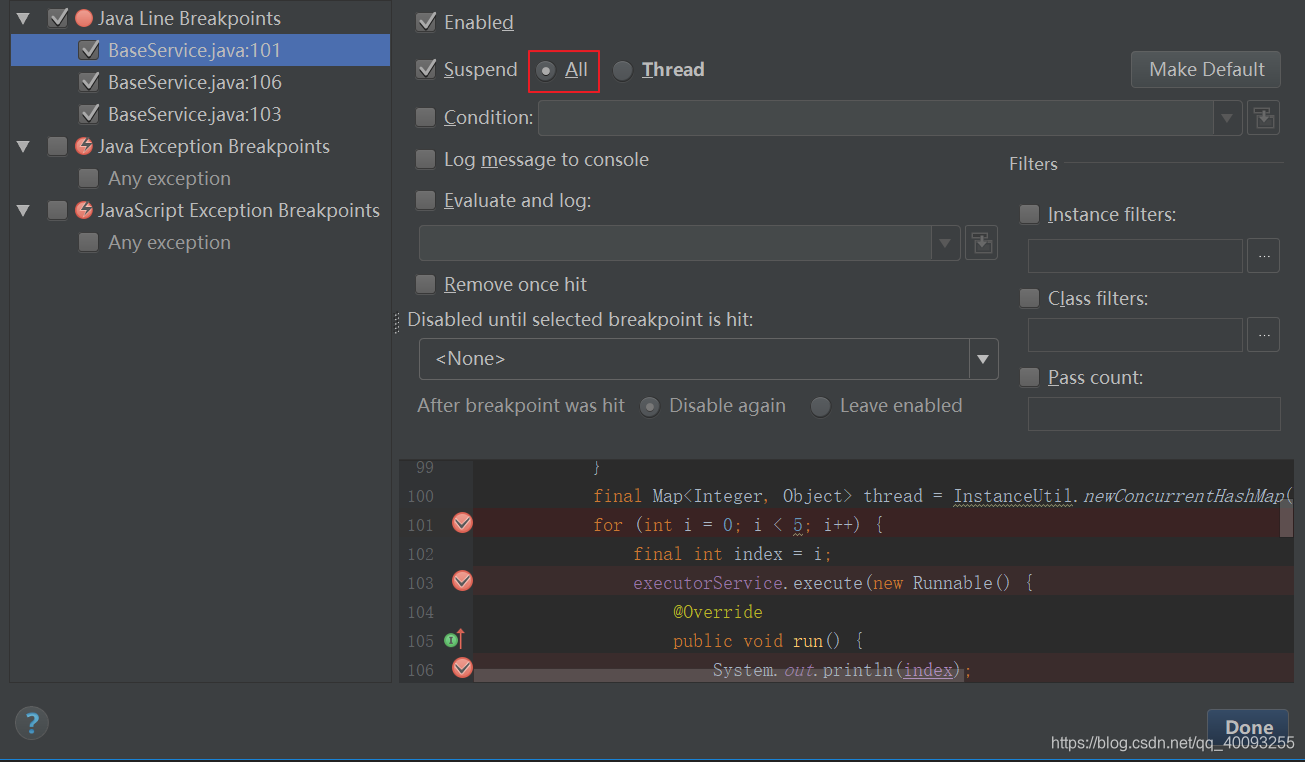
Three breakpoints were hit in the above code, as follows:

It turns out that debug is divided into levels: all, thread 
defaults to all, and then it will only debug to the breakpoint of this thread. If you modify it to thread, you can swap Thread to debug.
Note: Be careful, if you want to enter Thread Debug, all breakpoints must be of Thread type, otherwise you still can’t enter. For example, I used All
Breakpoint 2 and Breakpoint 3 for breakpoint 1. If it is of Thread type, you will find that breakpoint 3 cannot be entered at all. . . If you enter, the following prompt will appear, 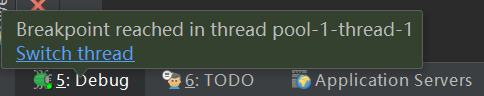
you can switch the process

Remote debugging
The machine does not need to start the project, as long as the source code is available, the code on the server can be debugged directly on the machine. The opening posture is as follows:
4.1 When the project starts, first allow remote debugging
java -server -Xms512m -Xmx512m -Xdebug -Xnoagent -Djava.compiler=NONE -Xrunjdwp:transport=dt_socket,server=y,suspend=n,address=9081 -Djava.ext.dirs=. ${main_class}
What works is
-Xdebug -Xnoagent -Djava.compiler=NONE -Xrunjdwp:transport=dt_socket,server=y,suspend=n,address=9081
Note: Technically speaking, remote debugging is to establish scoket communication between the local machine and the remote, so the port should not conflict, and the machine should allow access to the remote port. In addition, this parameter should be placed in front of -jar or ${main_class}
Set up remote debugging in the idea, 
and then you can debug. The 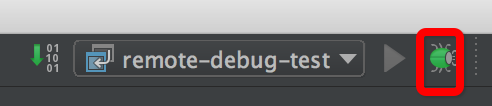
premise is that the machine has the source code of the project, hit a breakpoint where you need it, and then try to access a remote url, the breakpoint will stop.
Temporarily execute expressions/modify the running value of variables
When debugging, you can temporarily execute some expressions. Refer to the figure below: click on any one of these two icons. 
After clicking the + sign, you can enter the expression in the newly appeared input box, such as i+5 
and then back You can see the result right away. 
Of course, if you want to dynamically modify the value of a variable during debugging, it’s easy to right-click on the variable and select Set Value. The rest of the world knows everything.

to sum up
Make good use of the above debugging skills, and you will feel more comfortable when you pick up the code.