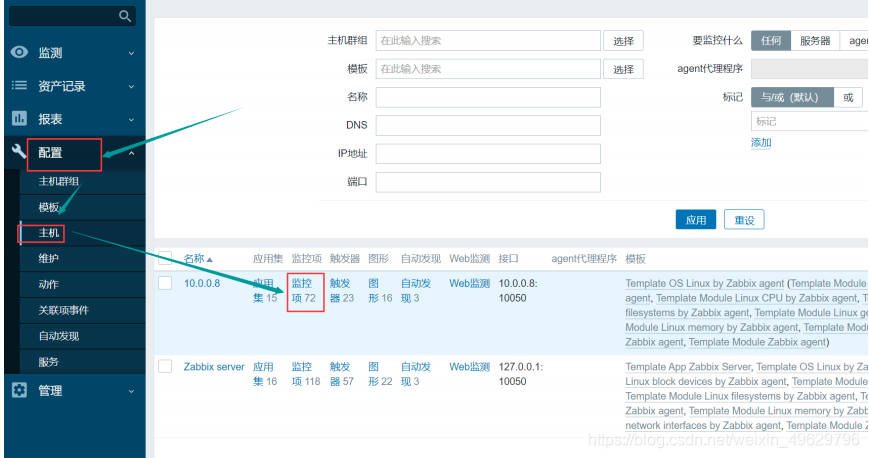
Custom items
What is a monitoring item?
Monitoring items: the indicators we want to monitor, such as remaining memory, disk space, service status, etc.
Each monitoring item has a unique key, which is concise and clear (equivalent to the variable name of a shell script)
Only need to install zabbix-agent, a large number of monitoring items are supported by default, but the linux template does not use all monitoring items
Template OS Linux by Zabbix agent mainly monitors cpu, memory, disk, network card, security, they are all general monitoring
Application set is a grouping of monitoring items
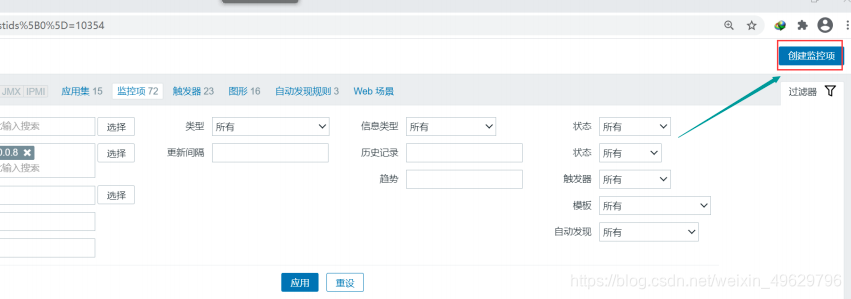
Use the built-in key to monitor the status of nginx
![proc.num[nginx] This key value is mainly for the number of nginx processes](https://img-blog.csdnimg.cn/20210202192628220.png?x-oss-process=image/watermark,type_ZmFuZ3poZW5naGVpdGk,shadow_10,text_aHR0cHM6Ly9ibG9nLmNzZG4ubmV0L3dlaXhpbl80OTYyOTc5Ng==,size_16,color_FFFFFF,t_70)
(Note: It is best to use zabbix-get to test the value before adding monitoring items)
#只在zabbix-server上安装
yum install zabbix-get -y
zabbix_get -s 127.0.0.1 -k proc.num[nginx]
#注释
-s 被监控主机的ip地址
-p 端口
-k 指定监控项的key
Modify the agent2 system configuration file on the zabbix-agent host, otherwise zabbix-get cannot be used on the zabbix-server host
vim /usr/lib/systemd/system/zabbix-agent2.service
User=root
Group=root
Use custom monitoring items to monitor NGINX
and modify the agent configuration file on the zabbix-agent host
vim /etc/zabbix/zabbix_agent2.conf
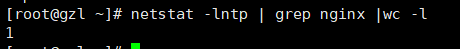
UserParameter=nginx_status,netstat -lntp|grep -c nginx
(nginx_status 是自定义键值(监控项、key) netstat -lntp|grep -c nginx 是查看nginx启动了几个.
总结起来来说就是看nginx启动了几个端口赋值给 nginx_status 这个自定义的监控项)
Restart the agent on the zabbix-agent host to take effect
systemctl restart zabbix-agent2.service
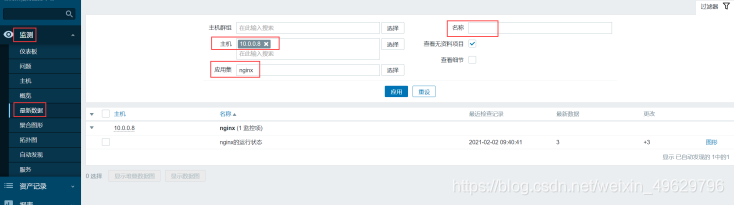
Use zabbix-get to test the value
#只能在zabbix-server上执行
zabbix_get -s 10.0.0.8 -k nginx_status

Use custom monitoring items to monitor NGINX enhanced version It is
recommended to separate agent custom monitoring items into a configuration file
vim /etc/zabbix/zabbix_agent2.d/zbx_nginx.conf
UserParameter=nginx_status,netstat -lntp|grep -c nginx
好处:可以复用,管理更加的方便
Corresponding to regular monitoring items
UserParameter=mysql_Uptime,echo 'show status;'|mysql -uroot|grep -w 'Uptime'|awk '{print $2}'
UserParameter=mysql_Com_select,echo 'show status;'|mysql -uroot|grep -w 'Com_select'|awk '{print $2}'
UserParameter=mysql_Com_delete,echo 'show status;'|mysql -uroot|grep -w 'Com_delete'|awk '{print $2}'
1
Suitable for using custom monitoring items with reference
UserParameter=mysql_define[*],echo 'show status;'|mysql -uroot|grep -w "$1"|awk '{print $$2}'
这里的$1是对应mysql_define[*]里面的那个*   $2依旧是取第二列的值
Value effect
[root@zabbix-server ~]# zabbix_get -s 10.0.0.8 -k mysql_define[Uptime]
827
[root@zabbix-server ~]# zabbix_get -s 10.0.0.8 -k mysql_define[Com_select]
1
[root@zabbix-server ~]# zabbix_get -s 10.0.0.8 -k mysql_define[Com_insert]
0
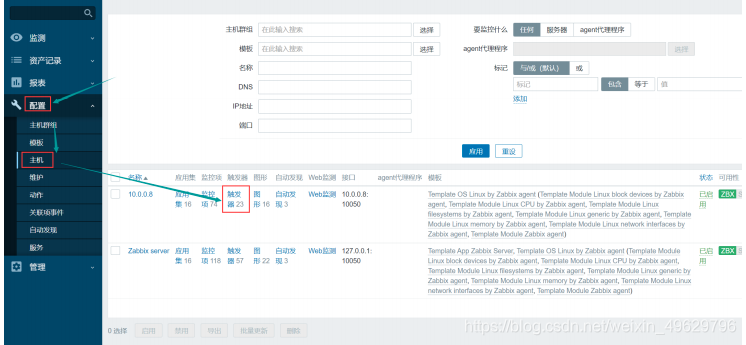
Custom trigger
What is a trigger?
Trigger: Set an alarm condition (a trigger corresponds to at least one monitoring value)
Format of trigger expression:
example one
{

    10.0.0.8:vfs.file.cksum[/etc/passwd].diff()}>0
主机:10.0.0.8
key值:vfs.file.cksum[/etc/passwd]
函数方法:diff() 对比两次监控项的值
如果两次对应的值大于了0 就报警 (是zabbix报警 不是生活中的报警)
Example two
{

    10.0.0.8:proc.num.last()}/{

    10.0.0.8:kernel.maxproc.last()}*100>80
10.0.0.8:proc.num:当前运行进程数量
10.0.0.8:kernel.maxproc 系统最大允许进程的数量
函数方法:last() 最新值   (生产中last()用的比较多,比如你的某个业务down掉了,监控项里用last()就会自己立即报警,不会墨迹)
Example 3
{

    10.0.0.8:vm.memory.size[available].min(5m)}<{

    $MEMORY.AVAILABLE.MIN} and{

    10.0.0.8:vm.memory.size[total].last()}>0
函数方法 mim(5m) 五分钟之内最小的值, max(5m) 五分钟之内最大的值, avg(5m) 五分钟之内的平均值
{

    $MEMORY.AVAILABLE.MIN}=20m
and 同时
10.0.0.8:vm.memory.size[total] 最新的总内存大小
available和total是free -m 里的
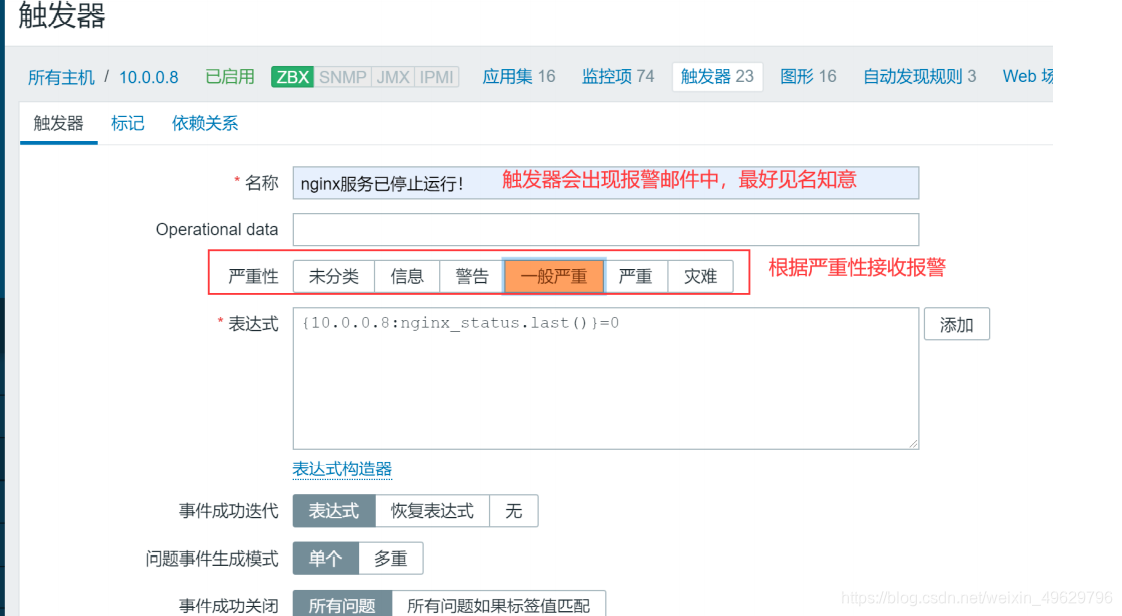
Custom trigger expression
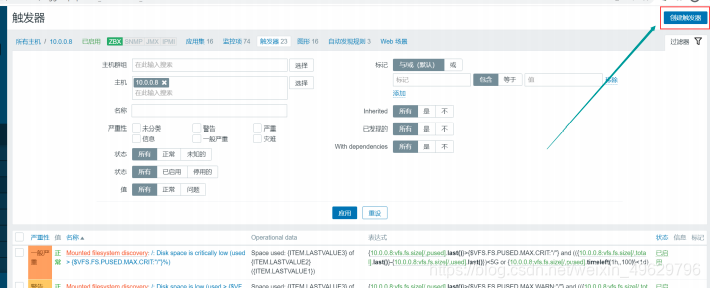
i[External link picture is being transferred...(img-TScQ2nfv-1612268750390)]
Custom alarm
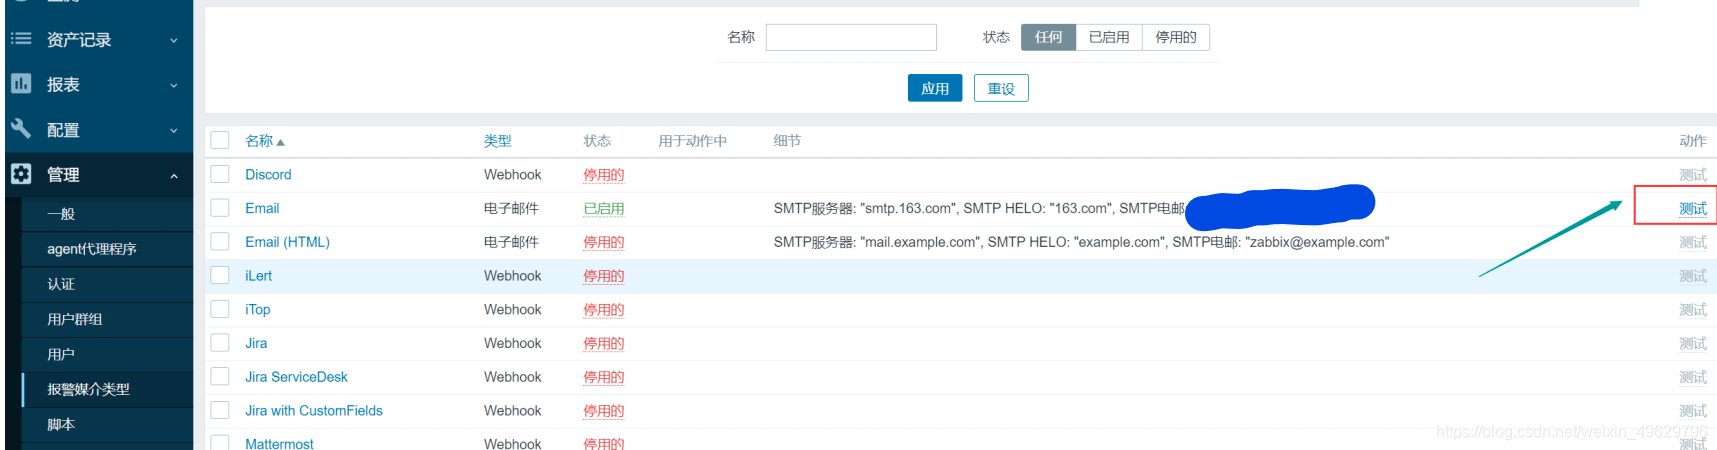
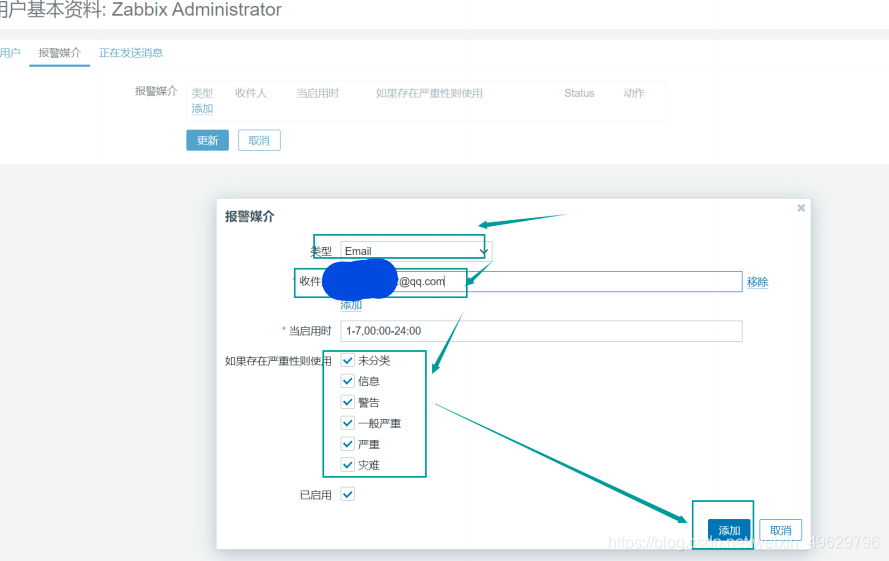
Email alarm
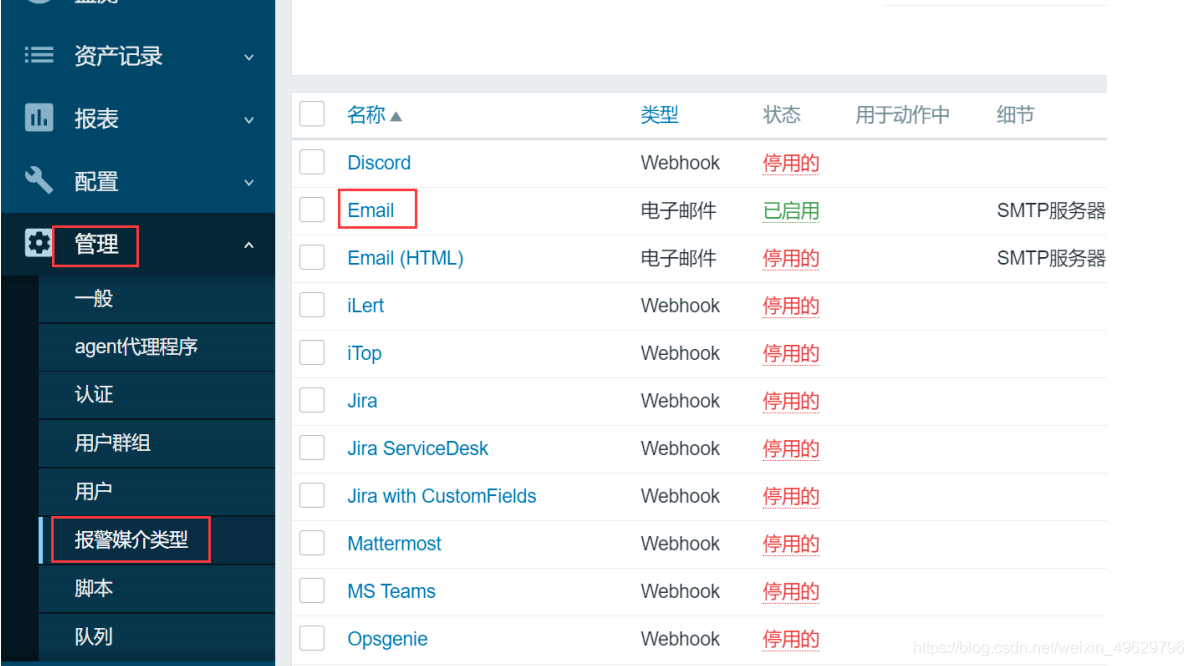
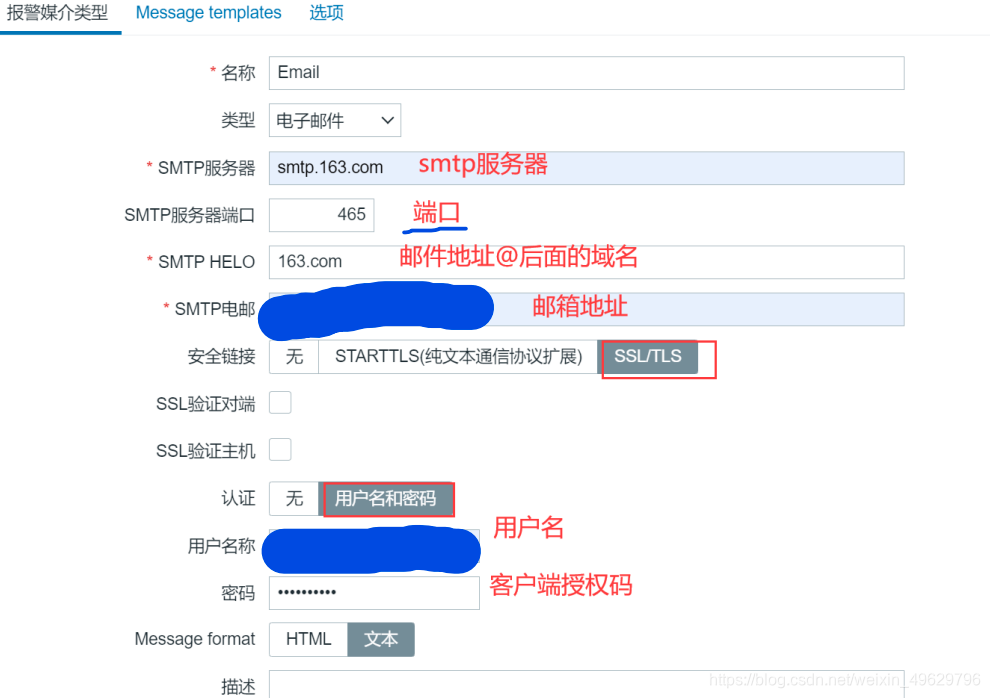
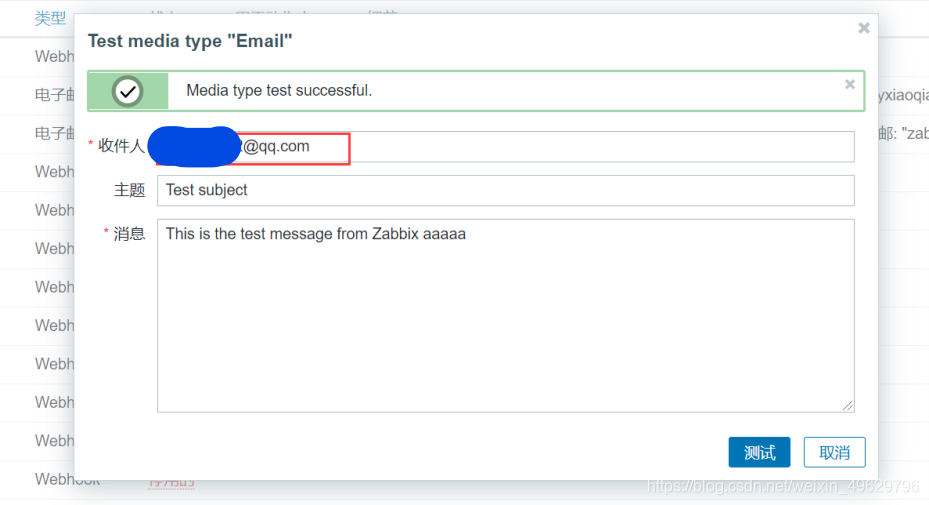
What I am testing here is that the NetEase mailbox is the sender, and the test qq mailbox is the recipient. After the test is successful, the recipient can be configured!
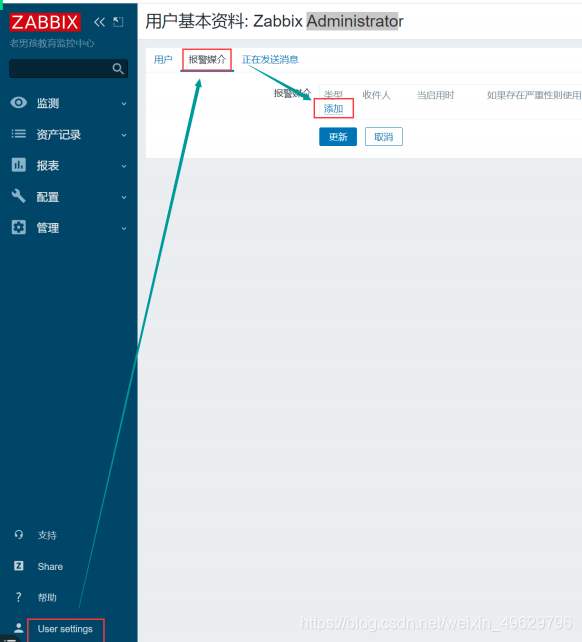
Configure recipients:
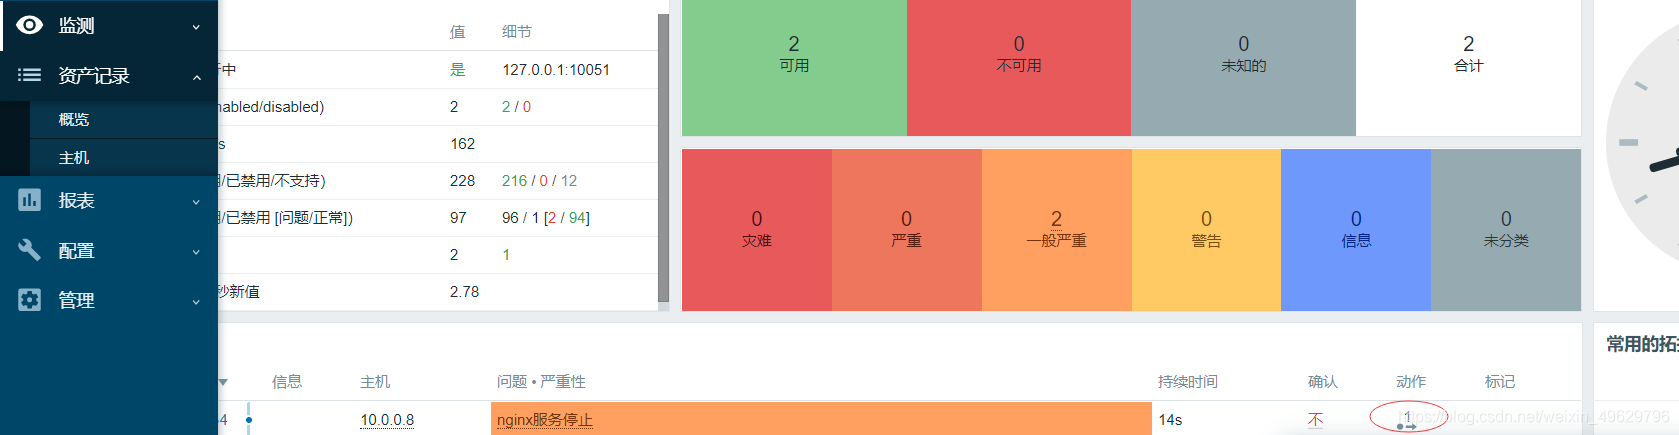
I have turned off NGINX on zabbix-agent for testing purposes.
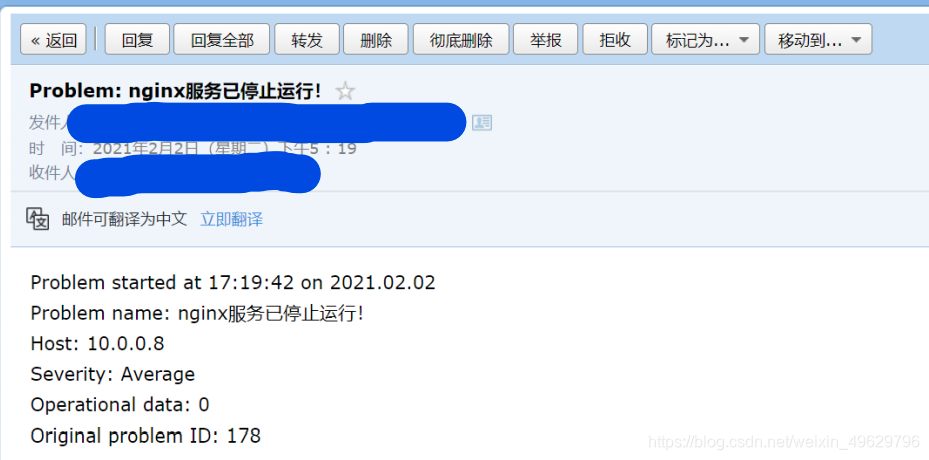
If your QQ mailbox can receive alarms (don’t get me wrong with zabbix’ alarms), congratulations on your successful completion of the post.